Development of milk chocolate using response surface methodology (RSM)
Bạn đang xem bản rút gọn của tài liệu. Xem và tải ngay bản đầy đủ của tài liệu tại đây (702.46 KB, 14 trang )
Int.J.Curr.Microbiol.App.Sci (2017) 6(6): 2881-2894
International Journal of Current Microbiology and Applied Sciences
ISSN: 2319-7706 Volume 6 Number 6 (2017) pp. 2881-2894
Journal homepage:
Original Research Article
/>
Development of Milk Chocolate Using Response Surface Methodology (RSM)
Singh Manpreet*, Chawla Rekha, Khatkar Sunil Kumar and Singh Sandeep
Dairy Technology Division, Guru Angad Dev Veterinary and Animal Sciences University
(GADVASU), Ludhiana, 141004, Punjab, India
*Corresponding author
ABSTRACT
Keywords
CCRD- Central
Composite Rotatory
Design, RSM –
Response Surface
Methodology,
Process
Optimization,
Sensory attributes.
Article Info
Accepted:
26 May 2017
Available Online:
10 June 2017
Milk chocolate was prepared with different levels of SMP, Sugar, C. Powder and
C. Butter. The optimization was carried out using central composite rotatory
design (CCRD) of response surface methodology, and the prepared product was
examined for sensory and physical attributes. Cocoa powder had a significant
effect on all responses at the linear level except flavour of milk chocolate. Cocoa
butter affected the mouth feel, melting, sweetness and OA of the product at linear
level, and SMP had a significant effect only on colour of milk chocolate at linear
level. The sensory scores of prepared product for appearance, flavour, mouth feel,
melting, texture, sweetness and overall acceptability varied from 7.12 to 8.1, 6.7 to
7.92, 6 to 8.25, 6.6 to 7.95, 6.5 to 8.05, 6.3 to 7.7 and 6.55 to 7.9 respectively. On
the basis of sensory scores, product optimization was carried out aiming some
minimum criteria of desired results. The results of the analysis showed that all the
examined model solutions had significant influence on the different parameters
indicating that the statistical model designed for these attributes fitted well in
quadratic equation in all aspects of model efficiency check (R2>0.80).
Introduction
Chocolate the food of god - is one of the most
popular and common confectionary food
product in the world and people enjoy its
wonderful taste as it melts in the mouth. It is
the product of cocoa and is made by mixing
cocoa powder, sugar and milk powder in
continuous fat phase, cocoa butter.
It can be either in the form of a liquid, paste
or a block or used as a flavouring ingredient
in different foods (Shahkhalili et al., 2000).
Chocolate was introduced to Europe
exclusively in Spain in the 16th and 17th
century. The industrialization of chocolate
production began in the beginning of the 20th
century but even then it remained an adult
luxury product, only for special occasions,
celebrations or tender moments between
friends (Jyothi, 2003). According to
proportion of different ingredients used in
preparation of chocolate, three main
categories of chocolates are Dark, White and
Milk chocolate. Milk powder is the major
ingredient of milk chocolate and affects the
sensory attributes of the chocolate and the
rheological properties of chocolate fluid mass.
2881
Int.J.Curr.Microbiol.App.Sci (2017) 6(6): 2881-2894
In the manufacturing process of chocolate,
solid particles are milled in refiner in order to
form a chocolate into uniform mass and
appropriate size distribution of solid particles.
Among various ingredients, cocoa butter is
central for enjoyment of its taste as it allows
the chocolate solid at ambient temperature
and melts it at body temperature. The oral
liquefaction of chocolate is due to fat melting
characteristic and this property of melting,
influences the perception of flavour and
mouth feel attributes. The market of chocolate
is catching the increasing trend in the world
and in India among all the confectionary food,
chocolate ranks first (Jyothi, 2003). Some
natural products have been claimed to
successfully treat a wide range of disorders
and chocolate is consider as one of them.
Chocolate is not only a product of blend of fat
and sugar for pleasant taste but also have
many beneficial and medicinal effects in the
body. Chocolate is the rich source of
flavonoids and polyphenols having high
antioxidant activities (Pimsentel et al., 2010;
Schinella et al., 2010 and Vanzani et al.,
2011). The use of Theobroma cacao as a
medicine in the past was ample, but there was
no progress in medical uses and keeping this
point in mind recent study have demonstrated
a potential and unexpected role of cacao in
“promoting health” of consumer and
preventing from many diseases (Ding, 2006 ;
Grassi, 2006). Many researchers have proven
the beneficial health effect of chocolate on
coronary vasculature (Allen et al., 2008);
insulin secretion (Taubert et al., 2007); and
endothelial function (Davison et al., 2008).
Apart from these, animal studies have shown
that the absorbed flavonoids directly interact
with a number of cellular and molecular
targets in the animal brain, exerting
pronounced anti-oxidative effects and
improving brain tissue and function in the
regions mainly implicated in learning,
memory, and cognition (Andrés-Lacueva et
al., 2005; Passamonti et al., 2005; Vauzour et
al., 2008).
Materials and Methods
The cocoa butter (continuous fat phase
ingredient) for preparing the chocolate was
procured from chocoville cocoa butter,
Indore. Skim milk powder was procured from
The Punjab State Cooperative Milk Producers
Federation Limited available under the brand
name Verka. Cocoa powder that has been
used in milk chocolate preparation was
procured from-Hershey’s cocoa, Mumbai, and
Icing sugar of good quality was procured
from the local market of Ludhiana. To
prepare smooth texture of chocolate, SMP
was regrinded in cyclotech, for reducing the
particle size diameter of skim milk powder
from initial particle size 100-120 micron to
final particle size 20-25 micron. Planetary
mixer procured from Orange Foodstuff
Equipment Pvt. Ltd., Mumbai (Model - HC
B5) was used for proper mixing of the dry as
well as wet ingredients and also for
preparation of milk chocolate.
In the prepared product the physico-chemical
characteristic were analysed in terms of its
moisture (IS: 1964), fat, protein, sugar (IS:
1981), ash and acidity (AOAC 1975) and
water activity (Using AQUALAB Wateractivity meter, Model no. 4TE) according to
the mentioned standard procedure.
Milk chocolate preparation
The pre-weigh ingredients (SMP, Sugar,
Cocoa powder) were properly mixed in
planetary mixer at 300-350 rpm. After proper
mixing, cocoa butter (38-40º C) was added
and contents were mixed for 1.30-2 hours, for
proper mixing of the ingredients and flavour
development. This step imitated commercial
conching process to prepare a smoother and
silkier chocolate. When ingredients were
2882
Int.J.Curr.Microbiol.App.Sci (2017) 6(6): 2881-2894
properly mixed and form a paste like
structure, the mix was poured in mould of
desired shape and kept at refrigeration
temperature. After 30 minutes, the moulded
product was kept out and packed in
aluminium foil to avoid contamination of
chocolate. Figure 8 shows the flow diagram
for milk chocolate preparation.
Experiment design
The preliminary experiment showed that the
level of above mentioned ingredients and
particle size of ingredients are the most
critical factor for preparation of milk
chocolate. On the basis of preliminary trials,
the upper and lower level of ingredients was
selected. Central Composite Rotatable Design
(CCRD), for four variables of product was
adopted to optimize the level of ingredients
and to elucidate the effect of these ingredients
on the sensory properties. From response
surface methodology, 30 runs were obtained
in which 6 replicates were at centre point. The
range of ingredient for SMP, icing sugar,
cocoa powder and cocoa butter was- 16 to 20,
39 to 43, 8 to 12 and 27.5 to 33, percent
respectively. The experiment design in actual
values of variables is shown in table 1 while
the coded and uncoded forms of the design
matrix for the experiments are presented in
table 2. The data were analysed, and a
prediction equation was generated for each
response. The generalized form of the
polynomial equation is given below.
Equation; Y = B0 + B1 X1 + B2 X2 + B3 X3 +B4
X4 + B12 X1 X2 + B13 X1 X3 + B14 X1 X4 + B23
X2 X3 + B24 X2 X4 + B34 X3 X4 +B11 X12 +B22
X22 + B33 X32 +B44 X42
Where,
Y = Sensory or analytical response
X = Independent variables
B = Regression coefficient.
Sensory evaluation
A sensory panel consisting of 8 trained
panellists drawn from the faculty of the
college of Dairy Science and Technology
(GADVASU), Ludhiana, evaluated the
samples of the milk chocolate. The panellists
were served with 8-10 gram of the tempered
milk chocolate bites. These samples were
evaluated for various attributes, namely Appearance, flavour, mouth feel, melting,
texture, sweetness and overall acceptability
using a nine-point hedonic scale rating
(Amerine et al., 1965). This method does not,
of course, reflect actual consumer perception,
but it does strongly indicate attributes which a
good quality product should possess.
Results and Discussion
Colour of the milk chocolate
The colour scores of the milk chocolate were
in the range of 7.12 - 8.1 (Table 3). The
partial coefficient of the regression model
showed that the skim milk powder had a
negative significant effect on the colour of the
milk chocolate at linear level. The negative
sign of linear term means by increasing the
level of skim milk powder the colour score of
the milk chocolate decreased. Similar
negative effect of milk powder and guava
powder was found by Mishra et al., 2016 on
colour of guava milk chocolate. Amitraj et al.,
(2015) also found the negative effect of SMP
on colour of low-fat chhana based dairy
spread. However, cocoa powder; had a
positive significant effect on the colour score
of the milk chocolate at linear level (p˂0.05).
The positive sign of the partial coefficient
indicated that with an increase in the level of
cocoa powder there was increase in the colour
score. Similar finding were reported by
Rathor et al., (2016) wherein increased level
of banana and milk powder had a negative
effect on the colour and increased levels of
2883
Int.J.Curr.Microbiol.App.Sci (2017) 6(6): 2881-2894
cocoa powder exhibited a positive effect in
banana chocolate.
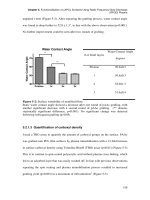
The response surface graph in figure 1a shows
that with increased level of SMP the colour
score decreases while the graph between
cocoa powder and cocoa butter (Fig. 1b)
shows that with increased level of cocoa
powder, the colour score of the milk
chocolate decreased.
Flavour of the milk chocolate
The flavour scores of the milk chocolate were
in the range of 6.7-7.92 (Table 3). The partial
coefficients of regression models indicated
that the cocoa butter had a significant effect
on the flavour score of milk chocolate at
linear level (p˂0.01). This means by
increasing the amount of cocoa butter, there
was improvement in the flavour of the milk
chocolate. This seems to hold true as well, as
butter is the main ingredients which carries
flavour of the chocolate. Skim milk powder
was another important ingredient had a
significant positive effect on flavour of the
milk chocolate at the interactive level with
sugar (p<0.01). However, with cocoa powder
(p<0.05) and cocoa butter (p<0.01) had a
significant negative effect.
Similarly Kulkarni et al., (2012) found the
same result on flavour of jaggery based
nuggets at interaction level. The response
surface graph for SMP and sugar (Fig. 2a)
showed that there was improvement in the
flavour of the milk chocolate when SMP level
was increased. Rathor et al., (2016) reported
that the flavour score increases by increasing
skim milk powder with banana at interaction
level in banana chocolate. The graph for SMP
and cocoa powder (Fig. 2b) shows that the
flavour scores of the milk chocolate decreased
when SMP and cocoa powder increased. In a
similar manner, Rathor et al., (2016) also
found the same effect on flavour of banana
chocolate.
Mouth feel of the milk chocolate
Mouthfeel scores of the milk chocolate
ranged from 6 to 8.25 (Table 3). The partial
coefficients of regression models indicated
that cocoa powder (p<0.05) and cocoa butter
(p<0.01) had a significant effect on the mouth
feel of the milk chocolate (Table 4). The
positive sign of both the ingredients at linear
level expressed, the mouth feel of chocolate,
which increased by increasing both the above
mentioned ingredients. Similarly the effect of
cocoa powder on mouth feel was observed in
guava milk chocolate (Mishra et al., 2016).
Also, the effect of cocoa butter was same as,
higher fat content in the product gave more
smoothness to the product, thus improving the
mouth feel as increasing fat content is related
to a richer mouth feel, faster melting rate and
thus result in giving smoother mouthfeel.
Talbot et al., 2005 in their research also found
the cocoa butter and milk fat in chocolate at
increased level reflecting the same positive
effect on mouth feel. The response surface
graph (Fig. 3) shows that the mouthfeel score
of milk chocolate increases as cocoa butter
level increases in milk chocolate preparation.
Melting of the milk chocolate
Melting scores of the milk chocolate were in
the range of 6.6 - 7.95 (Table 3). The partial
coefficients of regression models indicated
cocoa powder (p<0.01) and cocoa butter
(p<0.01) had a significant positive effect on
the melting of the milk chocolate at the linear
level (Table 4). As cocoa butter have property
to melt at body temperature and people enjoy
its taste as it melts in the mouth. In the same
manner more amount of butter has the
property to melt the chocolate in the mouth
easily which increased the characteristic of
melting and lowered the level of cocoa butter,
kept the chocolate to harder stage. From the
response surface graph (Fig. 4) it was shown
that by increasing cocoa butter and cocoa
powder, melting characteristics of the milk
2884
Int.J.Curr.Microbiol.App.Sci (2017) 6(6): 2881-2894
chocolate improved. Afoakwa et al., (2008)
conducted meltability using Differential
scanning calorimetry, concluded in their
research that dark chocolate having low fat
content melts at high temperature and having
more fat content melts at lower temperature
(body temperature), thus improve the melting
characteristics of chocolate.
Table.1 Levels of ingredients used in central composite rotatable design for milk chocolate
-
14
37
6
24.75
SMP
Sugar
C. powder
C. butter
-1
16
39
8
27.5
Levels of ingredients
0
+1
18
20
41
43
10
12
30.25
33
+
22
45
14
35.75
Table.2 Full experimental design for optimization experiments for developing milk chocolate
using response surface methodology (ingredients in gram)
Experiment No.
1
2
3
4
5
6
7
8
9
10
11
12
13
14
15
16
17
18
19
20
21
22
23
24
25
26
27
28
29
30
SMP
-1
0
0
-1
0
0
0
1
0
1
-1
1
1
0
-1
0
0
-1
-2
0
1
-1
0
1
0
-1
2
-1
1
1
Sugar
-1
0
0
1
0
-2
0
1
0
1
1
-1
-1
2
1
0
0
-1
0
0
-1
-1
0
-1
0
1
0
-1
1
1
Coded values
C. Powder
1
0
0
1
0
0
0
-1
0
1
-1
-1
1
0
-1
-2
0
-1
0
2
-1
1
0
1
0
1
0
-1
1
-1
C. butter
-1
0
2
-1
-2
0
0
-1
0
1
-1
1
-1
0
1
0
0
1
0
0
1
0
0
1
0
1
0
-1
-1
1
2885
SMP
16
18
18
16
18
18
18
20
18
20
16
20
20
18
16
18
18
16
14
18
20
16
18
20
18
16
22
16
20
20
Uncoded values
Sugar
C. Powder
39
12
41
10
41
10
43
12
41
10
37
10
41
10
43
8
41
10
43
12
43
8
39
8
39
12
45
10
43
8
41
6
41
10
39
8
41
10
41
14
39
8
39
12
41
10
39
12
41
10
43
12
41
10
39
8
43
12
43
8
C. butter
27.5
30.25
35.75
27.5
24.75
30.25
30.25
27.5
30.25
33
27.5
33
27.5
30.25
33
30.25
30.25
33
30.25
30.25
27.5
33
30.25
33
30.25
33
30.25
27.5
27.5
33
Int.J.Curr.Microbiol.App.Sci (2017) 6(6): 2881-2894
Table.3 Sensory score of milk chocolate prepared during optimization studies
Experiment
number
1
2
3
4
5
6
7
8
9
10
11
12
13
14
15
16
17
18
19
20
21
22
23
24
25
26
27
28
29
30
Colour
Flavour
Mouthfeel
Melting
Texture
Sweetness
OA
7.77
7.8
7.65
8.05
7.9
7.85
7.7
7.5
7.61
7.7
7.4
7.6
7.68
7.7
7.65
7.58
7.53
7.85
7.9
8.1
7.25
8.08
7.65
7.18
7.65
8.02
7.12
7.69
7.82
7.75
7.35
7.4
7.3
6.7
6.8
7.2
7.4
7.45
7
7.3
6.7
7.43
6.98
7.25
7.15
7.1
7.4
7.85
7.25
7.3
7.7
7.925
7.25
6.8
7.3
7.4
7.3
6.9
7.6
7.45
7.2
7.15
8.25
6.6
6.5
7.2
7.3
6.7
7.225
7.7
6
7.1
7.1
7.1
7.2
6.9
7.5
7.175
7.025
7.475
7.25
7.1
6.8
7.8
7.125
7.6
6.8
6.7
6.8
7.475
7.35
7.15
7.03
6.65
6.6
7
7.1
7
7.48
7.65
6.7
7.4
6.8
6.9
6.8
6.9
7.25
7.1
6.8
7.9
7.35
7.95
7.2
7.6
7.5
7.45
6.9
6.8
7
7.4
7.4
6.9
6.95
6.8
7.15
7.5
7.125
7
7.35
7.55
6.6
7.5
7.2
7.5
6.5
6.7
7.1
6.65
6.8
7.8
7.4
8.05
6.9
7.125
7.175
7.75
7.25
6.8
7
7.4
7.7
7.75
7.375
6.9
6.7
7.3
7.2
6.3
7.45
7.3
6.8
7.2
7.6
7
7.25
6.7
7.5
7.3
7.5
7.6
7.525
7.625
7.5
7.7
7.425
7.425
6.8
6.6
6.8
7.1
7
7.2
7.1
6.7
6.7
7.35
7.2
6.9
7.6
7.6
6.7
7.55
7.1
7.3
7.1
6.6
7.4
7.25
7
7.6
7.3
7.9
7.4
7.45
7.4
7.6
7.2
6.55
7.25
7.3
Scores in bold numeric represent the maximum and minimum value for each particular parameter.
2886
Int.J.Curr.Microbiol.App.Sci (2017) 6(6): 2881-2894
Table.4 Regression coefficient for sensory responses and their level of significance
Factor
Intercept
A
Attributes
Colour
7.6566
-0.149**
Flavour
7.2916
0.0347
Mouthfeel
7.1833
0.0791
Melting
7.28
0.0666
Texture
7.0916
0.1052*
Sweetness
7.4708
-0.0614
OA
7.3666
0.0854
B
0.0204
-0.0452
-0.064
-0.0791
-0.0635
-0.165**
-0.0437
C
0.1104**
-0.0072
0.1437*
0.1625**
0.2177**
0.1989**
0.1645**
D
0.0070
0.1218
0.3458**
0.1900**
0.0802
0.1677**
0.2104**
A²
-0.0430
0.0133
-0.0781
-0.0768
-0.0226
-0.0679
-0.0505
B²
0.0232
0.0008
-0.0187
-0.0518
0.0960*
-0.0679
0.0057
C²
0.0394
-0.0053
-0.0093
0.0606
0.0335
-0.0679
-0.0505
D²
0.0232
-0.0428
0.0375
-0.0856
-0.0164
-0.0960*
-0.1005*
AB
0.0831*
0.1853**
0.0125
0.0937
0.0609
-0.1046
0.0156
AC
-0.0656
-0.1328*
-0.0343
-0.1312*
-0.242**
-0.0265
-0.0781
AD
-0.0443
-0.2140**
-0.0218
0.0062
-0.0234
-0.0328
-0.0968
BC
0.0018
0.0671
0.0218
-0.0125
0.0109
-0.0640
0.0218
BD
-0.0043
-0.0140
0.1843*
0.0125
0.0796
0.1171
-0.0093
CD
-0.0843*
-0.0209
0.0125
0.1250*
0.1140
-0.0359
0.0468
R²
0.8038
0.8057
0.8202
0.8031
0.8030
0.8003
0.8053
4.39
NS
4.44
NS
4.89
NS
4.37
NS
4.37
NS
4.29
NS
4.29
NS
F value
Lack of
fit
Significance level = **p<0.01, *p<0.05
A-SMP, B- Sugar, C- Cocoa powder and D- Cocoa butter.
2887
Int.J.Curr.Microbiol.App.Sci (2017) 6(6): 2881-2894
Fig.1a Represents the Interaction of SMP and sugar on colour score of milk chocolate, whereas Fig.1b represents the Interaction of
cocoa powder and cocoa butter on colour score, Fig.2a shows the Interaction of SMP and sugar on Flavour score of milk chocolate
and Fig.2b show the interaction of SMP and cocoa powder on flavour score of milk chocolate
Fig 1a
Fig 1b
Fig 2a
Fig 2b
2888
Int.J.Curr.Microbiol.App.Sci (2017) 6(6): 2881-2894
Table.5 Model Verification using t-test
Constraints
Predicted
solution
Observed
value (O)
Appearance
Flavour
Mouth
feel
Melting
Texture
Sweetness
Overall
acceptability
7.99
7.84
7.46
7.83
7.78
7.63
7.72
7.94
7.58
7.51
7.84
7.85
7.89
7.8
P (T<=t) two-tail = 0.73, t Critical two-tail = 2.22
The highlightened value signifies NS difference between predicted and observed values. As calculated t (0.73) is
less than table t value (2.22).
Table.6 Physico-chemical parameters of optimized milk chocolate
Sr. No.
Parameter
Sensory scores
1.
Colour
2.
Flavour
3.
Mouthfeel
4.
Melting
5.
Texture
6.
Sweetness
7.
OA
Instrumental Colour Measurement
8.
L*
9.
a*
10.
b*
Texture profile analysis
11.
Hardness
12.
Stringiness
13.
Gumminess
14.
Cohesiveness
15.
Resilience
Microbiological count
16.
SPC
17.
Yeast & mold
18.
Coliform
Proximate Analysis
19.
Water activity
20.
Moisture (per cent)
21
Protein (per cent)
22
Fat (per cent)
23.
Total Sugar (per cent)
24.
Acidity (per cent lactic acid)
25.
Ash (per cent)
2889
Value
7.69±0.23
7.26 ±0.29
7.12± 0.42
7.15±0.35
7.16±0.37
7.23±0.37
7.21±0.32
41.88 ± 1.4
6.52 ± 0.16
5.8 ± 0.16
17.44 ± 0.036 N
15.53 ± 0.10 mm
5.44 ± 0.02 N
0.33 ± 0.004
1.54 ± 0.012
3000cfu/ml
Nil
Nil
0.345 ± 0.0032
1.77 ±0.008
11.58 ± 0.36
32.24 ± 0.18
51.03 ± 1.5
0.42 ± 0.02
1.76 ± 0.04
Int.J.Curr.Microbiol.App.Sci (2017) 6(6): 2881-2894
Fig.3 represents the Interactive effect of sugar and cocoa butter on mouthfeel score of milk
chocolate, Fig.4 represents the Interactive effect of cocoa powder and cocoa butter on melting
score of milk chocolate, whereas Fig.5 shows the Interaction of SMP and cocoa powder on texture,
and Fig.6 and Fig.7 shows the interaction of sugar and cocoa butter on sweetness score and cocoa
powder and cocoa butter on overall acceptability score of milk chocolate, respectively.
Fig 3
Fig 4
Fig 5
Fig 6
Fig 7
2890
Int.J.Curr.Microbiol.App.Sci (2017) 6(6): 2881-2894
Fig.8 Flow diagram of milk chocolate preparation
Receiving of ingredients (SMP, sugar, C. powder and C. Butter)
Weighing of ingredients
Mixing of SMP, Sugar and cocoa powder
Addition of cocoa butter (35-40 ͦ C)
Mixing for 1.30 to 2 hours in planetary mixer (100-120 rpm)
Moulding
Refrigeration (25-30 min.)
Packaging in aluminium foil
Texture of the milk chocolate
Texture scores of the milk chocolate were
ranged from 6.50 to 8.05 (Table 3). The
partial coefficients of regression models
showed that SMP had a significant positive
effect on the texture of the milk chocolate at
the linear level (p<0.5). Cocoa powder was
another ingredient that also had a significant
effect on the texture of the milk chocolate at
the linear level (p<0.1). Same effect was
found by Mishra et al., (2016) in guava
chocolate. However at interaction level, SMP
and cocoa powder effect texture of the milk
chocolate acted inversely. The response
surface graph (Fig. 5) shows that SMP and
cocoa powder decreased the texture score of
the milk chocolate with increased level. The
regression coefficient (Table 4) show that,
Sugar also a positive and significant effect on
the texture of the milk chocolate at quadratic
level (p<0.05), indicating increased sugar
level always improves the texture of milk
chocolate, being a bulking agent. Interaction
of cocoa powder with skim milk powder had
a significant negative impact on texture of
milk chocolate (p˂0.05) (Table 4). The
similar negative effect of SMP and cocoa
powder was also found by Garud et al.,
(2012) in their research on jaggery chocolate
w.r.t texture score.
Sweetness of the milk chocolate
Sweetness scores of the milk chocolate
ranged from 6.3 to 7.7 (Table 3). The partial
2891
Int.J.Curr.Microbiol.App.Sci (2017) 6(6): 2881-2894
coefficients of regression models (Table 4)
showed that the sugar had a significant
negative effect on milk chocolate at linear
level (p<0.01), the negative sign indicate that
the increased level of sugar decrease the
sweetness score for milk chocolate. Jayabalan
et al., (2013) also found the similar results for
taste of Aloe Vera jam, wherein they found
that the sensory value of taste increased with
increase in aloe vera juice and sugar up to
certain level thereafter sensory score
decreased with further increase in aloe vera
juice and sugar. Cocoa powder and cocoa
butter were another ingredients which had a
significant positive effect on the sweetness of
the milk chocolate at linear level (p<0.01).
Similarly, in case of a chocolate-flavored
peanut beverage (CFPB) optimized by
Chompreeda et al., (1989), it was reported
that sweetness was influenced by both sugar
and cocoa powder. The response surface
graph for sweetness of milk chocolate (Fig. 6)
shows that the sweetness score of milk
chocolate increased with increased level of
cocoa butter whereas inverse relation was
observed with respect to sugar addition. At
quadratic level (p<0.05), cocoa butter also
had a significant effect on sweetness of the
product, the negative sign in regression
coefficient table indicates that the sweetness
score decreased by either increased or
decreased level of cocoa butter from centre
point. In a similar manner, Kulkarni et al.,
(2012), found the same effect at quadratic
level in jaggery based nuggets wherein
sensory scores were influenced by increased
or decreased level of cocoa butter from
central point.
Overall acceptability of the milk chocolate
Overall acceptability scores of the milk
chocolate were in the range of 6.55-7.9 (Table
3). The partial coefficients of regression
models (Table 4) indicated that cocoa powder
and butter had a positive significant effect on
the overall acceptability of the milk chocolate
at linear level (p<0.01). Similar results were
also obtained by Garud et al., (2012) in their
research on jaggery chocolate; wherein they
found that the overall acceptability score of
jaggery chocolate improved with the
increased level cocoa butter. Cocoa butter at
quadratic level (p<0.05) also had a significant
negative effect on overall acceptability of
milk chocolate, the negative sign at quadratic
level indicates that the overall acceptability
negatively affected by increased or decreased
level of cocoa butter from central point.
Similar finding were reported by Garud et al.,
(2012) in jaggery chocolate at quadratic level,
Author reported the negative effect of SMP,
cocoa powder and cocoa butter in jaggery
chocolate at quadratic level. The response
surface graph (Fig. 7) shows that cocoa
powder and cocoa butter at increased level
increased the overall acceptability of the milk
chocolate.
The criteria for selecting these responses were
based on literature survey which strongly
recommended sensory evaluation, which
affects the acceptability of the finished
product to a great extent. Optimization of
results was carried out and the goals were set
to arrive at a final recipe formulation. Except
over all acceptability, all the responses were
taken as range and OA was kept at maximize.
From optimization, single solution was
obtained that suited the criteria, was selected,
and the model verification of the selected
solution was done using t-test as shown in
table 5. There was least difference between
the observed score of milk chocolate and the
predicted score by design expert and a nonsignificant difference between these two
values was obtained. It was observed from the
sensory scores at different levels of
ingredients, experiment no. 22 (with
composition SMP 16%,, sugar 39%, cocoa
powder 12% and cocoa butter 33%) had the
highest score for most of the responses. The
optimized results depicted 16, 39, 12 and 33
2892
Int.J.Curr.Microbiol.App.Sci (2017) 6(6): 2881-2894
per cent of SMP, sugar cocoa butter, and
cocoa powder to be used in the formulation to
get a desirable milk chocolate with maximum
acceptability. The results for optimized
chocolate in terms of its physico- chemical
analysis have been mentioned in table 6.
Based on the results of sensory and physical
analysis of the milk chocolate formulated
using different levels of SMP, Sugar, cocoa
powder and cocoa butter, a combination of
the ingredients with very good desired results
was obtained. Response surface methodology
was well suited for evaluating the individual
and interaction effect of variables on sensory
characteristics of milk chocolate. The
optimized formulation, suggested by the
design expert package, contained 16% SMP,
39% sugar, 12% Cocoa powder and 33%
Cocoa butter.
References
Afoakwa, E O., Paterson, A., Fowler, M and
Vieira, J. 2008. Characterization of
melting properties in dark chocolates
from varying particle size distribution
and composition using differential
scanning calorimetry. Food Research
International. 41(7): 751-757.
Allen, R R., Carson, L., Kwik-Uribe, C.,
Evans, E M and Erdman, J W. 2008.
Daily consumption of a dark chocolate
containing flavanols and added sterol
esters affects cardiovascular risk factors
in a normotensive population with
elevated cholesterol. The Journal of
nutrition. 138(4): 725-731.
Amerine, M A., Pangborn, R M and Roessler,
E B. 1965. Principals of Sensory
Valuation of Food. New York:
Academic Press.
Amitraj, K., Khamrui, K., Devaraja, H C and
Mandal, S. 2015. Optimisation of
ingredients for a low-fat, Chhana-based
dairy spread using response surface
methodology. International Journal of
Dairy Technology.
Andres, L C., Shukitt, H B., Galli, R L.,
Jauregui, O., Lamuela, R R M and
Joseph, J A. 2005. Anthocyanins in
aged blueberry-fed rats are found
centrally and may enhance memory.
Nutritional neuroscience. 8(2): 111-120.
AOAC 1975. Official methods of analysis,
12thEdn. Association of Official
Analytical Chemists, Washington, DC.
Chompreeda, P., Haruthaithanasan, V.,
Oupadissakoon, C and Suknak, K.
1989. A research note: Development of
a chocolate flavored peanut beverage.
Journal of Food Science. 54(5):13591360.
Davison, K., Coates, A M., Buckley, J D.,
Howe, P R C. 2008. Effect of cocoa
flavanols
and
exercise
on
cardiometabolic
risk
factors
in
overweight
and
obese
subjects.
International Journal of Obesity. 32(8):
1289-1296.
Ding, E L., Hutfless, S M., Ding, X and
Girotra, S. 2006. Chocolate and
prevention of cardiovascular disease: a
systematic
review.
Nutrition
&
metabolis. 3(1): 2.
Garud, S R and Lamdande, A G. 2012. Effect
of different ingredent levels on texture
of jaggery chocolate evaluated by using
response
surface
methodology.
Quarterly Journal of Life Sciences. 9(4):
654-655.
Grassi, D., Desideri, G., Croce, G.,
Pasqualetti, P A O L O., Lippi, C and
Ferri,
C.
2006.
Cocoa
and
cardiovascular health. The sweet heart
protection. Agro Food Industry HiTech. 17: 13-16.
IS: 1224 (Part 1) 1964. Determination of
moisture content in burfi. Bureau of
Indian Standards. Manak Bhavan, New
Delhi.
2893
Int.J.Curr.Microbiol.App.Sci (2017) 6(6): 2881-2894
IS: SP 18 (Part XI) 1981. Handbook of food
analysis. Part XI, Dairy Products.
Bureau of Indian Standards. Manak
Bhavan, New Delhi.
Jayabalan, K and Karthikeyan, C. 2013.
Optimization of ingredients for sensory
evaluation of Aloe vera jam preparation
using response surface methodology
(RSM). International Journal of
Engineering Research and Applications.
3(1): 1224-1234.
Jyothi, DPT. 2003. The chocolate story: No
clear norms on storage. The Hindu
Group of publications.
Kulkarni, N., Kumar, A., Omre, P K and
Kumbhar, B K. 2012. Ingredients
optimization in jaggery based nuggets
with spices using RSM. International
Journal of Processing & Post Harvest
Technology. 3 (2): 237-242.
Mishra, D., Kumar, C A., Bhardwaj, R.,
kumar, P and Yadav, D. 2016.
Optimization of Guava Milk Chocolate
Using Response Surface Methodology.
Biosciences, Biotechnology Research
Asia. 13(3): 1715-1723.
Pimentel, F A., Nitzke, J A., Klipel, C B and
de Jong, E V. 2010. Chocolate and red
wine–A comparison between flavonoids
content. Food Chemistry. 120(1): 109112.
Rathor, Y K., Singh, S., Kumar, S and
Pandey, R K. 2016. Optimization and
Storage Study of Banana Chocolate.
International Journal of Agriculture,
Environment and Biotechnology. 9(5):
861-868.
Schinella, G., Mosca, S., CienfuegosJovellanos, E., Pasamar, M Á.,
Muguerza, B., Ramón, D and Ríos, J L.
2010
Antioxidant
properties
of
polyphenol-rich
cocoa
products
industrially processed. Food Research
International. 43(6): 1614-1623.
Shahkhalili, Y., Duruz, E and Acheson, K.
2000. Digestibility of cocoa butter from
chocolate in humans: a comparison with
corn-oil. European journal of clinical
nutrition. 54(2): 120.
Talbot, G. 2005. Cocoa butter and milk fat in
chocolate-Geoff Talbot examines this
aspect
of chocolate
production.
Confection. 49-51.
Taubert, D., Roesen, R and Schömig, E. 2007.
Effect of cocoa and tea intake on blood
pressure: a meta-analysis. Archives of
internal medicine. 167(7): 626-634.
Vanzani, P., Rossetto, M., De Marco, V.,
Rigo, A and Scarpa, M. 2011.
Efficiency and capacity of antioxidant
rich foods in trapping peroxyl radicals:
A full evaluation of radical scavenging
activity. Food Research International.
44(1): 269-275.
Vauzour, D., Vafeiadou, K., RodriguezMateos, A., Rendeiro, C and Spencer, J
P. 2008. The neuroprotective potential
of flavonoids: a multiplicity of effects.
Genes & nutrition. 3(3-4): 115-126.
How to cite this article:
Singh Manpreet, Chawla Rekha, Sunil Khatkar and Singh Sandeep. 2017. Development of
Milk Chocolate Using Response Surface Methodology (RSM). Int.J.Curr.Microbiol.App.Sci.
6(6): 2881-2894. doi: />
2894