Metabolic system alterations in pancreatic cancer patient serum: Potential for early detection
Bạn đang xem bản rút gọn của tài liệu. Xem và tải ngay bản đầy đủ của tài liệu tại đây (2.68 MB, 17 trang )
Ritchie et al. BMC Cancer 2013, 13:416
/>
RESEARCH ARTICLE
Open Access
Metabolic system alterations in pancreatic cancer
patient serum: potential for early detection
Shawn A Ritchie1*†, Hirofumi Akita2†, Ichiro Takemasa2*, Hidetoshi Eguchi2, Elodie Pastural1,3, Hiroaki Nagano2,
Morito Monden2, Yuichiro Doki2, Masaki Mori2, Wei Jin1, Tolulope T Sajobi1,4, Dushmanthi Jayasinghe1,
Bassirou Chitou1, Yasuyo Yamazaki1, Thayer White5 and Dayan B Goodenowe1
Abstract
Background: The prognosis of pancreatic cancer (PC) is one of the poorest among all cancers, due largely to the
lack of methods for screening and early detection. New biomarkers for identifying high-risk or early-stage subjects
could significantly impact PC mortality. The goal of this study was to find metabolic biomarkers associated with PC
by using a comprehensive metabolomics technology to compare serum profiles of PC patients to healthy control
subjects.
Methods: A non-targeted metabolomics approach based on high-resolution, flow-injection Fourier transform ion
cyclotron resonance mass spectrometry (FI-FTICR-MS) was used to generate comprehensive metabolomic profiles
containing 2478 accurate mass measurements from the serum of Japanese PC patients (n=40) and disease-free
subjects (n=50). Targeted flow-injection tandem mass spectrometry (FI-MS/MS) assays for specific metabolic systems
were developed and used to validate the FI-FTICR-MS results. A FI-MS/MS assay for the most discriminating metabolite
discovered by FI-FTICR-MS (PC-594) was further validated in two USA Caucasian populations; one comprised 14 PCs,
six intraductal papillary mucinous neoplasims (IPMN) and 40 controls, and a second comprised 1000 reference subjects
aged 30 to 80, which was used to create a distribution of PC-594 levels among the general population.
Results: FI-FTICR-MS metabolomic analysis showed significant reductions in the serum levels of metabolites belonging
to five systems in PC patients compared to controls (all p<0.000025). The metabolic systems included
36-carbon ultra long-chain fatty acids, multiple choline-related systems including phosphatidylcholines,
lysophosphatidylcholines and sphingomyelins, as well as vinyl ether-containing plasmalogen ethanolamines.
ROC-AUCs based on FI-MS/MS of selected markers from each system ranged between 0.93 ±0.03 and 0.97 ±0.02. No
significant correlations between any of the systems and disease-stage, gender, or treatment were observed. Biomarker
PC-594 (an ultra long-chain fatty acid), was further validated using an independently-collected US Caucasian population
(blinded analysis, n=60, p=9.9E-14, AUC=0.97 ±0.02). PC-594 levels across 1000 reference subjects showed an inverse
correlation with age, resulting in a drop in the AUC from 0.99 ±0.01 to 0.90 ±0.02 for subjects aged 30 to 80,
respectively. A PC-594 test positivity rate of 5.0% in low-risk reference subjects resulted in a PC sensitivity of 87% and a
significant improvement in net clinical benefit based on decision curve analysis.
Conclusions: The serum metabolome of PC patients is significantly altered. The utility of serum metabolite biomarkers,
particularly PC-594, for identifying subjects with elevated risk of PC should be further investigated.
Keywords: Pancreatic cancer, Biomarker, Metabolism, Metabolomics, Screening, Early detection, Mass spectrometry
* Correspondence: ;
osaka-u.ac.jp
†
Equal contributors
1
Phenomenome Discoveries, Inc., Saskatoon, SK, Canada
2
Department of Surgery, Osaka University Graduate School of Medicine,
Osaka, Japan
Full list of author information is available at the end of the article
© 2013 Ritchie et al.; licensee BioMed Central Ltd. This is an Open Access article distributed under the terms of the Creative
Commons Attribution License ( which permits unrestricted use, distribution, and
reproduction in any medium, provided the original work is properly cited.
Ritchie et al. BMC Cancer 2013, 13:416
/>
Background
Pancreatic Cancer (PC) is one of the most challenging
cancers to detect and treat. Currently, PC is diagnosed
by imaging methods such as endoscopic ultrasonography
(EUS) or helical CT scan, typically only after the presentation of symptoms serious enough to warrant the procedure
[1,2]. The low incidence of PC combined with the invasiveness and cost of endoscopic-based approaches make
them unsuitable for average-risk population screening.
Accordingly, over 80% of PC cases are detected at advanced
stages of the disease, wherein the five-year survival rate is
less than 3% [3]. A non-invasive screening test that could
identify high PC-risk subjects for whom the benefit of
endoscopic examination would outweigh the risk of the
procedure is needed, analogous to serum-based GTA-446
testing to identify high risk colorectal cancer (CRC)
subjects who should undergo colonoscopy [4].
The primary risk factors for PC are similar to those for
other cancers, and include age, diet, obesity, exercise
status, smoking status, gender, diabetes, family history
and geography (see [5-9] for review). With respect to
PC specifically, chronic pancreatitis may also be a risk
factor [10]. It is likely that many of these factors
contribute cumulatively to risk over years, given that
PC (or any cancer) does not spontaneously appear
within the body. Since the pancreas is intricately
involved in metabolism, and since most of the aforementioned risk factors have a strong metabolic component, we
questioned the possibility of a unique metabolic signature
correlating with PC.
Non-targeted metabolomics is a hypothesis-generating
approach aimed at broadly characterizing the metabolic
composition of a sample in an unbiased manner by
detecting and identifying as many components in a
sample as possible [11-13]. In this study, a combination of
high-resolution, flow-injection Fourier transform ion cyclotron resonance mass spectrometry (FI-FTICR-MS) and
flow-injection tandem mass spectrometry (FI-MS/MS) was
used to identify and confirm specific dysregulated
metabolic systems associated with PC in two ethnically
and geographically diverse populations.
Methods
Study cohort
All blood samples in this study were collected under
fasted conditions and serum prepared off the clot using
red-topped vacutainer tubes. All samples were stored at
−80°C until analysis. Discovery samples from Osaka
Medical University, Japan, were collected between 2005
and 2007, and included 40 PC patients and 50 matched
disease-free control subjects. The study was approved by
the Osaka University Graduate School of Medicine Medical Ethics Board, ethics board number 213, and all subjects signed informed consents. Samples were drawn,
Page 2 of 17
processed and stored in a consistent manner by qualified
physicians. Of the 40 PC patients, 24 were drawn at the
time of surgery immediately following anesthetization,
and 16 were drawn prior to surgery (not under
anesthesia). Of the total 40, 20 were collected prior to any
chemo or radiation therapy, and 20 were collected during
or after at least one cycle of treatment. Of the 24 drawn
at time of surgery, 13 had undergone treatment. Of
the 16 not collected at surgery, 7 had undergone
treatment. Detailed pathology reports were collected
on all subjects. Further information is provided in Table 1.
Disease-free Japanese control subjects were recruited on
the basis that they had no history of cancer and that
serum levels of the tumor markers CEA, CA19.9, SCC,
AFP, CA125, PSA and CA15.3 were negative.
The North American validation samples were provided
by the Cooperative Human Tissue Network (CHTN),
which is funded by the National Cancer Institute. The
samples included serum from 14 Caucasian PC adenocarcinoma patients, six patients with indraductal papillary mucinous neoplasms (IPMN), and 40 Caucasian cancer-free
controls with no history of cancer. Based on the discovery
results, the study was powered to a sensitivity and specificity of 88% at 10% precision according to the method of
Malhotra et al. [14], resulting in a confidence level of 88%.
The study was approved by Institutional Review Board #4
of the University of Pennsylvania and all patients signed
informed consents. Following analysis, results were sent to
Glycozym Inc. for statistical analysis and un-blinding.
To determine the distribution of PC-594 in the general,
average-risk population, 1000 anonymous (depersonalized)
reference serum samples (598 females and 402 males) were
randomly selected from routine clinical blood draws at the
Central Ohio Primary Care lab (USA control 1, Table 1).
The population included at least 100 samples for each
decade of life between age 30 and 80.
Sample extraction
All serum samples were stored at −80°C until thawed for
analysis, and were only thawed once. All extractions were
performed on ice. Serum samples were prepared for FIFTICR-MS by sequential extractions with 1:1:5 volumes of
1% ammonium hydroxide and ethyl acetate (EtOAc) three
times. Samples were centrifuged between extractions at 4°C
for 10 min at 3500 rpm, the organic layer removed, and
transferred to a new tube (extract A). After the third EtOAc
extraction, 0.33% formic acid was added, followed by two
more EtOAc extractions. Following the final organic extraction, the remaining aqueous component was further
extracted twice with water, and protein removed by precipitation with 3:1 acetonitrile (extract B). A 1:5 ratio of EtOAc
to butanol (BuOH) was then evaporated under nitrogen to
the original BuOH starting volume (extract C). All extracts
were stored at −80°C until FI-FTICR-MS analysis.
Ritchie et al. BMC Cancer 2013, 13:416
/>
Page 3 of 17
Table 1 Description of populations used in the study
FI-FTICR-MS analysis
Japanese controls
All (n)
50
Female (n)
20
Male (n)
30
Age (years, range)
63.8, 40-75
Japanese pancreatic cancer
All (n)
40
Stage I (n)
4
Stage II (n)
4
Stage III (n)
5
Stage IVa (n)
16
Stage IVb (n)
11
Collected at surgery1 (n)
24
Not collected at surgery (n)
16
Sample collected after treatment2 (n)
20
Sample collected prior to treatment (n)
20
Female (n)
14
Male (n)
26
Average age (years, range)
65.2, 31-79
USA Caucasian control 1
All ages (n)
1000
30-39 yrs (n)
103
40-49 yrs (n)
280
50-59 yrs (n)
201
60-69 yrs (n)
214
70-80 yrs (n)
202
Female (n)
598
Male (n)
402
USA Caucasian control 2
All (n)
40
Female (n)
8
Male (n)
21
Gender unknown (n)
11
Average age (years, range)
42.7, 18-60
USA Caucasian pancreatic cancer
All (n)
14
Female (n)
3
Gender unknown (n)
11
Average age (years, range)
70.4, 57-85
USA Caucasian IPMN
All, gender unknown (n)
Average age (years, range)
1
Samples collected under anesthesia.
Chemo/radiation therapy (at least one cycle).
2
6
73.0, 61-80
All analyses were performed on a Bruker Daltonics
APEX III Fourier transform ion cyclotron resonance mass
spectrometer equipped with a 7.0 T actively shielded
superconducting magnet (Bruker Daltonics, Billerica, MA).
Extracts B and C were diluted in methanol:0.1% (v/v)
formic acid and analyzed by electrospray ionization (ESI)
in the positive mode, and methanol:0.1% (v/v) ammonium
hydroxide in the negative mode. Undiluted extract A was
analyzed by flow injection using atmospheric pressure
chemical ionization (APCI). The flow rate for all analyses
was 600 μL/hr. Details of instrument tuning and calibration conditions have been previously reported [15]. All
spectra were calibrated to a mass accuracy of <1 PPM
relative to the theoretical masses of internal standards.
Sample peak intensities were aligned and visualized as a
two-dimensional array using DISCOVAmetricsTM 4.0
(Phenomenome Discoveries Inc.).
FI-MS/MS analyses
FI-MS/MS analyses were performed as previously
described with modifications [16]. All analyses were
performed on a triple quadrupole mass spectrometer
(API 4000, Applied Biosystems) coupled with an Agilent
1200 LC system. Methods were based on multiple reaction monitoring (MRM) of parent/fragment ion transitions specific for each metabolite (see Additional file 1,
Tables S1, S2, S3, S4, S5 and S6). The mobile phase flow
rate for all methods was 600 μL/min. Instrument linearity was determined by the serial dilution of standard in
the appropriate extract of Randox serum (Human Serum
Precision Control Level II). All samples were analyzed in
a randomized blinded manner and were bracketed by
known serum standard dilutions. Results were based on
ratios of integrated analyte peak area to the appropriate
internal standard.
Panel-specific conditions and parameters were as
follows: For the PtdCho and SM panels, 12 μL of extract
B was mixed with 108 μL mobile phase and 15 μL of
0.5ug/ml PtdCho16:0(D31)/18:1 as an internal standard.
For the lysoPC panel, 12 μL of extract B was mixed with
108 μL mobile phase and 15 μL of 0.5 ug/ml of
lysoPC18:0(D35) as the standard. All deuterated standards were purchased from Avanti Polar Lipids. The
mobile phase for the cholines consisted of a 3:1 ratio of
acetonitrile to 1% formic acid in ddH2O. 60 μL of sample cocktail (50 μL for sphingomyelins), were injected by
flow injection analysis (FIA) and monitored under negative ESI using the parent-daughter ion transitions as
listed in Additional file 1. Parameters for the PlsEtn
and PtdEtn panels have been previously reported [16].
Long-chain fatty acids were analyzed using negative
atmospheric pressure chemical ionization (APCI) as
previously described [15].
Ritchie et al. BMC Cancer 2013, 13:416
/>
The quantitative PC-594 FI-MS/MS method was
developed on an Ionics 3Q triple-quadrupole mass
spectrometer coupled to an Agilent 1200 LC system
as above. The Q1/Q2 MRM transitions monitored
were 593/557 in APCI negative mode using extract A
and 13C-cholic acid as a standard [4]. The isocratic mobile
phase was comprised of water-saturated ethyl acetate run at
a flow-rate of 350 μL/min. The auto-sampler temperature
was 22°C and column oven 35°C. Sample injection volume
was 100 μL with a draw speed of 200 μL/min with a
400 μL/min injection speed using an APCI source in
negative mode. The pause time was 5 ms, scan speed was
0.56 sec/scan, and corona discharge, -4. MS system temperatures were: drying gas, 100°C; HSID, 200°C; nebulizer gas,
350°C; and probe, 350°C. Concentration of PC-594 was
determined by extrapolation using a 13C-cholic acid standard curve and was reported as 13C-cholic acid equivalents
(CAEs). Acceptance criteria were that pooled reference
sample reproducibility was <15% RSD and standard curve
R-squared values was >0.98.
Statistics
Metabolite array generation and hierarchical clustering were performed using DISCOVAmetrics™ software
(Phenomenome Discoveries Inc., Saskatoon). Two-tailed
unpaired Student’s t-tests were used to compare PC and
control samples for all masses. False-discovery rate (FDR)
was controlled for by the method of Benjamini-Hochberg
[17]. Principal components analysis (PCA) was performed
in STATA. PCA factor loadings, score plots, uniqueness
and R2 correlations are shown in Additional file 2. We
performed both the Bartlett’s test for non-zero correlation
and the Kaiser-Meyer-Olkin (KMO) test for sample
adequacy prior to PCA. We then selected masses for
which the p-value for the Bartlett’s test was less than .05
and the KMO was greater or equal to 0.81. Random forest
(RF) classification, a non-parametric classification technique that utilizes a classification and regression tree
method for prediction and variable selection, was used to
identify the most discriminatory accurate masses between
PC cases and control subjects. The dataset was split into
two-thirds (n = 58; 22 PC and 36 control) for training and
one-third (n = 32; 18 PC and 14 control) for testing.
The variable selection technique of RF was used to
rank order the masses according to their contribution
to the accuracy of the classifier and by the mean
decrease in Gini index. RF analysis was conducted in
R.2.15.1 ( and the ROC curve for
the RF classifier was generated using JROCFIT 1.0.2 based
on outputted cancer positive probabilities. FI-MS/MS data
analysis was carried out using Analyst 1.5, Microsoft Office
Excel 2010, and STATA 12. ROCs were based on the
continuous distribution of tandem-MS results. Beeswarm
jitter plots in were performed using R.2.15.1.
Page 4 of 17
Calibration was performed to evaluate agreement between
observed and predicted probabilities based on the Random
Forest probability outputs of the Japanese patients and
PC-594 levels in USA patients. For the Random Forest prediction model (calibration plot shown in Additional file 3),
a PC probability of 25% was used as the cutoff; for the calibration plots of the USA data (shown in Additional file 4),
cut-offs yielding 5% positivity in the control groups were
used. The difference between a perfect model (represented
by the first diagonal) and the predicted models based on
logistic regression were represented by the average error
(Eavg) and the maximum errors (Emax). All computations
and curves were performed using STATA 12.
To assess the clinical benefit of our models, we
performed decision curve analysis (DCA) according the
method of Vickers [18,19]. The goal was to determine
whether PC-594 screening prior to performing endoscopic
ultrasound (EUS) would offer any clinical benefit over
either performing, or not performing, EUS on everyone.
The approach models (and compares) the clinical benefits
at increasing probability thresholds (pt’s) for the above
scenarios. DCA was performed on the USA PC population
(and USA 2 controls) using the DCA package in STATA
12. The net clinical benefit of 0.14, at a 20% pt was
calculated as the difference in benefit between screen
all (~0.08) and the model based on PC-594 (~0.22).
Results
FI-FTICR-MS metabolomic analysis
Serum samples from 40 PC patients and 50 controls
(Table 1) were extracted and analyzed by FI-FTICR-MS as
described in the methods, resulting in a two-dimensional
metabolite array containing 2478 sample-specific accurate
masses. We used three independent statistical methods to
investigate the data. First, we reduced the dimensionality
of the data using principal components analysis (PCA) to
determine whether variance in the data correlated with
the presence of PC. Second, we performed hierarchical
clustering (HCA) using a Pearson distance metric to group
masses belonging to related metabolic systems. Third, we
used Random Forest (RF) for its classification and built-in
cross-validation capabilities, and to identify masses with
the strongest discriminating ability.
We first computed the p-value of each mass between
PC patients and controls, controlling for false-discovery
rate (FDR) using the method of Benjamini-Hochberg
[17]. Prior to performing principal components analysis
(PCA), we performed the Bartlett’s test for non-zero
correlation [20] and the Kaiser-Meyer-Olkin (KMO)
test for sample adequacy [21], and accepted only masses
for which the p-value of the Bartlett’s test was less than
0.05 and the KMO was greater than or equal to 0.81
(0.80 and above is considered meritorious). This approach
identified 68 masses that were then subjected to PCA
Ritchie et al. BMC Cancer 2013, 13:416
/>
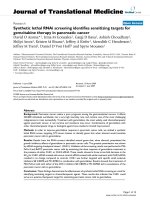
analysis (Figure 1A). Only components for which the
eigenvalue was greater or equal to 1 were retained.
The PCA plot showed separation between PC patients
and controls orthogonally along PC1 and PC2. The
cumulative variance for factors one and two was 63%, and
the average square multiple correlation (R2) among the 68
masses was 0.96. The PCA was highly significant with a
p-value < 0.00001 for the likelihood ratio (LR) test
(independent versus saturated model). The factor variances,
loadings, uniqueness, square factor loadings (Q2) and R2
for each mass are shown in Additional file 2. The results
suggested the presence of biochemical differences between
the sera of PC patients and controls.
We investigated potential bias from other clinical
variables by calculating the p-values for each of the
68 masses according to gender, disease stage, whether
patients had undergone treatment prior to sample
collection, and whether the sample collection was taken at
time of surgery. None of the p-values for any of the
comparisons were significant (FDR considered), and there
were several orders of magnitude in the difference
between the p-values for disease status (PC versus control)
compared to all other variables including gender, disease
stage, treatment status, and sample collection time relative
to surgery (Figure 1B). The results confirmed that the
correlations were specific to PC. All p-values are
listed in Additional file 2.
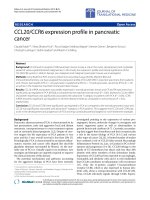
To identify metabolic relationships among the 68
masses selected above, we performed hierarchical clustering (HCA) by mass using a Pearson distance metric, and
by sample using a Manhattan distance metric (Figure 2).
Intensities were control mean-normalized (log2). PC patient
and control samples split into two separate clusters, with
only four subjects (two PC and two controls) misclassified
(top dendrogram). No clusters correlating with gender,
stage, treatment or surgery were observed (see variable
header, Figure 2).
Hierarchical clustering of masses by Pearson correlation resulted in four primary clusters (Figure 2, see left
dendrogram). This approach groups masses based on
their similarity of intensity between samples, meaning
that masses with related fold-changes between subjects
cluster together, independent of their absolute levels.
Often, metabolites belonging to the same system show a
similar pattern, which makes this approach particularly
useful for quickly grouping non-targeted discovery data
into specific metabolic families, for identifying isotope
and adducts, and for aiding in molecular identification.
Overall, cluster one represented masses with mean elevated
levels among PC patients, while clusters two through four
represented masses with reduced levels (Figure 2).
Putative identifications were computationally assigned to
most of the masses using a combination of accurate mass
database searching (DISCOVAmetricsTM, Phenomenome
Page 5 of 17
Figure 1 Principal components analysis (PCA). A, PCA based on
68 masses selected following Benjamini-Hoshberg FDR correction
(p<2.5E-5), Bartlett’s test for sphericity (p<0.05), and a KMO greater
than 0.81. Each point represents a patient profile, colored by disease
state (black circles, control subjects; orange diamonds, PC patients).
B, Scatter plots of the p-values (log10) for each of the 68 masses
based on t-test comparisons between clinical variables (see legend).
See Additional file 2 for PCA parameters and p-values.
Discoveries Inc.), statistical similarity clustering (based on
Pearson correlation), online databases (such as Chemspider
and SciFinder), and de novo computational molecular formula calculations. The control-normalized ratios (log2) for
PC patients and controls, detected accurate masses,
Ritchie et al. BMC Cancer 2013, 13:416
/>
Page 6 of 17
Figure 2 Hierarchically-clustered metabolite array. The same dataset used for PCA in Figure 1 was log2 normalized to the control mean and
hierarchically clustered by mass (using a Pearson correlation) and by subject (using a Manhattan correlation). Colored rows at the top of the array
indicate variable assignments for subjects (disease status, grey = control subject, orange = PC patient; gender, blue = male, pink = female; stage,
light blue = stage I, dark blue = stage IV; surgery, red = yes, green = no; chemo/radiation treatment, red = yes, green = no). The heatmap is
colored according to log2 intensity ratio; red = lower relative to control mean, green = higher relative to control mean. Metabolite clusters are
numbered one through four on the right.
predicted molecular formulas, putative identities and the
MS detection modes of selected 12C masses from each
cluster in Figure 2 are shown in Figure 3.
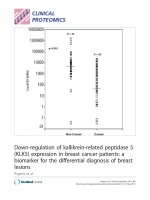
Cluster one contained a diverse group of elevated
metabolites including several predicted shorter-chain
organic molecules (containing 11 to 21 carbons), a predicted triacylgycerol, and a putative adenosine-related
metabolite. Clusters two, three and four, with lower
intensities in PC patients relative to controls, were represented by several classes of glycerophospholipids and ultra
long-chain fatty acids. Specifically, cluster two contained
several PlsEtns (PtdEtns containing a vinyl-ether linkage
at the SN1 position), while cluster three contained
multiple phosphocholine-related systems including
PtdChos, lysoPCs, and several SMs. Cluster four comprised
novel ultra long-chain hydroxylated fatty acids (LCFAs)
containing 36 carbons and five or six oxygen that we characterized in previous studies [15]. Before confirming these
identities by tandem MS, we employed Random Forest
(RF), a cross-validation classification approach, to identify
the most predictive markers in the dataset (below).
Random forest classification
We used Random Forest (RF) to build a classification
model and to identify masses with the most discriminating
potential. RF is a statistical classification method based on
an ensemble or multiple decision tree approach that
incorporates built-in cross-validation during the training
phase. The intrinsic cross-validation is performed by
constructing trees using different bootstrap sample groups
of approximately one third the original data [22].
We split the discovery dataset into two-thirds (n = 58;
22 PC and 36 control) for training and one-third (n = 32;
18 PC and 14 control) for testing. We created the training
classifier first using the 300 most significant masses
(based on p-value) between PC patients and controls.
The masses were then ranked based on percent contribution to the classifier accuracy and the mean decrease in
Gini index (Additional file 3). The top 20 masses based on
both the contribution to classifier accuracy as well as the
mean decrease in Gini index were compared and reduced
to a common 11 (Figure 4A). A second RF classifier based
on these 11 masses was then applied to the blinded test
Ritchie et al. BMC Cancer 2013, 13:416
/>
Figure 3 (See legend on next page.)
Page 7 of 17
Ritchie et al. BMC Cancer 2013, 13:416
/>
Page 8 of 17
(See figure on previous page.)
Figure 3 Putative assignments of selected 12C metabolites from HCA clusters in Figure 2. The corresponding cluster numbers from
Figure 2 and the mean log2 ratios relative to control for each metabolite are shown along the left side. Orange diamonds = PC patients, grey
circles = control subjects. The horizontal whiskers represent the 25th to 75th percentiles of the control-normalized ratios. Adjacent columns in
order from left to right indicate the detected accurate masses, the computationally predicted molecular formulas, the putative identities, and the
mass spectrometry source modes. Cluster 1 represented a diverse group of metabolites increased in PC patients relative to controls, while
clusters 2, 3 and 4 represented reductions in plasmalogen ethanolamines (PlsEtns), phosphocholine-containing metabolites (including PtdCho,
lysoPC and SMs), and ultra long-chain fatty acids, respectively. Predicted side-chain speciations in the case of glycerolipids are shown in brackets.
Bolded masses with asterisks indicate those selected by Random Forest classification.
set, which correctly classified 29 of the 32 samples
(90.6%). The predicted probability of each test set sample
as PC is shown in Figure 4B. The ROC curve based on the
probabilities resulted in an AUC of 0.98 (95% CI, 0.95-1.0,
Figure 4C). Calibration (see [23] for review) between the
predicted and actual probabilities using a logistic regression approach (see Methods) showed a maximum
difference (Emax) of 0.12 and an average difference
(Eavg) of 0.06, indicating reliability in the prediction
model (See Additional file 3). When the masses were
ranked according to their contribution to the classifier,
mass 594.4862 (Da) was the most critical according to the
Gini index (Figure 4A). The results confirmed that the
predicted metabolic systems, and in particular mass
594.4862, were highly associated with PC.
FI-MS/MS verification
We confirmed the identity of the metabolic systems
predicted above, including side-chain speciations of
glycerophospholipids, by designing flow-injection tandem
MS (FI-MS/MS) assays for each system (see Methods).
Representative CID patterns and associated extracted ion
currents (EICs) of metabolites for each of the metabolic
systems, as observed in PC patients and controls, are
shown in Additional file 5. Comprehensive lists of the
parent-daughter ion transitions for each metabolite of
each panel are shown in Additional file 1.
The results of the FI-MS/MS analysis for each metabolic
system were consistent with the FI-FTICR-MS results
(Figures 5A though E). All long-chain FAs were significantly reduced (all p<0.001), particularly 594 (C36H66O6;
p=5.6E-14, Figure 5A), as were PlsEtns (Figure 5B, all
p<0.01), lysoPCs (Figure 5C, all p<0.001 except 22:4), SMs
(Figure 5D, all p<0.001), and PtdChos (Figure 5E, all
p<0.001). To ensure that these results were not artifacts of
global phospholipid depletion or lipid breakdown, we
assayed several phosphatidylethanolamines (PtdEtns) not
identified as significant by FI-FTICR-MS analysis. PtdEtns
either showed no change between PC patients and
controls, or in some cases, were elevated (Figure 5F).
ROCs based on four metabolites, each with the lowest
p-value for each respective system (594, PtdCho 18:0/18:2,
Figure 4 Random Forest (RF) classification. An RF classifier based on two-thirds of the sample population (n=58) was first created to rank the top
300 masses differentiating controls from PC patients (all p<0.001, FDR corrected) based on their contribution to the classification accuracy and the Gini
index (See Additional file 3). The top 11 masses (A) based on these criteria were selected and a classifier created to predict the identity of the blinded
test set samples as shown in B. C, ROC curve (with AUC ±95% CI) based on the RF predicted PC probabilities for each of the 32 blinded samples.
Ritchie et al. BMC Cancer 2013, 13:416
/>
Figure 5 (See legend on next page.)
Page 9 of 17
Ritchie et al. BMC Cancer 2013, 13:416
/>
Page 10 of 17
(See figure on previous page.)
Figure 5 Relative levels of metabolites belonging to six different metabolic systems based on FI-MS/MS analysis. A, 36-carbon
long-chain FA system; B, PlsEtn system; C, lysoPC system; D, SM system; E, PtdCho system; F, PtdEtn system. Error bars represent ±1 SEM.
G, ROC curves based on the metabolites from four of the metabolic systems with the lowest p-values (shown by the horizontal brackets in
A, C, D and E). AUCs are shown with 95% CI. See Additional file 1 for parent-daughter transitions.
lysoPtdCho 18:2, and sphingomyelin d18:1/24:0), showed
AUCs between 0.93 and 0.97 (Figure 5G, 95% confidence
intervals shown).
We used the same four markers to further investigate
potential association with other clinical variables
including disease stage, treatment, surgery and gender
(Figure 6). No correlations were observed between
any of the metabolites and disease stage (Figure 6A),
treatment status (Figure 6B), or collection at surgery
(Figure 6C). LysoPC18:2 was the only metabolite that
showed a slight elevation in males versus females (p<0.05,
Figure 6D). There were no significant associations
between other metabolites of each system and these
variables (results not shown).
Independent population validation
We determined the distribution of LCFA 594.4862
(PC-594) across a random sampling of 1000 US Caucasian
reference subjects (USA control 1) between age 30 and 80
(similar to our previous approach [4]) using a FI-MS/MS
quantitative assay based on 13C-cholic acid as an internal
standard (see Methods). We did this to define a low-risk
population based on age (since age is the largest risk factor
for PC), and to investigate potential association between
PC-594 and age. We then compared the distribution of
PC-594 to a second, independent, US Caucasian population
of 14 PC patients, six patients with intraductal papillary
mucinous neoplasms (IPMNs), and 40 additional confirmed
disease-free controls (USA control 2, Figure 7). All samples
were blinded prior to analysis.
The mean PC-594 concentration among the 1000
reference subjects was 2.23 ±0.05 ug/ml cholic acid
equivalents (CAE), and negatively correlated with age
(Figure 7, regression multiple R=0.29, p<0.0001). Subjects
under age 40 showed a mean level of 2.85 ±0.14 ug/ml
CAE, which declined to 1.69 ±0.09 ug/ml CAE for
subjects aged 70–80 (Figure 7 and Table 2). The mean
concentration of the 40 USA control 2 subjects was
2.15 ±0.2 ug/ml CAE, consistent with that of the
USA control group 1 (2.23 ±0.05 ug/ml, p=0.7). However, the mean levels of the 14 PC and 6 IPMN
patients were 0.43 ±0.06 and 0.96 ±0.19 ug/ml CAE,
respectively, representing an approximate five-fold
reduction in the circulating levels of PC-594 in PC
patients compared to controls.
The ROC-AUCs based on PC-594 levels for PC patients
versus controls by age are shown in the right column of
Table 2. The AUC for PC versus reference subjects aged
30–39 was 0.99 (95% CI 0.98-1.0), with a p-value of
4.8E-9. The AUC declined to 0.90 (95% CI 0.88-0.92)
by age 70–80, but was still significant with a p-value
of 7.9E-4. For the general population aged 30–80, the
average AUC was 0.94 (95% CI 0.93-0.96). The resulting
AUC of PC-594 based on the US control 2 group was 0.97
(95% CI 0.95-0.99). The results showed that even though
the AUC declined with increasing age, the discrimination
remained high across all ages (>90%). That is, even
the oldest reference subjects (aged 70–80) showed
PC-594 levels well above those of the PC patients
(1.69 versus 0.43, respectively).
We next arbitrarily defined five PC-594 positivity rates
between 0.5 and 10% based on low-risk reference
subjects (under age 50) and determined the resulting
sensitivities and specificities by decade of life (Table 3).
For example, PC-594 cut-offs yielding positivity rates
of 2.5 and 5% in reference subjects under age 50 resulted
in sensitivities of 64% and 87%, respectively. Calibration of
predicted versus observed probabilities based upon a 5%
PC-594 positivity rate in both USA 1 controls under age
50 and USA2 controls resulted in Eavgs of 0.08 and 0.1,
and Emaxs of 0.12 and 0.14, respectively, indicating reliable
predictions (Additional file 4).
Despite the reductions in sensitivity and specificity
with age, the cut-off correlating with 2.5% positivity in
subjects under age 50 resulted in specificities of greater
than 90% across all other age groups (Table 3, specificities
of 97%, 90% and 93% for ages 50–59, 60–69 and 70–80,
respectively), whereas a cut-off resulting in 5.0% positivity
resulted in an apparent age-related effect, with specificities
of 94%, 84% and 77% for ages 50–59, 60–69 and 70–80,
respectively.
Clinical benefit
We evaluated potential clinical benefit of screening subjects based on PC-594 using decision curve analysis
(DCA) [18,19,24]. DCA is based on plotting the net benefit against a threshold probability (pt), or the probability
that a patient has the disease. The method is suitable for
determining the benefit of incorporating alternative diagnostic methods relative to current practice, independent
of test performance criteria such as ROC-AUC, sensitivity
and specificity, and study sample size. An advantage of
DCA is that it does not require knowledge of all the possible outcomes of clinical decisions typically required for
classical decision-analytic methodology [25].
Ritchie et al. BMC Cancer 2013, 13:416
/>
Page 11 of 17
Figure 6 Effects of stage, treatment, surgery and gender on the four selected metabolites of each system. A, by disease stage; B, by
treatment; C, by surgery at time of sampling; and D, by gender. Results are based on tandem-MS data normalized to control mean, ±1 SEM.
Asterisk denotes p<0.05 versus female.
We used DCA to determine whether prescreening
subjects with PC-594 would provide a net benefit for
patients over sending all subjects for EUS (or treatment
in our case), versus performing no screening of any kind
(the current paradigm for PC). Let p^ be the probability
of having PC and pt the probability of having the disease.
pt represents the probability for which a doctor or patient
considers the risk sufficient to warrant further treatment.
Generally a patient will choose treatment if p^ > pt. The
resulting decision curve, shown in Figure 8, compares the
net benefits of screening with PC-594 at various pt’s versus
treating all (everyone undergoes EUS), and treating none.
The net benefit (y-axis) can be interpreted as the additional
percent of true positives that would be detected without an
increase in the number of false positives (or in our case,
patients required to undergo EUS who don’t have cancer).
A perfect model would result in a net benefit of identifying
all patients (equal to the prevalence) regardless of the pt.
DCA based on our data (Figure 8) showed substantial
net clinical benefit with PC-594 for all pt’s above 10%.
Ritchie et al. BMC Cancer 2013, 13:416
/>
Figure 7 PC-594 levels among US Caucasians. Beeswarm jitter
plots of PC-594 concentrations (ug/ml CAE ±1 SEM) for 1000
reference subjects by age (USA control population 1), a second
control population (n=40, USA control population 2), patients with
intraductal papillary mucinous neoplasms (n=6, IPMNs), and PC
patients (n=14). Grey boxes represent the 25th to 75th percentile
and the whiskers represent the 5th to 95th percentile. Black lines
within the grey boxes represent the median.
Using 20% pt as an example (i.e. a patient feels that a
20% probability of having PC is sufficient risk to warrant
EUS), the net benefit is 0.14 greater than for performing
EUS on all subjects (0.22-0.08). This translates into the
finding of 14/100 additional cases tested without an
increase in unnecessary procedures, compared to scoping
all subjects. This represents a substantial net clinical
benefit, particularly in the case of a disease that currently
lacks any screening modalities.
Page 12 of 17
Discussion
To date, carbohydrate antigen 19.9 (CA-19.9) is the only
biomarker routinely used, and FDA approved, for the
clinical management of PC. However, its primary uses
are for prognosis [26-28] and for monitoring high-risk
populations [29]. CA-19.9 has questionable value for
average-risk screening [28,30], and due to low sensitivity
and specificity, the American Society of Clinical Oncology
(ASCO) does not recommend the use of CA19.9 for diagnostic screening purposes regardless of symptoms [31]. In
the discovery PC patient population reported herein, only
21 of the 40 patients had CA19.9 levels greater than
35 U/ml (52.5% sensitivity; results not shown), consistent
with the abovementioned reports. Accordingly, there are
currently no viable means to screen for increased risk of,
or early-stage PC.
The non-targeted metabolomics discovery platform used
in this study has previously identified early-stage biomarkers mechanistically involved in Alzheimer’s disease
[16], autism [32], and colorectal cancer [15]. The key advantages of this platform are that: 1) Samples are processed
using a liquid-liquid extraction followed by direct infusion
of each extract without chromatography where all molecules are introduced into the system and can therefore
potentially be detected. 2) The ultra-high resolution of the
FTICR-MS enables mass measurements with accuracy sufficient for the computational determination of elemental
composition, and rapid insight into the identities of peaks.
3) Translation of FI-FTICR-MS discoveries into sensitive
and cost-effective targeted and quantitative FI-MS/MS
assays is seamless due to the high compatibility of the two
systems. The high correlation between the non-targeted
FI-FTICR-MS and targeted FI-MS/MS results shown
in this study validates high-resolution non-targeted
metabolomics as a highly sensitive and accurate tool
for de novo biomarker discovery applications.
Overall, the difference in magnitude between the PC
patient and control subject serum metabolomes we
Table 2 PC-594 statistical performance in USA Caucasian populations
Mean PC-594 (ug/ml CAE) ±1SEM
p versus PC
ROC-AUC versus PC (95% CI)
30-39 yrs
2.85 ±0.14
4.8E-09
0.99 (0.98-1.0)
40-49 yrs
2.58 ±0.09
5.7E-07
0.97 (0.96-0.98)
50-59 yrs
2.44 ±0.12
1.8E-05
0.97 (0.96-0.98)
60-69 yrs
1.77 ±0.10
1.9E-05
0.91 (0.89-0.93)
70-80 yrs
1.69 ±0.09
7.9E-04
0.90 (0.88-0.92)
Cohort
USA control 1
2.23 ±0.05
6.2E-05
0.94 (0.93-0.96)
USA control 2
All yrs
2.15 ±0.20
5.9E-06
0.97 (0.95-0.99)
USA IMPN
0.95 ±0.19
0.003
-
USA PC
0.43 ±0.06
-
-
Ritchie et al. BMC Cancer 2013, 13:416
/>
Page 13 of 17
Table 3 Sensitivities and specificities based on fixed PC-594 positivity rates in low-risk subjects
% Positivity < age 50
(specificity, 95% CI)
USA PC % Sensitivity
(95% CI)
% Specificity* (95% CI)
USA Control 1 by age
50-59
60-69
70-80
USA control 2
0.5 (99.5, 98–100)
7 (0.4-36)
100 (97–100)
99 (96–100)
100 (97–100)
100 (89–100)
1.0 (99.0, 97–100)
21 (6–52)
99 (95–100)
95 (91–98)
97 (93–99)
100 (89–100)
2.5 (97.5, 95–99)
64 (36–86)
97 (93–99)
90 (85–94)
93 (88–96)
95 (82–99)
5.0 (95.0, 92–97)
87 (56–98)
94 (90–97)
84 (78–88)
77 (70–82)
95 (82–99)
10.0 (90.0, 87–93)
100 (73–100)
90 (85–94)
74 (68–80)
67 (60–73)
83 (67–92)
*assuming no PC among reference subjects.
observed in this study was remarkable. In fact, PCA
performed on the entire dataset of 2478 masses, with no
prior filtering, clearly discriminated PC patients from controls (not shown). This was due to multiple affected metabolic systems each containing numerous similarly-behaving
components. By clustering the FI-FTICR-MS data by
Pearson correlation, it was possible to quickly identify
these systems. However, the limitation of FI-FTICR-MS,
particularly for intact glycerolipids, is that the fatty acid
side-chain speciations can only be speculated due to isomerism. For example, differentiating 16:0/18:3 at SN1/SN2
from 16:1/18:2 is not possible. FI-MS/MS therefore represents an ideal complimentary approach because it not only
allows for the confirmation of side-chain speciations, but
also the investigation of related metabolites that may
not have been detected with FI-FTICR-MS due to low
abundance, etc.
Using this two-pronged approach, we discovered
and confirmed the involvement of three major
dysregulated metabolic systems in the serum of PC
patients: ultra long-chain fatty acids, numerous cholinecontaining glycerophospholipids, and vinyl ether-containing
Figure 8 Decision curve analysis (DCA) for prediction of PC
based on PC-594. The plot compares the net clinical benefits of
four scenarios: a perfect prediction model (grey dashed line), screen
none (solid horizontal black line), screen everyone with EUS
(grey line), and screen based on the PC-594 model. Data for the plot
was based on the USA2 validation cohort (PC prevalence of 26%).
See Results for further explanation.
ethanolamine phospholipids called plasmalogens. Although
most of the individual metabolites alone showed a
significant reduction in PC patient serum, the strongest discriminator based on multiple statistical criteria
was PC-594 (p=9.9E-14).
The ROC-AUCs based on PC-594 were highly consistent,
independent of the platform used or population evaluated
in this study (0.98 based on FI-FTICR-MS analysis of the
discovery samples, 0.96 based on FI-MS/MS confirmation
of the discovery samples, and 0.97 based on the blinded
analysis of the US Caucasian patient cohort). On average,
the mean PC-594 concentration in PC patients was more
than five times lower than control subjects. PC-594 reduction was not observed to correlate with either the magnitude of disease burden (as assessed by stage) or treatment.
Interestingly, PC-594 levels were also reduced in IPMN
patients. Although IPMN is technically a cystic tumor, it is
still a cancer with an invasive component in a high percentage of cases [33]. These results suggest the possibility that
the tumor is not responsible for the reduction, but rather
that the reduction precedes the onset of disease, similar to
GTA-446 reduction and CRC [4,34].
Because the RF predictor based on 11 masses (Figure 4A),
showed little improvement in diagnostic accuracy over
PC-594 alone (the ROC-AUC based solely on PC-594
was 0.96 versus 0.98 for the RF model), we proceeded
with further validation of PC-594 only. A single-analyte
assay has several advantages including simpler method development, quantitation, and an easier regulatory approval
path. However, our results also showed a strong association
between phosphocholine reduction and PC, and therefore
evaluating subjects for choline-related deficiency as an
independent risk factor should not be disregarded.
Before commenting on the biological implications of
the findings, two key limitations of the study should be
addressed. First, the current study did not include subjects with non-malignant pancreatic-related conditions
such as pancreatitis or jaundice. Since a high percentage
of PC patients exhibit jaundice, and up to 5% of subjects
with pancreatitis develop PC in a 20-year period [35], we
cannot exclude the possibility that these conditions are
also linked to the metabolic effects observed. Although
Ritchie et al. BMC Cancer 2013, 13:416
/>
subjects with these conditions would not necessarily be
representative of a low-risk target screening population,
it will be important to determine whether these conditions
affect the biomarkers reported herein, particularly in light
of recent reports that jaundice can impact performance of
certain PC protein markers [36].
Second, the sample sizes of the studies were not large.
In particular, the clinical diversity of the discovery population was high, including samples from patients collected
at time of surgery, following treatment, as well as a low
number of cases by disease stage. Although we observed
no bias toward any of these variables, (Figures 1B and 6),
interpretation (especially for the lack of disease stage effect)
should be taken with caution.
The biological implications of reduced systemic
levels of long-chain FAs and numerous classes of
glycerophospholipids in PC patients are intriguing
and warrant further discussion. The long-chain FAs,
although only recently reported, represent a large
family of 28 to 36 carbon polyhydroxylated and polyunsaturated long-chain fatty acids, originally named
gastric-tract acids (GTAs) for their role in CRC [15].
The prototypical member of the family, GTA-446, has
28 carbons and is reduced in colorectal cancer patients
relative to control subjects [4,15,34].
In previous studies, we showed that human serum
extracts enriched for selected GTAs protected against
inflammation through the down-regulation of NFκB
and several pro-inflammatory markers in both human
colon cancer and RAW264.3 mouse macrophage cells
exposed to lipopolysaccharide [37]. GTA-treated cells
also showed reduced proliferative capacity through a
pro-apoptotic mechanism [37].
In colon cancer, the current hypothesis is that GTAs
act analogously to the resolvins and protectins [38],
protecting the body against the accumulation of chronic
inflammation over time. Compromised levels with age
are suspected to favor the establishment of a proinflammatory environment, and ultimately lead to the
DNA damage observed in many tumors. PC-594 belongs
to the same metabolic system as GTA-446; therefore, it is
probable that PC-594, at least to some extent, is also
involved in inflammatory processes. Given that PC incidence is low in subjects under age 45 (<3% of cases)
and increases with age thereafter (SEER data, 2005–2009),
it is tempting to speculate whether the age-related
reduction of PC-594 could be causally involved in the
establishment of PC.
Given the role of GTAs in inflammation, our current
work is focused on determining whether subjects with
chronic pancreatitis, an inflammatory condition, have
altered levels of PC-594 and other ultra long-chain FAs.
Likewise, further investigation of GTA family members
across different cancers and inflammatory conditions is
Page 14 of 17
warranted for dissecting the specific roles that different
isoforms play in the causation of these diseases.
Phosphocholine metabolism has also been previously
implicated with PC. For example, results by Yao et al.
showed decreased choline levels in PC tumors via
proton MR [39], and others have shown that human
cancer cell growth, including PC cells, can be inhibited by
various sphingolipids [40,41]. Fang et al. showed by NMR
that rats with PC exhibited lower phosphocholine and
glycerophosphocholine compared to rats with chronic
pancreatitis [42]. One of the most convincing in vivo studies to date functionally implicating choline metabolism to
PC was by Longnecker et al., who showed that rats fed a
choline-supplemented diet exhibited significantly reduced
PC lesion areas, lesion diameters and numbers of lesions
compared to rats fed a choline-devoid diet. This lead the
authors to conclude that a choline-deficient diet might
have a growth promoting activity [43].
Choline is also important for pancreatic cell function,
as pancreatic acinar cell integrity and the generation of
digestive enzymes and insulin secretion are dependent
upon high choline phospholipid metabolism [44]. There
is also evidence that reduced sphingomyelin levels
may be oncogenic as demonstrated by inhibition of
the RAS-MAPK, CyclinD-CDK4/CDK6 and PI3K-AKT
axes through the activation of sphingomyelin synthase by a
synthetic fatty acid [45]. Our finding of reduced circulating
levels of choline-based metabolites as possible contributing
factors to the development of PC is consistent with these
observations.
Our observation of reduced PlsEtns (containing the
signature vinyl-ether bond at the SN1 position), but not
their diacy counterparts, is also intriguing for several
reasons. PlsEtns are membrane phospholipids, primarily
located in cells of the nervous system and heart [46,47],
but which are produced exclusively by peroxisomes in
the liver [48]. The vinyl-ether bond at the SN1 position
is required for the lipid’s anti-oxidant role and its effect
on membrane fluidity, which is relevant to neuronal impairment because it affects vesicular fusion (for review see
[49,50]). We previously reported that reduced systemic
levels of PlsEtns in Alzheimer’s disease patients correlate
with levels in the brain and cognitive parameters [16].
PlsEtns, however, have also been implicated in cancer
[51,52], and plasmalogen analogues have been shown to
exhibit anti-tumor properties [53]. The consequence of
decreased PlsEtn levels, via effects on membrane structure
and microdomain architecture, could impact growth factor
receptor-mediated signaling.
The findings of this study represent an opportunity for
identifying subjects with PC or a high-risk of developing
PC. Consider, for example, current CRC screening
guidelines, which suggest that the benefit of identifying
early-stage CRC (i.e. the increase in 5-year survival) via
Ritchie et al. BMC Cancer 2013, 13:416
/>
endoscopic examination in an asymptomatic population
with an incidence rate of 0.05% [54] outweighs the combined risks of complications from endoscopy and late-stage
detection mortality. Given the current PC incidence rate of
approximately 9.5/100,000 (0.0095%), a blood test with 95%
specificity and sensitivity approaching 90% would yield a
PC detection rate of approximately 8.6 per 5000 positive
tests, or 0.17%. This represents an 18-fold increase in PC
risk over average-risk subjects given a positive PC-594 test,
and a 3-fold higher incidence rate than the current incidence considered sufficient for colonoscopy-based screening of CRC in the general population. Considering the high
mortality rate of late-stage detection, the benefits of endoscopic screening in a small population of high-risk subjects
with low PC-594 levels becomes obvious.
Improved clinical benefit was further supported by the
results of decision curve analysis, which showed significant
net clinical benefit above all pt’s greater than 10% compared
to screening all subjects with EUS, which was not surprising given the high discriminating ability of PC-594. The results of our studies clearly implicate a circulating reduction
of PC-594 in PC, and establish the foundation for designing
future prospective trials to determine the net clinical benefit
of PC-594 screening in the true average-risk population.
Conclusions
Using a sensitive, high-resolution mass spectrometrybased platform, we showed that the serum metabolome
of PC patients is significantly altered. We confirmed the
findings using independent populations and triplequadrupole tandem mass spectrometry assays designed
for specific metabolic systems. Specifically, PC patients
showed severely compromised levels of several classes of
serum phospholipids and novel ultra long-chain fatty
acids. In particular, fatty acid PC-594 showed an AUC of
greater than .95 for discriminating PC patients from
controls in two geographically and ethnically diverse
populations. The findings are relevant in the context of
screening because the enrichment of PC in PC-594 deficient populations suggests that reducing PC mortality rates
via screening and early-detection is plausible. The design
and implementation of a suitable clinical trial to test this
hypothesis is now underway.
Additional files
Additional file 1: Transition lists for tandem-MS methods. The file lists
the parent-daughter ion transitions for the ultra long-chain fatty acid system
(Table S1), the plasmenylethanolamine (plasmalogen) system (Table S2),
the lysophosphatidylcholine system (Table S3), the sphingomyelin system
(Table S4), the phosphatidylcholine system (Table S5) and the
phosphatidylethanolamine system (Table S6).
Additional file 2: PCA parameters. The file lists the proportional and
cumulative variance by factor and the chi2 results (“PCA variance” tab),
the square factor loadings (Q2) for each mass across each factor the and
Page 15 of 17
square multiple correlation (R2) for each mass (“PCA Q2R2” tab), the
loadings for each mass across each factor and the uniqueness for each
mass (“loadings uniqueness” tab), and the p-value of each mass based on
pairwise comparisons between PC and controls, females and males,
stages of disease (within PC), treatment status (within PC) and surgery
(within PC) (“p-value for bias” tab).
Additional file 3: Random Forest output parameters. A). The RF
classification accuracy plot, and B). the Gini index for masses used in the
training phase. C), Calibration plot based on the predicted probabilities of
the test-set data.
Additional file 4: Calibration plots. Calibration of the model to predict
PC based on PC-594. The x-axis represents the predicted probability of
PC and the y-axis represents the actual probability of PC. A) calibration
plot for PC versus USA2 controls, B) calibration plot for PC versus USA1
controls < age 50. The average differences (Eavg) and maximum
differences (Emax) between the predicted model and a perfect model
(the straight diagonal), are shown on each plot.
Additional file 5: Representative tandem-MS spectra and selected ion
currents of selected metabolites. The CID-induced fragmentation pattern
of a representative member from each of the four metabolic systems is
shown along the left. Arrows indicate the daughter ions used for
quantitation. The selected ion currents for each of the daughter ions are
shown for five randomly-selected normal and five pancreatic patient samples
(right side). See Methods and Additional file 1 for more information.
Abbreviations
APCI: Atmospheric pressure chemical ionization; AUC: Area under the curve;
BuOH: Butanol; CA-19.9: Carbohydrate antigen 19.9; CAE: Cholic acid
equivalent; CID: Collision induced dissociation; DCA: Decision curve analysis;
ESI: Electrospray ionization; EtOAc: Ethyl acetate; FA: Fatty acid; FDR: False
discovery rate; FI-FTICR-MS: Flow-injection fourier transform ion cyclotron
resonance mass spectrometry; FI-MS/MS: Flow injection tandem mass
spectrometry; GTA: Gastric-tract acid; IPMN: Intraductal papillary mucinous
neoplasms; lysoPC: Lysophosphatidylcholine; MRM: Multiple reaction
monitoring; PC: Pancreatic cancer; PCA: Principal component analysis;
PlsEtn: Plasmalogen ethanolamine; PtdCho: Phosphatidylcholine;
PtdEtn: Phosphatidylethanolamine; RF: Random forest; ROC:
Receiver-operator characteristic; SM: Sphingomyelin.
Competing interests
Shawn Ritchie, Wei Jin, Elodie Pastural, Tolulope Sajobe, Dushmanthi
Jayasinghe, Bassirou Chitou and Yasuyo Yamazaki were paid employees of
Phenomenome Discoveries, Inc. Dayan Goodenowe is a director of
Phenomenome Discoveries, Inc. The other authors of have no competing
interests. Phenomenome Discoveries, Inc. financed the publication costs of
this paper. Part of the results discussed in this paper have been provisionally
filed for patent (U.S. application number 13/499,369).
Authors’ contributions
SAR, HA, IT, YY and DBG designed the metabolomic studies. SAR and DBG
were the primary authors. IT, HE, HN, MM, YD and MM were responsible for
the Japanese trial design, patient enrollment, clinical data management and
interpretation of findings. SAR and EP performed multivariate statistics and
analysis of FI-FTICR-MS and FI-TQ-MS/MS data. BC and TTS performed the
Random Forest, jitter plots, ROC and clinical performance statistical analyses.
TTS performed the calibration and decision curve analysis. DJ and WJ
developed the FI-TQ-MS/MS assays. TW was responsible for the USA
Caucasian study design and blinded analysis. All authors had input, read, and
agree with the contents of the manuscript. All authors read and approved
the final manuscript.
Acknowledgements
The primary funding for the sample analysis portion of the study, and
publication costs, was provided by Phenomenome Discoveries, Inc. The
collection of the USA PC and control 2 samples was funded by Glycozym
Inc, while the USA 1 reference population recruitment was funded by
Polymedco Inc. The collection of the Japanese samples was funded by Osaka
University.
Ritchie et al. BMC Cancer 2013, 13:416
/>
Author details
1
Phenomenome Discoveries, Inc., Saskatoon, SK, Canada. 2Department of
Surgery, Osaka University Graduate School of Medicine, Osaka, Japan.
3
Current address: Pan-Provincial Vaccine Enterprise Inc. (PREVENT), Saskatoon,
SK, Canada. 4Current address: Department of Community Health Sciences,
Hotchkiss Brain Institute Clinical Research Unit & Institute for Public Health,
University of Calgary, Calgary, AB, Canada. 5Glycozym, Inc., Beverly, MA, USA.
Received: 30 August 2013 Accepted: 2 September 2013
Published: 12 September 2013
References
1. Klapman J, Malafa MP: Early detection of pancreatic cancer: why, who,
and how to screen. Cancer Control 2008, 15(4):280–287.
2. Helmstaedter L, Riemann JF: Pancreatic cancer–EUS and early diagnosis.
Langenbeck’s archives of surgery / Deutsche Gesellschaft für Chirurgie 2008,
393(6):923–927.
3. Jemal A, Siegel R, Ward E, Hao Y, Xu J, Thun MJ: Cancer statistics, 2009. CA
Cancer J Clin 2009, 59(4):225–249.
4. Ritchie SA, Tonita J, Alvi R, Lehotay D, Elshoni H, Myat S, McHattie J,
Goodenowe DB: Low-serum GTA-446 anti-inflammatory fatty acid levels
as a new risk factor for colon cancer. Int J Cancer 2013, 132:355–362.
5. Hoffe S, Balducci L: Cancer and age: general considerations. Clin Geriatr
Med 2012, 28(1):1–18.
6. Parkin DM: 1. The fraction of cancer attributable to lifestyle and
environmental factors in the UK in 2010. Br J Cancer 2011,
105(Suppl 2):1–4.
7. Irigaray P, Newby JA, Clapp R, Hardell L, Howard V, Montagnier L, Epstein S,
Belpomme D: Lifestyle-related factors and environmental agents causing
cancer: an overview. Biomed Pharmacother 2007, 61(10):640–658.
8. Willett WC: Diet and cancer: one view at the start of the millennium.
Cancer epidemiology, biomarkers & prevention : a publication of the American
Association for Cancer Research, cosponsored by the American Society of
Preventive Oncology 2001, 10(1):3–8.
9. Prasad S, Sung B, Aggarwal BB: Age-associated chronic diseases require
age-old medicine: role of chronic inflammation. Prev Med 2012,
54:S29–S37.
10. Dítě P, Hermanová M, Trna J, Novotný I, Růžička M, Liberda M, Bártková A:
The role of chronic inflammation: chronic pancreatitis as a risk factor of
pancreatic cancer. Digestive diseases (Basel, Switzerland) 2012,
30(3):277–283.
11. Aharoni A, Vos CR, Verhoeven H, Maliepaard C, Kruppa G, Bino RJ,
Goodenowe D: Nontargeted metabolome analysis by use of Fourier
Transform Ion Cyclotron Mass Spectrometry. Omics 2002, 6(3):217–234.
12. Dettmer K, Aronov P, Hammock B: Mass spectrometry-based
metabolomics. Mass Spectrom Rev 2007, 26(1):51–78.
13. Spratlin J, Serkova N, Eckhardt S: Clinical applications of metabolomics in
oncology: a review. Clin Cancer Res 2009, 15(2):431–440.
14. Malhotra RK, Indrayan A: A simple nomogram for sample size for
estimating sensitivity and specificity of medical tests. Indian J
ophthalmology 2010, 58(6):519–522.
15. Ritchie S, Ahiahonu P, Jayasinghe D, Heath D, Liu J, Lu Y, Jin W, Kavianpour
A, Yamazaki Y, Khan A, et al: Reduced levels of hydroxylated,
polyunsaturated ultra long-chain fatty acids in the serum of colorectal
cancer patients: implications for early screening and detection.
BMC medicine 2010, 8:13.
16. Goodenowe D, Cook L, Liu J, Lu Y, Jayasinghe D, Ahiahonu P, Heath D,
Yamazaki Y, Flax J, Krenitsky K, et al: Peripheral ethanolamine plasmalogen
deficiency: a logical causative factor in Alzheimer’s disease and
dementia. J Lipid Res 2007, 48(11):2485–2498.
17. Benjamini Y, Drai D, Elmer G, Kafkafi N, Golani I: Controlling the false
discovery rate in behavior genetics research. Behav Brain Res 2001,
125(1–2):279–284.
18. Vickers AJ, Cronin AM, Elkin EB, Gonen M: Extensions to decision curve
analysis, a novel method for evaluating diagnostic tests, prediction
models and molecular markers. BMCMed Informatics Decis making 2008,
8:53.
19. Vickers AJ, Elkin EB: Decision curve analysis: a novel method for
evaluating prediction models. Med Decis Making 2006, 26(6):565–574.
20. Cureton EE, D’Agostino RB: Factor analysis: An applied approach. Hillsdale,
NJ: Erlbaum; 1983.
Page 16 of 17
21. Kim J-O, Mueller CW: Factor analysis, statistical methods and practical issues.
(Quantitative applications in the social sciences.). Beverly Hills: Sage; 1978.
22. Breiman L: Random forests. Mach Learn 2001, 45:5–32.
23. Vergouwe Y, Steyerberg EW, Eijkemans MJ, Habbema JD: Validity of
prognostic models: when is a model clinically useful? Semin Urol Oncol
2002, 20(2):96–107.
24. Rousson V, Zumbrunn T: Decision curve analysis revisited: overall net benefit,
relationships to ROC curve analysis, and application to case–control studies.
BMC Med Informatics and Decis Making 2011, 11:45.
25. Djulbegovic B, Desoky AH: Equation and nomogram for calculation of
testing and treatment thresholds. Med Decis Making 1996, 16(2):198–199.
26. Hata S, Sakamoto Y, Yamamoto Y, Nara S, Esaki M, Shimada K, Kosuge T:
Prognostic impact of postoperative serum CA 19–9 levels in patients
with resectable pancreatic cancer. Annals of surgical oncology 2012,
19(2):636–641.
27. Humphris JL, Chang DK, Johns AL, Scarlett CJ, Pajic M, Jones MD, Colvin EK,
Nagrial A, Chin VT, Chantrill LA, et al: The prognostic and predictive value
of serum CA19.9 in pancreatic cancer. Ann Oncol 2012, 23(7):1713–1722.
28. Kim JE, Lee KT, Lee JK, Paik SW, Rhee JC, Choi KW: Clinical usefulness of
carbohydrate antigen 19–9 as a screening test for pancreatic cancer in
an asymptomatic population. J Gastroenterol Hepatol 2004, 19(2):182–186.
29. Zubarik R, Gordon SR, Lidofsky SD, Anderson SR, Pipas JM, Badger G,
Ganguly E, Vecchio J: Screening for pancreatic cancer in a high-risk
population with serum CA 19–9 and targeted EUS: a feasibility study.
Gastrointestinal endoscopy 2011, 74(1):87–95.
30. Singh S, Tang S, Sreenarasimhaiah J, Lara LF, Siddiqui A: The clinical utility
and limitations of serum carbohydrate antigen (CA19-9) as a diagnostic
tool for pancreatic cancer and cholangiocarcinoma. Dig Dis Sci 2011,
56(8):2491–2496.
31. Locker G, Hamilton S, Harris J, Jessup J, Kemeny N, Macdonald J, Somerfield M,
Hayes D, Bast R: ASCO 2006 update of recommendations for the use of
tumor markers in gastrointestinal cancer. J Clin Oncol 2006, 24(33):5313–5327.
32. Pastural E, Ritchie S, Lu Y, Jin W, Kavianpour A, Khine Su-Myat K, Heath D,
Wood PL, Fisk M, Goodenowe DB: Novel plasma phospholipid biomarkers
of autism: mitochondrial dysfunction as a putative causative mechanism.
Prostaglandins Leukot Essent Fatty Acids 2009, 81(4):253–264.
33. Sohn TA, Yeo CJ, Cameron JL, Iacobuzio-Donahue CA, Hruban RH, Lillemoe
KD: Intraductal papillary mucinous neoplasms of the pancreas: an
increasingly recognized clinicopathologic entity. Ann Surg 2001,
234(3):313–321. discussion 321–312.
34. Ritchie S, Heath D, Yamazaki Y, Grimmalt B, Kavianpour A, Krenitsky K,
Elshoni H, Takemasa I, Miyake M, Sekimoto M, et al: Reduction of novel
circulating long-chain fatty acids in colorectal cancer patients is
independent of tumor burden and correlates with age.
BMC gastroenterology 2010, 10:140.
35. Raimondi S, Lowenfels AB, Morselli-Labate AM, Maisonneuve P, Pezzilli R:
Pancreatic cancer in chronic pancreatitis; aetiology, incidence, and early
detection. Best Pract Res Clin Gastroenterol 2010, 24(3):349–358.
36. Tonack S, Jenkinson C, Cox T, Elliott V, Jenkins RE, Kitteringham NR,
Greenhalf W, Shaw V, Michalski CW, Friess H, et al: iTRAQ reveals candidate
pancreatic cancer serum biomarkers: influence of obstructive jaundice
on their performance. Br J Cancer 2013, 108(9):1846–1853.
37. Ritchie SA, Jayasinghe D, Davies GF, Ahiahonu P, Ma H, Goodenowe DB: Human
serum-derived hydroxy long-chain fatty acids exhibit anti-inflammatory and
anti-proliferative activity. J Exp Clin Cancer Res 2011, 30(1):59.
38. Serhan C: Novel eicosanoid and docosanoid mediators: resolvins,
docosatrienes, and neuroprotectins. Curr Opin Clin Nutr Metab Care 2005,
8(2):115–121.
39. Yao X, Zeng M, Wang H, Fei S, Rao S, Ji Y: Metabolite detection of
pancreatic carcinoma by in vivo proton MR spectroscopy at 3T: initial
results. La Radiologia medica 2012, 117(5):78–788.
40. Yamada T, Okajima F, Ohwada S, Kondo Y: Growth inhibition of human
pancreatic cancer cells by sphingosylphosphorylcholine and influence of
culture conditions. Cell Mol Life Sci 1997, 53(5):435–441.
41. Afrasiabi E, Blom T, Balthasar S, Tornquist K: Antiproliferative effect of
sphingosylphosphorylcholine in thyroid FRO cancer cells mediated by cell
cycle arrest in the G2/M phase. Mol Cell Endocrinol 2007, 274(1–2):43–52.
42. Fang F, He X, Deng H, Chen Q, Lu J, Spraul M, Yu Y: Discrimination of
metabolic profiles of pancreatic cancer from chronic pancreatitis by
high-resolution magic angle spinning 1H nuclear magnetic resonance
and principal components analysis. Cancer Sci 2007, 98(11):1678–1682.
Ritchie et al. BMC Cancer 2013, 13:416
/>
Page 17 of 17
43. Longnecker DS, Chandar N, Sheahan DG, Janosky JE, Lombardi B: Preneoplastic
and neoplastic lesions in the pancreas of rats fed choline-devoid or
choline-supplemented diets. Toxicol Pathol 1991, 19(1):59–65.
44. Ilcol YO, Gurun MS, Taga Y, Ulus IH: Choline increases serum insulin in rat
when injected intraperitoneally and augments basal and stimulated
aceylcholine release from the rat minced pancreas in vitro. Eur J Biochem
2003, 270(5):991–999.
45. Terés S, Lladó V, Higuera M, Barceló-Coblijn G, Martin ML, Noguera-Salvà
MA, Marcilla-Etxenike A, García-Verdugo JM, Soriano-Navarro M, Saus C, et
al: Normalization of sphingomyelin levels by 2-hydroxyoleic acid induces
autophagic cell death of SF767 cancer cells. Autophagy 2012,
8(10):1542–1544.
46. Skaff O, Pattison D, Davies M: The vinyl ether linkages of plasmalogens
are favored targets for myeloperoxidase-derived oxidants: a kinetic
study. Biochemistry 2008, 47(31):8237–8245.
47. Labadaridis I, Moraitou M, Theodoraki M, Triantafyllidis G, Sarafidou J,
Michelakakis H: Plasmalogen levels in full-term neonates. Acta Paediatr
2009, 98(4):640–642.
48. Singh H, Beckman K, Poulos A: Exclusive localization in peroxisomes of
dihydroxyacetone phosphate acyltransferase and alkyl-dihydroxyacetone
phosphate synthase in rat liver. J Lipid Res 1993, 34(3):467–477.
49. Brites P, Waterham H, Wanders R: Functions and biosynthesis of
plasmalogens in health and disease. Biochim Biophys Acta 2004,
1636(2–3):219–231.
50. Nagan N, Zoeller R: Plasmalogens: biosynthesis and functions. Prog Lipid
Res 2001, 40(3):199–229.
51. Merchant T, Center NY, Oncology D, Minsky B, Lauwers G, Pathology D,
Diamantis P, Haida T, Glonek T, Laboratory MR: Esophageal cancer
phospholipids correlated with histopathologic findings: a 31P NMR
study. NMR Biomed 1999, 12(4):1–5.
52. Smith R, Lespi P, Luca M, Bustos C, Marra F, Alaniz M, Marra C: A reliable
biomarker derived from plasmalogens to evaluate malignancy and
metastatic capacity of human cancers. Lipids 2008, 43(1):79–89.
53. Bittman R, Qin D, Wong D, Tigyi G, Samadder P, Arthur G: Synthesis and
antitumor properties of a plasmalogen methyl ether analogue.
Tetrahedron 2001, 57(20):4277–4282.
54. Canadian Cancer Statistics 2011. Published by the Canadian Cancer Society.
/>doi:10.1186/1471-2407-13-416
Cite this article as: Ritchie et al.: Metabolic system alterations in
pancreatic cancer patient serum: potential for early detection. BMC
Cancer 2013 13:416.
Submit your next manuscript to BioMed Central
and take full advantage of:
• Convenient online submission
• Thorough peer review
• No space constraints or color figure charges
• Immediate publication on acceptance
• Inclusion in PubMed, CAS, Scopus and Google Scholar
• Research which is freely available for redistribution
Submit your manuscript at
www.biomedcentral.com/submit