Integral analysis of p53 and its value as prognostic factor in sporadic colon cancer
Bạn đang xem bản rút gọn của tài liệu. Xem và tải ngay bản đầy đủ của tài liệu tại đây (1015.05 KB, 11 trang )
Fariña Sarasqueta et al. BMC Cancer 2013, 13:277
/>
RESEARCH ARTICLE
Open Access
Integral analysis of p53 and its value as
prognostic factor in sporadic colon cancer
Arantza Fariña Sarasqueta1, Giusi Irma Forte1, Wim E Corver1, Noel F de Miranda1, Dina Ruano1, Ronald van Eijk1,
Jan Oosting1, Rob AEM Tollenaar2, Tom van Wezel1 and Hans Morreau1*
Abstract
Background: p53 (encoded by TP53) is involved in DNA damage repair, cell cycle regulation, apoptosis, aging and
cellular senescence. TP53 is mutated in around 50% of human cancers. Nevertheless, the consequences of p53
inactivation in colon cancer outcome remain unclear. Recently, a new role of p53 together with CSNK1A1 in colon
cancer invasiveness has been described in mice.
Methods: By combining data on different levels of p53 inactivation, we aimed to predict p53 functionality and to
determine its effects on colon cancer outcome. Moreover, survival effects of CSNK1A1 together with p53 were also
studied.
Eighty-three formalin fixed paraffin embedded colon tumors were enriched for tumor cells using flow sorting, the
extracted DNA was used in a custom SNP array to determine chr17p13-11 allelic state; p53 immunostaining, TP53
exons 5, 6, 7 and 8 mutations were determined in combination with mRNA expression analysis on frozen tissue.
Results: Patients with a predicted functional p53 had a better prognosis than patients with non functional p53
(Log Rank p=0.009). Expression of CSNK1A1 modified p53 survival effects. Patients with low CSNK1A1 expression and
non-functional p53 had a very poor survival both in the univariate (Log Rank p<0.001) and in the multivariate
survival analysis (HR=4.74 95% CI 1.45 – 15.3 p=0.009).
Conclusion: The combination of mutational, genomic, protein and downstream transcriptional activity data
predicted p53 functionality which is shown to have a prognostic effect on colon cancer patients. This effect was
specifically modified by CSKN1A1 expression.
Keywords: Colon cancer, p53, Prognosis, Survival, CSKN1A1
Background
During colon carcinogenesis cells accumulate several genetic and genomic aberrations that lead to uncontrolled
proliferation and tumor formation [1]. A major event in
the adenoma to carcinoma transition is TP53 inactivation.
p53 plays a crucial role in maintaining genome stability
and integrity. Upon DNA damage, the activation of p53
leads to cell cycle arrest enabling the cells to repair the
damaged DNA. On the other hand, when the damage is
too extensive to be repaired p53 activation can also drive
the cell towards apoptosis or senescence [2]. Recently, p53
has also been implicated in tumor invasiveness [3]. In
* Correspondence:
1
Department of Pathology, Leiden University Medical Centre, P.O. Box 9600
L1-Q2300 RC, Leiden, the Netherlands
Full list of author information is available at the end of the article
mice, the inactivation of casein kinase 1 alpha (Csnk1a1)
promotes the cytoplasmatic/nuclear accumulation of β
catenin which stimulates the transcription of Wnt signaling target genes. The combined inactivation of p53 and
Csnk1a1 rapidly leads to tumor invasiveness in the colon
of these mice.
Inactivation of TP53 is one of the most frequent
events in human cancer [4]. Among others, TP53 can
be inactivated by “loss of function” mutations in one
allele and deletion of the remaining wild type allele or
by dominant negative mutations that are able to inactivate also the wild type protein transcribed by the
second unaffected allele. Either way, when p53 function is jeopardized, genomic instability and uncontrolled cell proliferation are facilitated.
© 2013 Fariña Sarasqueta et al.; licensee BioMed Central Ltd. This is an Open Access article distributed under the terms of the
Creative Commons Attribution License ( which permits unrestricted use,
distribution, and reproduction in any medium, provided the original work is properly cited.
Fariña Sarasqueta et al. BMC Cancer 2013, 13:277
/>
The role of p53 inactivation in colon cancer progression and prognosis has been widely studied but remains
elusive notwithstanding the amount of reports addressing this subject [5-17]. Chromosomal instability (CIN)
is a known prognostic factor in colon cancer [18]. Although p53 inactivation has been frequently associated
with CIN, not all tumors with CIN carry an inactive
p53 and vice versa [19]. More complexity is added by
the recent demonstration that TP53 can behave as a
haploinsufficient tumor suppressor gene. Using mouse
models, Ventakachalam and coworkers demonstrated
that mice carrying one functional p53 allele developed
tumors but they showed however a milder phenotype
than mice that lost both alleles [20]. Moreover, several
reports described the TP53 gene dosage effect on expression of target genes [21,22].
Recent developments in genomic copy number analysis have shown to more accurately study the measure
of chromosomal structural and numeric aberrations
[23]. The development of the lesser allele intensity ratio
(LAIR) algorithm that integrates the DNA index in the
analysis of copy number data gives a real measure of the
chromosomal alterations and allows the study of gene
dosage effects in tumors.
Given the complexity of the p53 network, the several ways of p53 inactivation, and the recently described role of p53 in cancer invasiveness in mice, we
studied in detail different levels of p53 inactivation in
human colon cancer taking into account the allelic
state of the locus on the short arm of chromosome
17, gene mutation state, protein expression levels,
downstream target gene expression and determine the
prognostic impact in colon cancer patients. Moreover,
interactions with the recently described CSNK1A1 expression and the impact on disease outcome were
also explored.
Patients and methods
Patients
Inclusion criteria for this study were sporadic colorectal
cancers in stage I, II and III. Stage IV patients were not
included because the disease is metastasized and therefore the therapy has a palliative character instead of a
curative character.
Thus, eighty-three sporadic colorectal cancer patients
diagnosed as stage I, II or III at the Leiden University
Medical Centre between 1991 and 2005 were selected
for the present study. Microsatellite instability of these
cancers had been determined for this group, as described
elsewhere [24]. The use of clinical material was approved
by the medical ethical board of the Leiden University
Medical Centre
Tumors were classified according to the WHO classification of tumors of the digestive system [25].
Page 2 of 11
Methods
Determination of p53 functionality
Tissue preparation for multiparameter flow cytometry and
sorting
Tumor and stromal cells were sorted from FFPE tissue
blocks using the FACS ARIA I (BD Biosciences, San
Jose, CA, USA) based on vimentin, keratin expression
and DNA content as previously described by Corver
et al. [26,27]. DNA index (DI) defined as the ratio between the median G0/G1 keratin positive epithelial fraction and the median GO/G1 vimentin stromal fraction,
was calculated using a remote link between Winlist and
ModFit (Verity Software House) for each sample. Whenever, more than one keratin positive population was
seen, it was independently sorted. DI was categorized as
DI< 0.95; DI=0.95 – 1.05; DI=1.06 – 1.4; DI=1.41 – 1.95
and DI>1.95.
DNA was purified from sorted cells after an overnight
proteinase K digestion using the Nucleospin Tissue kit
(Macherey Nagel, Düren, Germany) following manufacturer’s instructions.
SNP array hybridization for allelic state determination
A custom Golden Gate genotyping panel with 384 SNPs
was designed using the Assay Design Tool (Illumina Inc.
San Diego, CA, USA). The panel contains SNPs mapping to the following chromosomes: 1q21-25, 8q22-24,
13q12-34, 17p13-11 (the TP53 locus), 18q12-22, 20q1113, all of which are associated with tumor progression in
the colorectum [28]. SNPs on chromosome 2 served as
controls. Paired samples were analysed in the Golden
Gate assay as described [29] and hybridized to Sentrix
Array Matrix with 384 bead types. SNP arrays were
analysed in the BeadarraySNP package. The data generated was analyzed with the LAIR algorithm [23] that integrates the DNA index into the analysis. Four observers
determined LAIR scores independently (AFS, WEC, GIF
and TVW). FISH validated the 3 of the 83 samples that
showed discordance (3.6%) between the observers.
We differentiated the following allelic states:
1) Retention with genotype AB; 2) Loss of heterozygosity (LOH), genotype A; 3) copy neutral LOH (cnLOH),
genotype AA; 4) amplified LOH (aLOH) genotypes AAA
or AAAA etc.; 5) allelic imbalance (AI) or genotypes AAB,
AAABB etc.; 6) balanced amplification (BA), genotypes
AABB, AAABBB etc.; 7) multiclonal tumors (identified
through flow cytometry, see Figure 1a and b) [23].
FISH
To confirm the copy number results obtained with the
SNP array, FISH in nuclei obtained from FFPE material
of seven patients was performed. First, 2mm. punches
(Beecher Instruments, Silver Springs, MD, USA) of
Fariña Sarasqueta et al. BMC Cancer 2013, 13:277
/>
Page 3 of 11
a)
AB
A B
LOH
Copy neutral LOH
A
A A
Allelic Imbalance
A A B
Balanced amplification
A A BB
Amplified LOH
AAA
AAAA
80
b)
60
Bimodal keratin + fraction
40
Number
200
0
0
50
20
100
150
Number
250
300
350
Diploid
vimentin
fraction
0
500
1000
1500
DNA PI
2000
2500
(x 100)
0
500
1000
1500
DNA PI
2000
2500
(x 100)
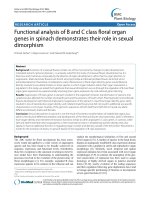
Figure 1 a) Schematic representation of the possible allelic states according to LAIR scores b) Example of a DNA histogram of one
tumor containing two populations with different DNA indexes. Green histogram is the DNA diploid vimentin positive stromal fraction and in
red the keratin positive epithelial fraction.
selected tumor areas were embedded in blanco acceptor
paraffin blocks. Subsequently, 50 μM slices were obtained,
deparaffinized and rehydrated. Antigen retrieval was
performed by high pressure cooking in Tris-EDTA pH=9.
After incubation for one hour at 37°C with RNAse, samples were digested with 0.5% pepsin pH=2 at 37°C for 30
minutes. The obtained nuclei were then washed and
resuspended in methanol: acetic acid in a 3 to 1 proportion. Thereafter nuclei were spun onto clean glasses
and hybridization with Vysis® TP53/CEP17 FISH probe
kit (Abbot Molecular, IL, USA) was allowed overnight
at 37°C. After washing, samples were mounted with
Vectashield® mounting medium containing DAPI (Vector
Laboratories Inc., Burlingame, CA, USA) and nuclei were
evaluated under the fluorescence microscope.
Seven tumors were tested for which enough material
was available and with different allelic states of chr.17p
according to the SNP array analysis.
p53 IHC staining
Tissue microarrays (TMA) of these tumors were prepared by punching three representative tumor areas
selected by a pathologist (HM) on HE stained slides
and arraying them on a recipient paraffin block
(Beecher Instruments, Silver Springs, MD, USA). Five
μM slices were then cut. Heat induced antigen retrieval (HIAR) was performed as described elsewhere
[28] and staining was carried out with the mouse antihuman monoclonal antibodies directed against p53
(clone D0-7, 1:1000 dilution) (Lab Vision NeoMarkers,
Fremont, CA, USA).
p53 was scored in four different categories based on
any level of nuclear staining, like previously described
[30] by an experienced pathologist (HM) and a pathology resident (AFS): completely negative; 1- 25% positive nuclei (indicative of a wild type state); 25-75%
positive nuclei and >75% positive nuclei. For analysis
purposes, the last two categories were fused in only one
category; more than 25% positive cells (indicative of a
mutated gene).
TP53 mutation analysis
Tumor DNA available from 40 patients was isolated from
enriched tumor areas containing at least 50% tumor cells,
as described above. Four different PCRs were performed
for amplification of exons 5, 6, 7 and 8 of the TP53
gene. Ten nanograms DNA was used for each PCR using
primers already published modified for SYBRgreen® detection [31]. Subsequently, PCR products were purified using
Qiagen’s MinElute™96 UF PCR Purification Kit (Qiagen
Sciences, Germantown, MD, USA) and reactions were sequenced using the MI13 forward and reverse primers.
Analysis was performed using the Mutation Surveyor 3.97®
sequence analysis and assembly software (SoftGenetics
LLC, Stage College, PA, USA).
mRNA expression arrays
Fresh frozen tissue of fifty-seven patients was available
for mRNA expression analysis. mRNA was isolated, labeled and hybridized to customized Agendia 44 K oligonucleotide array as described elsewhere [24].
Statistical analysis
Associations between categorical variables were studied
by χ2 and Fischer exact test. Univariate survival analysis
was performed by Kaplan Meier analysis and differences
Fariña Sarasqueta et al. BMC Cancer 2013, 13:277
/>
between survival curves were studied by Log Rank analysis. Cox Proportional Hazard Model performed multivariate survival analysis. Cancer Specific Survival was
defined as the time between curative intended surgery
and death by cancer related causes [32]. Results were
considered significant when p value <0.05. All tested
were two tailed. All of the analyses mentioned above
were performed using SPSSv16 package for Windows
(Chicago, IL, USA)
Statistical analysis of the mRNA expression data
was done using the LIMMA (Linear Modelling for
Microarray Analysis) framework in Bioconductor [33].
The expression of the 35 genes reported by Yoon et al.
[22] as genes which expression is TP53 gene dosage
dependent was analyzed in relation with p53 functional
state. Furthermore, expression levels of three probes
targeting different locations in the 3’UTR of the
CSNK1A1 gene (NM_001025105.1 transcript) were independently analyzed.
Finally, expression levels of eight genes reported by
Elyada et al. [3] as involved in murine tumor invasiveness were also analyzed.
Page 4 of 11
Table 1 Patients’ characteristics
Characteristics
Total N (%)
Age
50-59
14 (17)
60-69
27 (33)
70-79
24 (30)
80-89
16 (20)
Gender
Male
34 (41)
Female
45 (54)
Tumor Location
Right
52 (63)
Left
31 (37)
Stage
I and II
54 (65)
III
29 (35)
MMR status
MSS
55 (67)
MSI-H
27 (33)
Chr.17p allelic state
Results
AB
Patients’ description
LOH
9 (11)
CNLOH
11 (13)
Patients’ characteristics are shown in Table 1. Summarized, 54% of the patients were female, 63% of the tumors were right sided (i.e. tumors located in the colon
from the cecum until the splenic flexure) and 37% left
sided. 4% of the patients had stage I disease at diagnosis,
61% stage II and 35% stage III. Twenty-seven tumors
were MSI-H (33%), whereas 55 (67%) were MSS tumors.
Median follow up was 69 months (range 2 – 199).
At the end of the follow up, 41% of the patients were
alive, 24% of the patients had died because of cancer
related causes and 30% died because of non-cancer related causes.
Allelic state
All samples were flow cell sorted as previously described
and analyzed with a custom SNP array comprising several chromosomal regions previously reported to be implicated in colorectal cancer progression [28]. In the
present study we have focused on the allelic state of the
TP53 locus on chromosome 17p13-11 Of the 83 tumors
analyzed, 47% were classified as normal with genotype
AB, 11% as LOH (genotype A), 13% as cnLOH (genotype AA), 8% as aLOH (genotype AAA/AAAA) and 4%
as AI (genotype AAB/AAABB). Note also that 17% of
the patients showed multiple cancer populations by flow
cytometry (results shown in Table 1). No balanced amplifications were seen in the monoclonal series. FISH
analysis was used to confirm the chromosome 17 LAIR
scores for seven samples (Figure 2).
39 (47)
ALOH
7 (8)
AI
3 (4)
Multiple clones
14 (17)
DNA index
0.95 – 1.05
35 (46)
1.06 – 1.40
10 (13)
1.41 – 1.95
31 (41)
TP53
wt
22 (55)
mut
18 (45)
IHC p53
0%
10 (13)
>0% - ≤25%
35 (46)
>25%
31 (41)
Median Follow up in months (range)
68.84 (2–199)
Predicted p53 functionality
We predicted the functionality of p53 (hereafter called
functionality) for each sample (see Additional file 1:
Table S1) by combining data from the TP53 locus allelic
state, mutation data and protein expression levels. Overall, the three parameters were mostly in agreement with
each other, except for 6 out of 57 patients where there
was one discordance between mutation state, protein expression and/or allelic state. To call p53 non functional,
Fariña Sarasqueta et al. BMC Cancer 2013, 13:277
/>
Page 5 of 11
Sample 1 DNA index = 1.1
a)
LAIR chr 2: AB
b)
LAIR chr.17: A
FISH: two centromeres and one p53 copy
Sample 2 DNA index = 2.3
a)
LAIR chr. 2: AABB
b)
LAIR chr.17 AAAA
FISH: four centromeres and four p53 copies
Figure 2 Results of a) SNP array on reference chromosome and chr.17p b) FISH on Chr. 17 (the green signal corresponds to the
centromere probe and the red signal to the p53 probe).
at least two parameters should point in that direction.
Mutation state or IHC expression level weighted more
in decision making whenever one of the three parameters was not available. Associations between p53 functionality and the different variables are shown in Table 2.
In summary, the majority of tumors with a functional
p53 (78%) lacked TP53 mutations (p=0.01) and all
showed between 0-25% positive stained cells using immunohistochemistry (p<0.001). 78% of the tumors with
functional p53 had a near diploid DNA index raging
from 0.95-1.05 whereas 63% of the non functional p53
samples was highly aneuploid with DNA indexes ranging
1.41 – 1.95 (p<0.001). Samples with functional p53
showed significantly more retention of the p53 locus
(genotype AB) as compared to the group with either
aLOH (AAA/AAAA) (p=0.005), cnLOH (AA) (p<0.001)
and cases with multiclonallity (p=0.006). Moreover, the
frequency of functional p53 was increased in tumors
with LOH than with cnLOH (p=0.01). Furthermore, tumors with a functional p53 were significantly overrepresented in the group of right-sided tumors (p=0.035). Of
the tumors with non-functional p53, eighty-six percent
showed the MSS phenotype (p=0.009).
To corroborate the classification in functional and
non-functional p53 groups, we compared p53 target
gene expression levels between these two groups. We selected genes for which expression was previously shown
to be p53 gene dosage dependent by Yoon et al. [22].
Eight genes differently expressed between both groups
were identified (Table 3). As expected, known p53 targets like MDM2 and CDKN1A were significantly higher
expressed in the p53 functional group than in the non
functional group (p=0.0025 and p=0.0013 respectively).
Genes higher expressed in the non functional group were
involved in many processes such as cell proliferation
(PRKCZ), protein ubiquitination (SIAH1), metabolism
(HMGCS1) and cell differentiation (PRKCZ, PDE6A).
Survival analysis
In a univariate survival analysis, p53 functionality was
prognostic; patients with functional p53 had a better cancer specific survival than patients with non-functional p53
(Log rank p=0.009) (Figure 3).
In our cohort, patients with MSI-H tumors are slightly
more frequent than expected from epidemiological studies (33% vs. 18% expected), nevertheless MMR status did
not influence survival (data not shown) nor the effects
of p53 functionality on survival.
Recently, the role of p53 and Csnk1a1 inactivation in
tumor invasiveness in mice has been demonstrated [3].
Fariña Sarasqueta et al. BMC Cancer 2013, 13:277
/>
Page 6 of 11
Table 2 Associations between clinicopathological variables and p53 functionality
p53 non functional N (%)
p53 functional N (%)
p value
wt
7 (33)
14 (78)
0.01
mut
14 (67)
4 (22)
3 (11)
7 (24)
TP53 mutational status
P53 IHC
0
0 - ≤25%
1 (3)
22 (76)
24 (86)
0 (0)
5 (18)
22 (76)
LOH
2 (7)
4 (14)
Copy neutral LOH
9 (32)
0 (0)
Amplified LOH
5 (18)
1 (3)
1(4)
0 (0)
6 (21)
2 (7)
50 – 59
4 (14)
6 (22)
60 – 69
10 (36)
9 (32)
70 – 79
10 (36)
9 (32)
80 – 89
4 (14)
4 (14)
6 (22)
21 (78)
>25%
<0.001#
Chr. 17 p status
AB
Allelic Imbalance
Two clones
<0.001*
Age category
NS
DNA index
0.95 – 1.05
1.06 – 1.4
4 (15)
3 (11)
1.41 – 1.95
17 (63)
3 (11)
MSI
4 (14)
14 (50)
MSS
24 (86)
14 (50)
Male
12 (43)
18 (62)
Female
16 (57)
11 (38)
Right
10 (36)
19 (66)
Left
18 (64)
10 (34)
I and II
14 (50)
22 (76)
III
14 (50)
7 (24)
66.75
89.77
<0.001
MMR status
0.009
Gender
NS
Tumor Location
0.035
Stage
Median Follow up in months
0.06
0.4
*Χ2 test allelic status AB vs. LOH p=0.58; AB vs. CNLOH p<0.001; AB vs. ALOH p=0.005; AB vs. two clones p=0.006
LOH vs. CNLOH p=0.01; LOH vs. ALOH p=0.24; LOH vs. two clones p=0.28.
ALOH vs. CNLOH p=0.43; Amp LOH vs. two clones p=1.
CNLOH vs. two clones p=0.48.
# Χ2 test p53 IHC 0 vs. 0-25% p=0.07; 0 vs. >25% p<0.001; 0-25% vs. >25% p=0.001.
¶ Χ2 test DNA index 0.95 – 1.05 vs. 1.06 – 1.4 p=0.16; 0.95 – 1.05 vs. 1.41- 1.95 p<0.001; 1.06 – 1.40 vs. 1.41 – 1.95 p=0.29.
We analyzed whether the expression levels of CSNK1A1
modulate p53 effects in disease outcome. Patients were divided according to the expression level. In the group with
high CSNK1A1 expression the expression level of the
three probes analyzed (A_23_P213551; A_24_P183292;
A_24_P251899) exceeded the median value for that specific probe while in cases with low CNSK1A1 expression
the value was lower than the median.
Fariña Sarasqueta et al. BMC Cancer 2013, 13:277
/>
Page 7 of 11
Table 3 List of genes differentially expressed between functional p53 and non functional p53 groups
Gene
name
Chr.
position
Gene description
p-value, p53 functional vs.,
p53 non functional
PRKCZ
1p36.33p36.2
Serine threonine kinase involved in several processes such as proliferation, differentiation
and secretion.
4.95E-04
↑non functional
LMO3
12p12.3
Lim domain only 3 (rhombotin like 2). Expression of LMO-3 represses p53 mediated mRNA
expression of target genes.
1.2E-02
↑non functional
CDKN1A
6p21.2
Cyclin dependent kinase inhibitor. Causes cell cycle arrest in the presence of DNA damage.
1.3E-02↑functional
PDE6A
5q31.2q34
Phosphodiesterase 6A, cGMP-specific, rod, alpha
7.47E-02
SIAH1
16q12
Seven in absentia homolog 1. Involved in ubiquitination and proteosome related
degradation of specific proteins like beta catenin.
2.60E-02
TPD52L2
20q13.2q13.3
Tumor protein D52 like 2. Expressed in childhood leukemia and testes.
4.65E-02
MDM2
12q14.3q15
MDM2 p53 binding protein homolog (Mouse)
↑non functional
↑non functional
↑non functional
HMGCS1 5p14-p13 3-hydroxy 3-methylglutaryl-CoA synthase I
1.25E-02
↑ functional
1E-01
↑functional
All p-values are corrected for multiple tests.
The values of the three probes correlated significantly
with each other (Pearson’s correlation coefficient =0.94
p<0.001 between A_23_P213551 and A_24_P251899,
0.747 p<0.001 between A_23_P213551 and A_24_P183292
and finally 0.743 p<0.001 between A_24_P183292 and
A_24_P251899) (Figure 4). The three probes had the same
detrimental effect on survival in a univariate analysis with
different significant p values (data not shown). We selected the probe (A_24_P183292) with the most significant
results (Log rank p=0.003) for further analyses.
CSNK1A1 expression significantly altered the effect of
p53 in survival as shown in Figure 5. CSNK1A1 had no
Figure 3 Kaplan Meier plots for CSS according to p53 functionality.
influence on survival when p53 is functional, however,
when p53 was non-functional, CSNK1A1 expression
influenced disease outcome dramatically. Patients with
low CSNK1A1 expression had a very poor prognosis compared with patients with high CSNK1A1 expression (Log
rank p=0.007) (Figure 5).
Subsequently, we compared the patients with non functional p53 and low CSNK1A1 expression with the rest of
patients (i.e. non functional p53 and high CSNK1A1
expression or functional p53 with high or low CSNK1A1
expression). Survival in patients with both genes affected
was decreased compared to patients with one of both
Fariña Sarasqueta et al. BMC Cancer 2013, 13:277
/>
Page 8 of 11
Figure 4 Trends in expression of the three CSNK1A1 probes.
genes active (Figure 6) (Log rank p<0.001). Moreover, this
detrimental effect on disease outcome was significant in a
multivariate model including tumor stage, gender, tumor
ocation and MMR status in the model (HR=4.74 95% CI
1.47-15.34 p=0.009) (Table 4).
Expression of invasiveness genes
Elyada et al. reported up regulation of eight genes
in p53 and Csnk1a1 double knockout mice and their
involvement in murine tumor invasiveness [3]. We
analysed their expression in our series. Two genes,
mainly PLAT (plasminogen activator tissue) and
PNLPRP1 (pancreatic lipase related protein 1) were
significantly differently expressed between the two
groups of patients; the group with low CSKN1A1
expression and non-functional p53 vs. the remaining
group (with functional p53 and high or low CSKN1A1
expression and non functional p53 and high CSNK1A1
expression). PLAT was upregulated in the latter group
(p=0.009) whereas PNLPRP1 was higher expressed in
the non-functional p53 and low CSNK1A1 expression
(p=0.009).
Figure 5 Kaplan Meier plots for CSS according to CSNK1A1 expression stratified on the base of p53 functionality.
Fariña Sarasqueta et al. BMC Cancer 2013, 13:277
/>
Page 9 of 11
Figure 6 Kaplan Meier for CSS according to p53 and CSNK1A1 combination variable.
Discussion
TP53 is a transcription factor with important functions
in cellular apoptosis, senescence, DNA damage repair,
autophagy, aging and glycolysis [34-36]. Therefore, it is a
strategic target for inactivation in cancer cells; indeed,
somatic mutations are found in approximately 50% of
all tumors [4]. However, the consequences of p53
inactivation in disease outcome in colon cancer remain
controversial and subject to discussion. These inconclusive result could in part be explained by the combination
of differences in the techniques used to assess p53 alterations (IHC or mutation analysis), and the many possible
ways of p53 inactivation (deletion and dominant negative, loss or gain of function mutations).
Table 4 Cox Proportional Hazards Model: multivariate survival analysis
Variables
HR
95% CI
p value
1.47 – 15.34
0.009*
1.08 – 11.2
0.037*
p53 & CSNK1A1
p53 - & CSNK1A1 + and p53+ & CSNKA1A +/−
p53 - CSNK1A1 -
Referent
4.74
Tumor stage
I & II
III
Referent
3.48
Tumor location
Right
Referent
Left
0.92
0.32 – 2.67
0.58
0.92
0.32 – 2.97
0.88
0.097 – 1.91
0.27
Gender
Male
Female
Referent
MMR state
MSS
0.43
MSI
Referent
* Statistically significant results.
Fariña Sarasqueta et al. BMC Cancer 2013, 13:277
/>
We studied TP53 using several approaches; first we
determined tumor ploidy and TP53 locus allelic state.
Next, we assessed TP53 mutation state and protein expression by IHC. By integrating these data we could predict
p53 functionality. The classification in functional and nonfunctional p53 was supported by the significant differences
in target gene expression between these two groups. Thus,
with this approach complete information on the gene was
obtained allowing a more reliable classification than solely
by mutation analysis or immunohistochemistry.
As it could be expected based on the functions of p53,
tumors with a non-functional p53 were highly aneuploid.
Moreover, the prognosis for patients with these tumors
was worse compared to the group with functional p53.
We have also shown that p53 can indeed behave as a
haploinsufficient tumor suppressor gene as demonstrated
in mouse models [20]. We accurately assessed the TP53
genotypes by combining the allelic state at the TP53 locus
using SNP arrays, combined with TP53 mutation analyses.
In our cohort there were a few cases with LOH at the
TP53 locus but without mutations in exons 5, 6, 7 and 8
and without positive immunostaining. Moreover, the tumors had a near-diploid genome and were associated with
a good disease outcome as compared with other patients
(Supplementary data figure 1). Our finding supports the
observation that p53 +/− mice did develop tumors but
show a milder phenotype than p53−/− mice [20].
Recently, in mice Csnk1a1 or CKIα expression has
been implicated in colon cancer invasiveness and cell
transformation in the gut [3]. CSNK1A1 is a serine/
threonine kinase that phosphorylates β-catenin to target
it for destruction [37]. In a mouse model, ablation of
Csnk1a1 caused the accumulation of β-catenin in the
cytoplasm and nucleus activating many Wnt target genes
although no tumor formation was observed. Instead,
senescence was induced in these cells pointing to a possible role of p53 in tumor inhibition. Indeed, the authors
found that inactivation of both Csnk1a1 and p53 rendered
the cell malignant and rapidly invasive [3]. Likewise, in the
present cohort of patients, we have identified CSNK1A1
as a dramatic modifier of p53 effects on survival. High
CSNK1A1 expression partly counteracts the negative effects of a non functional p53. Accordingly, low CSNK1A1
expression and non functional p53 was equal to a very
poor prognosis with a median survival time of 3 years and
a 5-year survival of only 35%, which is extremely poor for
early stage disease. Furthermore, this negative effect on
survival was independent of disease stage, gender, tumor
location and mismatch repair state, as shown in the multivariate analysis.
The exact mechanism behind this poor survival is unknown; Elyada et al. showed that expression of certain
genes was upregulated in the double knockout mice
(p53−/− and Csnk1a1−/−) as compared with the only
Page 10 of 11
Csnk1a1−/− mice. Some of these genes were involved in
loss of enterocyte polarity, tissue remodeling and cell
motility; all functions likely to be involved in tumor invasiveness [3]. In the present cohort of patients only two
of the human homologues from the murine gene list
proposed were differentially expressed, i.e. plasminogen
activator tissue (PLAT) and pancreatic lipase related
protein 1 (PNLRP1) in tumors with impaired p53 function and low expression of CSNK1A1 versus the
remaining tumors. The latter results might reflect differences between mouse and man. Moreover, the human
comparison was not identical to the murine comparison
by Elyada and co workers. Furthermore in contrast to
the murine model, PLAT was upregulated in the group
with at least one active gene (functional p53 with low or
high CSNK1A1 expression and non functional p53 with
high CSNK1A1 expression) and could therefore be associated with a better survival. In human, the increased
expression of the plasminogen activator inhibitor was associated with the occurrence of distant metastasis in
colon cancer [38], probably leading to decreased levels
of PLAT which would corroborate our findings. To our
knowledge, the role of PNLRP1 in tumor invasiveness
and progression is so far unknown.
Conclusion
The combination of several approaches provides additional and accurate information on p53 status showing a
detrimental effect on survival when p53 function is impaired. Nevertheless, gene interplay remains very important in tumor biology as it is illustrated by the modifying
role of CSNK1A1 gene expression on the survival effects
of TP53 in colon cancer. Loss of both genes confers an extremely poor prognosis to colon cancer patients.
Additional file
Additional file 1: Table S1. Call of p53 functionality according to all
parameters analyzed.
Competing interest
The authors have no conflict of interest to disclose.
Authors’ contributions
All authors have contributed equally in the preparation and execution of this
manuscript. AFS: data analysis, writing, allelic state assessment according to
LAIR algorithm, FISH, p53 mutation analysis and immunohistochemistry
scores. GIF: DNA isolation, cell sorting, manuscript review. WEC: allelic scores,
cell sorting, manuscript review. NF dM: clinical follow up of the cohort, DNA
isolation, immunohistochemistry, MSI determination, manuscript review. DR:
allelic state score, statistical and array analysis, concept and manuscritp
review. RvE: DNA isolation, p53 mutation and manuscript review. JO:
Concept, LAIR algorithm development, statistics and manuscript review. RT:
patient selection, concept and manuscript review. TvW: concept, DNA
isolation, allelic state score and mnuscript review. HM: concept, analysis of
histomorfology and immunohistochemistry scores and manuscript review.
All authors read and approved the final manuscript.
Fariña Sarasqueta et al. BMC Cancer 2013, 13:277
/>
Author details
1
Department of Pathology, Leiden University Medical Centre, P.O. Box 9600
L1-Q2300 RC, Leiden, the Netherlands. 2Department of Surgery, Leiden
University Medical Centre, Leiden, the Netherlands.
Received: 1 November 2012 Accepted: 8 May 2013
Published: 5 June 2013
References
1. Cho KR, Vogelstein B: Genetic alterations in the adenoma–carcinoma
sequence. Cancer 1992, 70(6 Suppl):1727–1731.
2. Bargonetti J, Manfredi JJ: Multiple roles of the tumor suppressor p53.
Curr Opin Oncol 2002, 14(1):86–91.
3. Elyada E, Pribluda A, Goldstein RE, Morgenstern Y, Brachya G, Cojocaru G,
Snir-Alkalay I, Burstain I, Haffner-Krausz R, Jung S, et al: CKIalpha ablation
highlights a critical role for p53 in invasiveness control. Nature 2011,
470(7334):409–413.
4. Hollstein M, Sidransky D, Vogelstein B, Harris CC: p53 mutations in human
cancers. Science 1991, 253:49–53.
5. Baretton GB, Vogt M, Muller C, Diebold J, Schneiderbanger K, Schmidt M,
Lohrs U: Prognostic significance of p53 expression, chromosome 17 copy
number, and DNA ploidy in non-metastasized colorectal carcinomas
(stages IB and II). Scand J Gastroenterol 1996, 31(5):481–489.
6. Bazan V, Migliavacca M, Zanna I, Tubiolo C, Corsale S, Calo V, Amato A,
Cammareri P, Latteri F, Grassi N, et al: DNA ploidy and S-phase fraction,
but not p53 or NM23-H1 expression, predict outcome in colorectal
cancer patients. Result of a 5-year prospective study.
J Cancer Res Clin Oncol 2002, 128(12):650–658.
7. Bleeker WA, Hayes VM, Karrenbeld A, Hofstra RM, Hermans J, Buys CC,
Plukker JT: Impact of KRAS and TP53 mutations on survival in patients
with left- and right-sided Dukes’ C colon cancer. Am J Gastroenterol 2000,
95(10):2953–2957.
8. Bouzourene H, Gervaz P, Cerottini JP, Benhattar J, Chaubert P, Saraga E,
Pampallona S, Bosman FT, Givel JC: p53 and Ki-ras as prognostic factors
for Dukes’ stage B colorectal cancer. Eur J Cancer 2000, 36(8):1008–1015.
9. Chang S-C, Lin J-K, Yang SH, Wang H-S, Li AF-Y, Chi C-W: Relationship
between genetic alterations and prognosis in sporadic colorectal cancer.
Int J Cancer 2006, 118:1721–1717.
10. Clausen OP, Lothe RA, Borresen-Dale AL, De Angelis P, Chen Y, Rognum TO,
Meling GI: Association of p53 accumulation with TP53 mutations, loss of
heterozygosity at 17p13, and DNA ploidy status in 273 colorectal
carcinomas. Diagn Mol Pathol 1998, 7(4):215–223.
11. Conlin A, Smith G, Carey FA, Wolf CR, Steele RJ: The prognostic
significance of K-ras, p53, and APC mutations in colorectal carcinoma.
Gut 2005, 54(9):1283–1286.
12. Elsaleh H, Powel B, McCaul K, Grieu F, Grant R, Joseph D, Iacopetta B: p53
alteration and microsatellite instability have predictive value for survival
benefit from chemotherapy in stage III colorectal carcinoma.
Clin Cancer Res 2001, 7:1343–1349.
13. Goh H-S, Chan C-S, Khine K, Smith DR: p53 and the behaviour of
colorectal cancer. Lancet 1994, 344:233–234.
14. Goh H-S, Yao J, Smith DR: p53 point mutation and survival in colorectal
cancer patients. Cancer Res 1995, 55:5217–5221.
15. Iacopetta B, Russo A, Bazan V, Dardanoni G, Gebbia N, Soussi T, Kerr D,
Elsaleh H, Soong R, Kandioler D, et al: Functional categories of TP53
mutation in colorectal cancer: results of an International Collaborative
Study. Ann Oncol 2006, 17(5):842–847.
16. Munro AJ, Lain S, Lane DP: p53 abnormalities and outcomes in colorectal
cancer:a systematic review. Br J Cancer 2005, 92:434–444.
17. Russo A, Bazan V, Agense V, Rodolico V, Gebbia N: Prognostic and
predictive factors in colorectal cancer: Kirsten Ras in CRC (RASCAL) and
TP53CRC collaborative studies. Ann Oncol 2005, 16(4):iv44–iv49.
18. Walther A, Houlston R, Tomlinson I: Association between chromosomal
instability and prognosis in colorectal cancer: a meta-analysis. Gut 2008,
57(7):941–950.
19. Westra JL, Boven LG, van der Vlies P, Faber H, Sikkema B, Schaapveld M,
Dijkhuizen T, Hollema H, Buys CH, Plukker JT, et al: A substantial proportion
of microsatellite-unstable colon tumors carry TP53 mutations while not
showing chromosomal instability. Genes Chromosomes Cancer 2005,
43(2):194–201.
Page 11 of 11
20. Venkatachalam S, Shi YP, Jones SN, Vogel H, Bradley A, Pinkel D, Donehower
LA: Retention of wild-type p53 in tumors from p53 heterozygous mice:
reduction of p53 dosage can promote cancer formation. EMBO J 1998,
17(16):4657–4667.
21. Lynch CJ, Milner J: Loss of one p53 allele results in four-fold reduction of
p53 mRNA and protein: a basis for p53 haplo-insufficiency. Oncogene
2006, 25(24):3463–3470.
22. Yoon H, Liyanarachchi S, Wright FA, Davuluri R, Lockman JC, de la Chapelle
A, Pellegata NS: Gene expression profiling of isogenic cells with different
TP53 gene dosage reveals numerous genes that are affected by TP53
dosage and identifies CSPG2 as a direct target of p53. Proc Natl Acad Sci
USA 2002, 99(24):15632–15637.
23. Corver WE, Middeldorp A, ter Haar NT, Jordanova ES, van Puijenbroek M,
van Eijk R, Cornelisse CJ, Fleuren GJ, Morreau H, Oosting J, et al: Genomewide allelic state analysis on flow-sorted tumor fractions provides an
accurate measure of chromosomal aberrations. Cancer Res 2008,
68(24):10333–10340.
24. Salazar R, Roepman P, Capella G, Moreno V, Simon I, Dreezen C, LopezDoriga A, Santos C, Marijnen C, Westerga J, et al: Gene Expression
Signature to Improve Prognosis Prediction of Stage II and III Colorectal
Cancer. J Clin Oncol 2011, 29(1):17–24.
25. Bosman F, Carneiro F, Hruban RH, Theise ND: WHO classification of tumours
of the digestive system. Fourthth edition. Lyon, France: International Agency
for Research on Cancer (IARC); 2010. Chapter 8; 134-146.
26. Corver WE, ter Haar NT: High-resolution multiparameter DNA flow cytometry
for the detection and sorting of tumor and stromal subpopulations from
paraffin-embedded tissues. Curr Protoc Cytom 2011, 7(7):37.
27. Corver WE, Ter Haar NT, Dreef EJ, Miranda NF, Prins FA, Jordanova ES,
Cornelisse CJ, Fleuren GJ: High-resolution multi-parameter DNA flow
cytometry enables detection of tumour and stromal cell subpopulations
in paraffin-embedded tissues. J Pathol 2005, 206(2):233–241.
28. Lips EH, van Eijk R, de Graaf EJ, Doornebosch PG, de Miranda NF, Oosting J,
Karsten T, Eilers PH, Tollenaar RA, van Wezel T, et al: Progression and tumor
heterogeneity analysis in early rectal cancer. Clin Cancer Res 2008,
14(3):772–781.
29. Middeldorp A, van Eijk R, Oosting J, Forte GI, van Puijenbroek M, van
Nieuwenhuizen M, Corver WE, Ruano D, Caldes T, Wijnen J, et al: Increased
frequency of 20q gain and copy-neutral loss of heterozygosity in mismatch
repair proficient familial colorectal carcinomas. Int J Cancer 2011.
30. Cruz I, Snijders PJ, Van Houten V, Vosjan M, Van der Waal I, Meijer CJ: Specific
p53 immunostaining patterns are associated with smoking habits in patients
with oral squamous cell carcinomas. J Clin Pathol 2002, 55(11):834–840.
31. Romeo S, Debiec-Rychter M, Van Glabbeke M, Van Paassen H, Comite P, Van
Eijk R, Oosting J, Verweij J, Terrier P, Schneider U, et al: Cell cycle/apoptosis
molecule expression correlates with imatinib response in patients with
advanced gastrointestinal stromal tumors. Clin Cancer Res 2009,
15(12):4191–4198.
32. Hosmer DW, Lemeshow S: Applied survival analysis. Regression modelling of
time to event data. New York: John Wiley & Sons, INC; 1999.
33. Smyth GK: Linear models and empirical bayes methods for assessing
differential expression in microarray experiments. Stat Appl Genet Mol Biol
2004, 3:3.
34. Vousden KH, Lane DP: p53 in health and disease. Nat Rev Mol Cell Biol
2007, 8(4):275–283.
35. Vousden KH, Prives C: Blinded by the Light: The Growing Complexity of
p53. Cell 2009, 137(3):413–431.
36. Zuckerman V, Wolyniec K, Sionov RV, Haupt S, Haupt Y: Tumour
suppression by p53: the importance of apoptosis and cellular
senescence. J Pathol 2009, 219(1):3–15.
37. Liu C, Li Y, Semenov M, Han C, Baeg GH, Tan Y, Zhang Z, Lin X, He X:
Control of beta-catenin phosphorylation/degradation by a dual-kinase
mechanism. Cell 2002, 108(6):837–847.
38. Markl B, Renk I, Oruzio DV, Jahnig H, Schenkirsch G, Scholer C, Ehret W,
Arnholdt HM, Anthuber M, Spatz H: Tumour budding, uPA and PAI-1 are
associated with aggressive behaviour in colon cancer. J Surg Oncol 2010,
102(3):235–241.
doi:10.1186/1471-2407-13-277
Cite this article as: Fariña Sarasqueta et al.: Integral analysis of p53 and
its value as prognostic factor in sporadic colon cancer. BMC Cancer 2013
13:277.