Negative transcriptional control of ERBB2 gene by MBP-1 and HDAC1: Diagnostic implications in breast cancer
Bạn đang xem bản rút gọn của tài liệu. Xem và tải ngay bản đầy đủ của tài liệu tại đây (2.62 MB, 12 trang )
Contino et al. BMC Cancer 2013, 13:81
/>
RESEARCH ARTICLE
Open Access
Negative transcriptional control of ERBB2 gene by
MBP-1 and HDAC1: diagnostic implications in
breast cancer
Flavia Contino1†, Claudia Mazzarella1†, Arianna Ferro1, Mariavera Lo Presti1,3, Elena Roz3, Carmelo Lupo3,
Giovanni Perconti2, Agata Giallongo2* and Salvatore Feo1,2*
Abstract
Background: The human ERBB2 gene is frequently amplified in breast tumors, and its high expression is associated
with poor prognosis. We previously reported a significant inverse correlation between Myc promoter-binding
protein-1 (MBP-1) and ERBB2 expression in primary breast invasive ductal carcinoma (IDC). MBP-1 is a transcriptional
repressor of the c-MYC gene that acts by binding to the P2 promoter; only one other direct target of MBP-1, the
COX2 gene, has been identified so far.
Methods: To gain new insights into the functional relationship linking MBP-1 and ERBB2 in breast cancer, we have
investigated the effects of MBP-1 expression on endogenous ERBB2 transcript and protein levels, as well as on
transcription promoter activity, by transient-transfection of SKBr3 cells. Reporter gene and chromatin
immunoprecipitation assays were used to dissect the ERBB2 promoter and identify functional MBP-1 target
sequences. We also investigated the relative expression of MBP-1 and HDAC1 in IDC and normal breast tissues by
immunoblot analysis and immunohistochemistry.
Results: Transfection experiments and chromatin immunoprecipitation assays in SKBr3 cells indicated that MBP-1
negatively regulates the ERBB2 gene by binding to a genomic region between nucleotide −514 and −262 of the
proximal promoter; consistent with this, a concomitant recruitment of HDAC1 and loss of acetylated histone H4
was observed. In addition, we found high expression of MBP-1 and HDAC1 in normal tissues and a statistically
significant inverse correlation with ErbB2 expression in the paired tumor samples.
Conclusions: Altogether, our in vitro and in vivo data indicate that the ERBB2 gene is a novel MBP-1 target, and
immunohistochemistry analysis of primary tumors suggests that the concomitant high expression of MBP-1 and
HDAC1 may be considered a diagnostic marker of cancer progression for breast IDC.
Keywords: MBP-1, ERBB2, Transcriptional regulation, Histone Deacetylase, Breast cancer
Background
The ERBB2 (Her2/Neu) gene encodes a tyrosine kinase
receptor whose abnormal activity is linked to oncogenesis in breast cancer. In fact, ERBB2 gene amplification
is found in 20−30% of primary breast tumors, and it is
* Correspondence: ;
†
Equal contributors
2
Istituto di Biomedicina e Immunologia Molecolare, CNR, Via Ugo La Malfa,
153, Palermo I-90146, Italy
1
Dipartimento di Scienze e Tecnologie Molecolari e Biomolecolari, Università
di Palermo, Viale delle Scienze, Ed. 16, Palermo I-90128, Italy
Full list of author information is available at the end of the article
usually associated with poor clinical prognosis. In these
tumors, ErbB2 receptor overexpression activates several
intracellular signalling pathways, such as the Ras/Erk
and PI3K/AKT pathways [1], whose effects on c-MYC
oncogene transcription and Myc protein stability have
been demonstrated [2]. The treatment of ERBB2amplified breast tumor cells with the ErbB2-specific
antibody trastuzumab causes cell cycle arrest accompanied by a decrease in PI3K/Akt activity and the
downregulation of c-MYC and D-type cyclins; on the
other hand, ectopic expression of c-MYC in ERBB2overexpressing SKBr3 cells partially rescues the cells
© 2013 Contino et al.; licensee BioMed Central Ltd. This is an Open Access article distributed under the terms of the Creative
Commons Attribution License ( which permits unrestricted use, distribution, and
reproduction in any medium, provided the original work is properly cited.
Contino et al. BMC Cancer 2013, 13:81
/>
from functional ERBB2 inactivation [3,4]. Several studies
have reinforced the significance of c-MYC as an ERBB2
effector and the functional role that the two genes play
in breast cancer progression (for a review, see [5]).
The c-MYC gene is regulated at multiple levels. One
of the regulators, the Myc promoter-binding protein-1
(MBP-1), was originally identified in HeLa cells as a
transcriptional repressor which binds to the human cMYC P2 promoter, negatively affecting transcription.
This factor competes for the TATA-binding protein
(TBP) and prevents the formation of the transcription
initiation complex [6,7]. MBP-1 is a short form of the 48
kDa alpha-enolase protein, lacking the first 96 amino
acid. Several studies support the existence of a single
ENO1 gene transcript from which both alpha-enolase
and MBP-1 arise through the use of alternative translation initiation sites [8,9]. More recently, it has been
reported that a shorter variant transcript, originating
from intron III of the ENO1 gene, may contribute to
MBP-1 expression in a variety of normal tissues and
cancer cells [10]. Exogenous MBP-1 expression inhibits
the growth of breast tumors in nude mice [11], induces
cell death in neuroblastoma cells [12], suppresses
proliferation in non-small-cell lung cancer cells [13], and
induces G0–G1 growth arrest in chronic myeloid
leukemia cells [14]. Moreover, a role for MBP-1 in tumor
invasion and metastasis has been proposed for follicular
thyroid carcinoma and gastric cancer [15,16]. MBP-1
may exert its function as a single factor, in concert with
other factors, or through physical interaction with its
identified cellular partners: MIP-2/sedlin [17], histone
deacetylase 1 (HDAC1) [18], the kelch protein NS1-BP
[19], and the Notch 1 receptor intracellular domain [20].
Besides c-MYC, only one other direct target of MBP-1,
the COX2 gene, has been identified so far [16].
Consistent with its negative regulatory role on cell
growth, the endogenous level of MBP-1 in tumor cells is
low; in MCF-7 breast cancer cells, glucose concentration
and hypoxia have been reported to modulate MBP-1 expression and its binding to the c-MYC promoter, consequently affecting cell proliferation [21,22]. Thus, MBP-1
appears to be one of the factors controlling cell growth
and proliferation, and alterations in its expression level
induced by the tumor microenvironment may contribute
to cancer development.
Our previous studies have indicated that MBP-1 is
expressed and easily detectable in normal breast epithelial cells, but a loss of expression occurs in most primary
invasive ductal carcinomas (IDC) of the breast. Furthermore, MBP-1 expression inversely correlates with expression levels of the ErbB2 and Ki67 proteins [23]. On
the basis of these observations, we hypothesized a direct
functional link between MBP-1 and the ERBB2 gene in
human breast carcinomas.
Page 2 of 12
In the present study, we provide evidence that MBP-1
inhibits the expression of the ERBB2 gene in SKBr3
breast cancer cells by interacting with the promoter region. In addition, we show that HDAC1 is recruited to
the same region of the ERBB2 promoter which is bound
by MBP-1. Finally, we report a significant correlation between MBP-1, HDAC1 and ERBB2 protein expression in
primary breast carcinomas. Taken together, our findings
indicate that the ERBB2 gene is a target of MBP-1 and
suggest that the concomitant high expression of MBP-1
and HDAC1 may be considered a diagnostic marker for
IDC.
Methods
Cell culture and tumor tissues
The ERBB2-amplified human breast cancer cell line
SKBr3, was purchased from American Type Culture
Collection (ATCC, Rockville, MD). Cells were cultured
in DMEM medium supplemented with 10% fetal bovine
serum, 2 mM glutamine and 100 μg/ml penicillin/
streptomycin (Invitrogen, Carlsbad, CA).
Tumor tissue samples were from 45 patients submitted to routine histopathological examination at the
Anatomic Pathology Unit of La Maddalena Hospital in
Palermo. All experiments using human tissues were
performed with the written patients’ informed consent
and with the approval of Institutional Review Boards
from La Maddalena Hospital.
Reporter and effector plasmid constructs
The construction of the effector plasmid pFlag-MBP-1
has been described previously [19]. For the reporter
constructs, the relevant regions of the ERBB2 promoter,
including 44 base pairs (bp) of the first exon, were
obtained by PCR amplification of genomic DNA from a
human-mouse hybrid cell line containing only chromosome 17 [24]. Three DNA fragments, spanning 306-,
558- and 787-bp, were amplified with primers containing
restriction sites and cloned into the luciferace vector
pGL3-basic (Promega, Madison, WI). In order to confirm the nucleotide sequence and the correct orientation
of the cloned fragments, the three reporter plasmids,
pG-E300, pG-E500 and pG-E700 were subjected to
cycle-sequencing on an ABI 3130 genomic analyzer,
according to the manufacturer’s instructions (Applied
Biosystems, Foster City, CA),
Cell transfection and luciferase reporter assay
SKBr3 cells were transfected with Lipofectamine LTX reagent in OptiMem medium as instructed by the manufacturer (Invitrogen). For RT-PCR, western blot and ChIP
analyses 1.5x10⁶ cells in 10 mm culture dishes were
transfected with either the pFlag-MBP1 (3.5 or 7.5 μg) or
pFlag-CMV plasmid (7.5 μg) and cell extracts were
Contino et al. BMC Cancer 2013, 13:81
/>
prepared 48 hrs after transfection. An aliquot of the
transfected cells was routinely monitored for transfection
efficiency by immunofluorescence assay and Western blot
analysis with anti-Flag antibodies. Only samples yielding
more than 70% transfected cells and lysates with no
detectable Flag-MBP-1 breakdown products were used for
further analysis.
For immunofluorescence assays, 1.5x10⁵ SKBr3 cells
were grown onto glass coverslips in 12-well culture
plates for 24 hrs, then transfected with either 750 ng of
pFLAG-MBP1 or pEGFPN1 plasmid (Clontech, Mountain View, CA), as described previously [19].
For reporter assays cells (6×10⁵) were transfected with
750 ng of the pGL-cmp luciferase reporter construct
and 250 ng of the β-galactosidase expressing vector
pSVβ-gal (Promega, Madison, WI), the latter used as an
internal control plasmid to monitor transfection efficiency. In cotransfection experiments with the pFLAGMBP1 effector vector (1.25 μg), the total amount of
DNA was kept constant by addition of the empty expression plasmid. Luciferase and beta-galactosidase activities were measured independently in duplicate using
the Bright-Glo Luciferase Assay and Beta-Glo Assay
Systems (Promega, Madison, WI) and a Turner 20/20
luminometer (Turner Designs, Inc., Sunnyvale, CA).
Luciferase activity was normalized with respect to betagalactosidase activity. All transfections were performed
in triplicate and results from three independent
experiments are expressed as mean ± SD.
Total RNA isolation and quantitative real-time PCR
Total RNA was extracted using Trizol reagent (Invitrogen,
Carlsbad, CA) according to the manufacture’s instructions.
RNA was reverse-transcribed with the Superscript II reverse transcriptase (Invitrogen, Carlsbad, CA) and cDNA
amplified as described previously [23] using either c-MYC
or ERBB2 specific primers (Qiagen, Hilden, Germany) and
Power SYBER Green PCR ready-mix in a 7300 thermal
cycler (Applied Biosystems, Foster City, CA), primer
sequences are listed in (Additional file 1: Table S1). PCR
conditions were: denaturation at 95C° for 3 minutes,
followed by 35 cycles at 95C° for 20 seconds, 60C° for 15
seconds, and 72C° for 15 seconds, and a final extension at
72°C for 7 minutes. Reaction specificity was controlled by
post-amplification melting curve analysis and agarose gel
electrophoresis of the amplified products. To correct for
the experimental variations between samples, Ct value of
TBP mRNA was determined in each PCR reaction using
specific primers (Qiagen, Hilden, Germany). Data shown
were generated from three independent experiments
performed in triplicates and are expressed as mean ± SD.
Comparison and statistical analysis were performed using
Student t test.
Page 3 of 12
Immunofluorescence and microscopy
SKBr3 breast cancer cells were seeded onto glass
coverslips in a 12-well plate culture vessel, 48–72 hrs posttransfection cells were fixed with 3.7% paraformaldehyde
in phosphate buffered saline (PBS) and then permeabilized
with 0.3% Triton X-100 in PBS. To detect endogenous
ErbB2 and ectopically expressed Flag-MBP-1 proteins cells
were incubated with 1 ug/ml of mouse anti-ErbB2
(sc-80898, Santa Cruz Biotechnology, Santa Cruz, CA)
and rabbit anti-Flag (F7425, Sigma Chemical Company, St
Louis, MO) primary antibodies in PBS containing 0.2%
Tween 20. AlexaFluor 488-conjugated goat anti-rabbit
IgG and AlexaFluor 594-conjugated goat anti-mouse IgG
(Invitrogen, Carlsbad, CA) at a dilution of 1:600 were used
as secondary antibodies. DNA was counterstained with
406-diamidino-2-phenylindole (DAPI) and the coverslips
were mounted onto glass slides with Slowfade reagent
(Invitrogen, Carlsbad, CA). Primary-antibody-omission
demonstrated the specificity of the immunostaining. Immunofluorescence microscopy was performed with either
a Leica DM-RA2 microscope, or a Leica TCS SP5 confocal
laser-scanning microscope and confocal optical sections
were created using Leica confocal software.
Immunoblotting and immunohistochemistry
Total cell lysates from transfected cells were prepared in
RIPA buffer (50 mM TrispH 7.4, 150 mM NaCl, 1%
Triton X-100, 0.1% SDS, 1% sodiumdeoxycholate, 1 mM
EDTA, 0.5 mM DTT) supplemented with protease and
phosphatase inhibitors (Sigma Chemical Company, St
Louis, MO). Frozen normal and tumor tissues were
homogenized and lysates prepared as described previously
[23]. Protein concentrations of tissue and cell lysates were
determined by the Bradford protein assay (BioRad,
Hercules, CA). Samples (30–40 ug) were separated on 412% polyacrylamide gradient gels (Invitrogen, Carlsbad,
CA), and transferred to PVDF membrane, according
to the manufacturer’s instructions (Amersham Biosciences,
Sweden). Membranes were probed with primary antibodies: rabbit anti-Flag (F7425, Sigma Chemical Company, St Louis, MO, dilution 1:200), rabbit anti-ErbB2,
(18299-1-AP, Proteintech, dilution 1:100), mouse anti-Myc
(sc-40, Santa Cruz Biotechnology, Santa Cruz, CA, dilution
1:200) rabbit anti-HDAC1 (ab7028, Abcam, Cambridge,
UK, dilution 1:500) and horseradish peroxidase-conjugated
secondary antibodies (Amersham Bioscience, Sweden).
Membranes were additionally probed with mouse betaactin antibody (AC-15, Sigma Chemical Company, St Louis,
MO) as a loading control. Detection was performed
with a chemiluminescent substrate (Pierce Biotechnology,
Rockford, IL) and signals were quantified by densitometric
analysis employing the AlphaEasyFc software (Alpha
Innotech Corporation, Johannesburg, South Africa).
Contino et al. BMC Cancer 2013, 13:81
/>
Immunohistochemistry was performed on tissue serial
sections of archived formalin-fixed, paraffin-embedded
tissue blocks from patients as described previously [23],
using primary antibodies against ErbB2 (4B5, Ventana
Medical System, dilution 1:500), MBP-1/alpha-enolase
(monoclonal antibodies ENO-19/8 and ENO-276/3, 1.0
ug/ml, [23]) and HDAC1 (ab7028, Abcam, dilution
1:1000). To confirm the specificity of immunoreactions,
the primary antibody was either omitted or replaced by
non-immune IgG. Tissue slides were evaluated blindly by
two authors (ER and CL). The imunohistochemical grading scale used to evaluate the intensity and percentage of
MBP-1-positive cells has been described previously [23].
Tumors were graded as ErbB2-positive with a score of 3+
and negative with a score of 0 or 1+, according to common pathological guidelines. Tumors ErbB2-positive 2+
were further evaluated by in situ hybridization (FISH) with
a dual-color probe (PathVysion ErbB2/CEP17; Vysis,
Downers Grove, IL, USA), according to manufacturer’s
instructions, and scored positive when ErbB2 gene amplification was found. Immunohistochemical score for
HDAC1 expression in each tissue section was calculated
as the percentage of positively stained cells on total cells.
Chromatin immunoprecipitation (ChIP) assay
In vivo MBP-1 and HDAC1 occupancy at the ERBB2 and
c-MYC promoter was investigated using a ChIP assay kit
(Upstate Biotech, Billerica, MA). Sheared chromatin
samples from either pFlag-MBP1- or pFlag-CMV-transfected SKBr3 cells were separately immunoprecipitated
with rabbit anti-Flag, anti-HDAC1 or anti-acetylated Histone H4 polyclonal antibodies (Upstate Biotech, Billerica,
MA). The recovered DNA was analyzed by quantitative
real-time PCR as described previously [25], using primers
specific to either ERBB2 or c-MYC promoter, and to unrelated sequences as a negative control (Additional file 1:
Table S1). A DNA sample representing 10% of the total input chromatin was also included as a positive control. The
data shown are means ± standard deviations (SD) from
three independent experiments performed in triplicates
and are expressed as percentage of total input DNA.
Statistical analysis
Group comparison and statistical analyses were performed
using the software tools in GraphPad Prism version 4.02
for Windows (GraphPad Software, Inc. La Jolla, CA,
USA). All tests of statistical significance were twotailed and p-values less than 0.05 were considered
statistically significant.
Results
MBP-1 negatively regulates ERBB2 expression
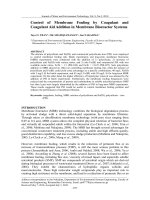
To test the effect of MBP-1 overexpression on the endogenous ERBB2 gene, we transfected SKBr3 breast
Page 4 of 12
cancer cells with either a plasmid vector encoding a Flagtagged MBP-1 protein (Flag-MBP-1) or an empty vector as
a negative control; we then measured ERBB2 and c-MYC
mRNA and protein expression levels by quantitative realtime PCR and Western blot, respectively (Figure 1A, B). In
SKBr3 cells, which carry an amplification of the ERBB2
locus, the endogenous MBP-1 protein was barely detectable (data not shown). The overexpression of Flag-MBP-1
resulted in a significant reduction in endogenous c-MYC
and ERBB2 transcript levels, 45% and 59% respectively,
while no significant changes occurred after transfection
with the empty vector (Figure 1A). Consistent with these
results, Myc and ErbB2 protein levels were significantly
reduced (Figure 1B). We then performed immunofluorescence analysis to investigate the level of the ErbB2
protein and its subcellular localization at the single
cell level. As expected, a marked reduction of the
ErbB2 protein along the cell membrane was observed
in Flag-MBP-1-expressing cells (Figure 1C, a-c, and
Additional file 2: Figure S1), whereas the level and
localization of the ErbB2 protein were unchanged in
SKBr3 cells transfected with the control vector expressing
Green Fluorescent Protein(GFP) (Figure 1C, d-f, and
Additional file 2: Figure S1).
As previously reported for the c-MYC gene, these results
indicate that the exogenous MBP-1 protein negatively affects
ERBB2 expression at both the mRNA and protein levels.
MBP-1 represses the transcriptional activity of the ERBB2
promoter
To address the question of whether MBP-1 plays a regulatory role in controlling the transcription of the ERBB2 gene,
the transcriptional activity of the promoter and 50-flanking
sequences were tested in SKBr3 cells overexpressing exogenous MBP-1. We generated deletion mutants of the
human ERBB2 promoter region, extending up to 0.7 kb
from the transcription start site, and inserted them in a
luciferase reporter vector. The derived plasmids, named
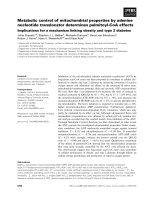
pG-E300, pG-E500 and pG-E700 (Figure 2A), were transiently cotransfected into SKBr3 cells with the effector plasmid expressing Flag-MBP-1 or with the empty pFlag-CMV
vector as a negative control. As shown in Figure 2B,
luciferase activity in cells cotransfected with either the pGE500 or pG-E700 construct and Flag-MBP-1 exhibited
markedly lower luciferase activities compared to cells
transfected with the control vector. Furthermore, the decrease in luciferase activity was proportional to the amount
of Flag-MBP-1 plasmid transfected.
Activity of the pG-E300 reporter plasmid, which was
10−13 times greater than the activity obtained in the
presence of the promoterless construct pGL3-basic, was
unaffected by MPB-1 expression.
These results indicate that the region between nucleotide −514 and −262 of the ERBB2 proximal promoter
Contino et al. BMC Cancer 2013, 13:81
/>
Page 5 of 12
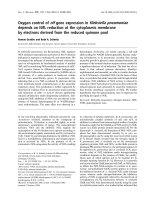
Figure 1 MBP-1 negatively regulates ERBB2 and c-MYC expression in SKBr3 breast cancer cells. (A) Quantitative analysis of endogenous cMYC and ERBB2 transcripts by qRT–PCR. SKBr3 cells were transfected with either a vector expressing MBP-1 (pFlag-MBP-1) or an empty vector
(mock) and analyzed 48 hrs after transfection. Histograms show fold changes in the expression of c-MYC and c-ERBB2 mRNA after normalization
with TBP. Each data point is the average of at least three independent transfection experiments, bars represent standard deviation and p values
(* P< 0.05, ** P<0.005) indicate statistical significance. (B) Western blot analysis of myc and ErbB2 proteins in SKBr3 cells overexpressing Flag-MBP
-1 and in the mock control. Both mRNA and protein levels were reduced in transfected cells. (C) Representative confocal microscopy images
showing the intracellular localization of endogenous ErbB2 protein and either ectopically-expressed Flag-MBP-1 or GFP protein. After transfection,
SkBr3 cells expressing Flag-MBP-1 were double-stained with mouse anti-ErbB2 and rabbit anti-Flag antibodies (panels a-c), GFP-expressing cells
were single-stained with anti-ErbB2 primary antibodies (panels d-f). Right panels show the merged image of the middle and left panels. Scale bar,
25 um. For supplementary images, see Additional file 2.
contains cis-acting sequences responsible for the transcriptional repression exerted by MBP-1. Indeed, nucleotide sequence analysis of the ERBB2 promoter revealed
the presence of several A/T-rich elements that may
function as putative binding sites for MBP-1 [7]. Three
of these are located between nucleotide −514 and −262
(Figure 2A and Additional file 3: Figure S2).
MBP-1 binds to the ERBB2 promoter in vivo
The results of the functional reporter analysis and in
silico observations prompted us to further investigate
putative interactions between cis-regulatory elements in
the ERBB2 promoter and the MBP-1 protein using
in vivo chromatin-immunoprecipitation (ChIP). Sheared
chromatin from Flag-MBP-1-expressing SKBR3 cells was
immunoprecipitated either with anti-Flag antibodies or
unrelated IgG as a negative control. Genomic DNA was
analyzed by PCR using three oligonucleotide pairs
(ERP1/2, ERP3/4 and ERP5/7) that amplify three overlapping fragments spanning a 564-bp region from nucleotide −520 to +44 of the ERBB2 promoter (see
Additional file 3: Figure S2 and Additional file 1: Table
S1 for details, respectively). As positive and negative
controls, we used primers directed at the c-MYC P2
Contino et al. BMC Cancer 2013, 13:81
/>
Page 6 of 12
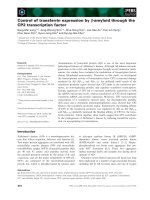
Figure 2 MBP-1 represses ERBB2 promoter activity. (A) Schematic representation of ERBB2 exon-1 (black box) and 50-flanking region. The TATAbox, the major transcriptional start site (+1), the position of relevant restriction sites and the location of A/T-rich sequences (gray boxes) are
indicated. The numbers refer to the major transcription start site according to NCBI Ref Seq NG_007503.1. Sequences amplified by the three
primer sets used in ChiP-qPCR assays are underlined. The schematic structures of the reporter plasmids, containing fragments of the human
ERBB2 promoter upstream of the firefly luciferase gene, are shown below (see Additional file 1: Table S1 for details). (B) Functional analysis of the
ERBB2 promoter in SkBr3 cells. Cells were transiently cotransfected with each reporter plasmid and two different amounts of the vector
expressing Flag-MBP-1 (3.5 or 7.5 μg) or with the highest amount of the empty vector pFlag-CMV (7.5 ug). Values of luciferase activity, corrected
for transfection efficiency, are expressed relative to the activity obtained with the pGL3-basic plasmid to which was assigned the value of 1. Each
data point is the average of at least three independent experiments and the error bars represent SD.
promoter region (MP3/4) containing the TATA-box, a
known binding site of MBP-1 [7,9], and a primer set
targeted at an unrelated region of the c-MYC gene (MD)
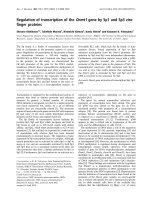
(see Additional file 1: Table S1). As shown in Figure 3A,
the anti-Flag-immunoprecipitated chromatin yielded cMYC-specific as well as ERBB2-specific PCR products
(ERP1/2 and ERP3/4 primers). No enrichment was
observed with ERP5/7 primers which amplify the ERBB2
promoter region containing the TATA-box, which
supports the lack of MBP-1-mediated repression we
observed with the pG-300 luciferase reporter plasmid
(see Figure 2B).
To further confirm specificity and to gain quantitative
information about the DNA fold-enrichment in the
immunoprecitated samples, we performed real-time PCR
analysis. As shown in Figure 3B, ERBB2 and c-MYC genomic DNA were significantly enriched in anti-Flag
precipitated samples compared to the IgG controls, at
least 0.02% with respect to the ChIP input DNA. ERBB2specific primer sets ERP1/2 and ERP3/4 gave a statistically
significant enrichment; however, the pair amplifying the
larger fragment (ERP3/4) yielded a greater percentage,
suggesting the presence of more than one functional site
for MBP-1 in the target region or, alternatively, a more efficient amplification.
In vivo recruitment of HDAC1 to the ERBB2 promoter
In light of the previously described interaction of HDAC1
with MBP-1 [18], we investigated the in vivo recruitment
of both proteins to ERBB2 and c-MYC promoters. As a
control, lysates of mock- and pFlag-MBP-1-transfected
SKBr3 cell were analyzed by Western blot to monitor the
relative expression of exogenous MBP-1 and endogenous
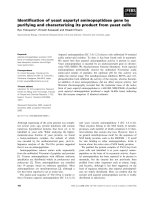
HDAC1 protein. No significant variation in the HDAC1
protein level was observed in the presence of exogenous
MBP-1 (Figure 4A).
Contino et al. BMC Cancer 2013, 13:81
/>
Page 7 of 12
less ERBB2 and c-MYC promoter sequences compared to
mock-transfected cells (Figure 4D).
Taken together, these results demonstrate that MBP-1
binds to both ERBB2 and c-MYC promoters in vivo and
indicate a possible involvement of HDAC1 in the transcriptional repression of the ERBB2 gene; in addition,
our data support previous observations suggesting that
MBP-1-mediated repression of the c-MYC promoter
may involve the interplay of other specific cofactors besides HDAC1 [18].
HDAC1 and MBP-1 expression in breast IDC
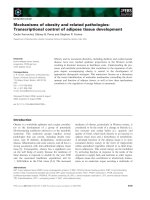
Figure 3 MBP-1 interacts in vivo with ERBB2 and c-MYC
promoters. (A) Identification of in vivo binding regions for MBP-1.
DNA of input and immunoprecipitated chromatin samples was
amplified using primers directed to the ERBB2 promoter region
(ERP1/2, ERP2/3 and ERP5/7); primers targeted to the c-MYC P2
promoter (MP3/4) as a positive control; and primers directed to an
unrelated region of the c-MYC gene (MD). Numbers indicate the
length of the amplified DNA fragments. Reactions in absence of input
DNA were included as negative controls (n.c.). (B) Quantification of
immunoprecipitated chromatin by real-time PCR. The amount of
immunoprecipitated DNA was calculated relative to that present in
total input chromatin (% input). Gene-specific PCR detected in vivo
binding of MBP-1 to both ERBB2 and c-MYC promoters. Each data
point is the average of triplicates from three independent ChIP
experiments ± SD and p values (* P< 0.05, § P<0.01) indicate statistical
significance.
Chromatin from Flag-MBP-1-expressing SKBR3 cells
and mock control was immunoprecipitated with either
anti-Flag or anti-HDAC1 antibodies, and genomic DNA
was analyzed using specific oligonucleotide pairs. As
shown in Figure 4B, both antibodies yielded ERBB2-specific
and c-MYC-specific PCR products; however, quantitative
PCR analysis of HDAC-1-immunoprecipitated chromatin
indicated a much greater enrichment of ERBB2 than the cMYC promoter sequences in the presence of exogenous
Flag-MBP-1 (Figure 4C).
As a further control, chromatin was also immunoprecipitated with anti-acetylated histone H4 (AcH4)
antibodies. AcH4 is considered a hallmark of active transcription [26]. As expected for the negative role of MBP-1
on transcription, the AcH4-enriched chromatin samples
from Flag-MBP-1-transfected cells yielded about 3 times
The results reported above on the functional role
exerted by MBP-1 in the negative transcriptional control
of ERBB2 promoter support the inverse correlation we
previously found between MBP-1 and ErbB2 expression
levels in primary breast tumors [23]. Moreover, the potential involvement of HDAC1 in the ERBB2 promoter
transcriptional repression is in agreement with previous
studies associating HDAC1 expression with breast cancer progression and survival [27-29]. Seeking new
insights, we analyzed MBP-1 and HDAC1 protein levels
in total lysates from a set of primary IDCs and the
paired normal breast tissue samples. A representative
immunoblot analysis is shown in Figure 5A. Most of the
normal breast tissue showed a concomitant higher expression of MBP-1 and HDAC1 than the paired tumor
samples. Comparison of HDAC1 expression in normal
tissues (n=20) and in MBP-1-positive (n=14) and MBP-1
negative (n=16) primary IDCs indicated that HDAC1 expression was significantly higher in MBP-1-positive
compared to MBP-1-negative tumors (4.3 fold, p=0.001),
whereas no significant difference was observed between
MBP-1-positive tumors and normal tissues (Figure 5B).
Given that no significant variation in the HDAC1 protein level was observed in SkBr3 cells transiently
overexpressing MBP-1 (Figure 4A), we may exclude a
direct positive role of MBP-1 on HDAC1 protein expression and/or stabilization.
To further investigate MBP-1 and HDAC1 expression
and localization and to correlate their expression to
ErbB2 status, we analyzed a total of 45 primary IDCs by
immunohistochemistry (IHC), including the adjacent
normal breast tissue in almost every case (41 out of 45).
As expected, HDAC1 gave a nuclear staining in all the
samples, whereas MBP-1 nuclear staining was observed in
almost all the normal tissue but in only 22/45 tumors
(48%). Figure 5C shows a representative MBP-1, HDAC1
and ErbB2 serial section staining of normal tissue, MBP1-positive (T #995) and MBP-1-negative (T #389) tumors.
In summary, strong HDAC1 and MBP-1 nuclear staining
was observed in normal tissues (panels a, b); strong to
moderate HDAC1 and MBP-1 nuclear reactivity was
detected in ErbB2-negative tumors (panels d, e, f),
Contino et al. BMC Cancer 2013, 13:81
/>
Page 8 of 12
Figure 4 In vivo recruitment of MBP-1 and HDAC1 proteins to ERBB2 and c-MYC promoters. (A) Immunoblot analysis of SKBr3 cells
transfected with pFlag-MBP-1 or mock-transfected using anti-Flag, anti-HDAC1 and anti-beta-actin antibodies. (B) MBP-1 and HDAC1 occupancy
at ERBB2 and c-MYC promoter DNA of input and immunoprecipitated chromatin samples was amplified using primers directed to ERBB2
promoter (ERP2/3), to c-MYC. P2 promoter (MP3/4) and primers directed to an unrelated region of the c-MYC gene (MD). (C, D) Quantification by
real-time PCR of chromatin immunoprecipitated with anti-HDAC1 and anti-AcH4 antibodies. The amount of immunoprecipitated DNA was
calculated relative to that present in total input chromatin (% input). Each data point is the average of triplicates from three independent ChIP
experiments ± SD, p value (* P<0.01) indicate statistical significance.
whereas low nuclear staining was detected in ErbB2positive tumors (panels g, h, i). These IHC results are in
agreement with what was observed by Western blot
(Figure 5B), and statistical data analysis indicated the existence of a highly significant correlation between MBP-1
and HDAC1 expression in tumors (p<0.0001), with a
Spearman rank correlation coefficient equal to 0.714
(Figure 6A). On the other hand, ERBB2 expression
negatively correlated with both MBP-1 and HDAC1
protein expression (p = 0.031 for MBP-1 and 0.037
for HDAC1), with Spearman rank correlation coefficients
equal to −0.278 and −0.267, respectively (Figure 6B, C).
Although these negative correlations with ErbB2 status
are weak, likely because of the limited number of samples,
they still support the hypothesis of a negative regulatory
network linking MBP-1 and HDAC1 to ERBB2 expression
in breast IDC.
Discussion
In this study, we provide novel observations regarding
the transcriptional control of the ERBB2 gene in SKBr3
breast cancer cells. The human ERBB2 gene is frequently
amplified in breast tumors, and its high expression is
associated with poor prognosis. However, substantial
evidence suggests that the increased level of ERBB2
mRNA depends on active gene transcription in addition
to gene amplification [30]. Several positive and negative
regulatory elements have been characterized in the
ERBB2 gene proximal promoter as well as in the 50flanking sequence up to 6 kb and in the first intron
[31-34]. Altogether, these studies indicate the involvement
of several factors regulating ERBB2 gene transcription in
breast cancer cells. Among positive regulators, members
of the AP-2 and Ets families of transcription factors are
required for maximal ERBB2 promoter activity and have
been associated with the overexpression of the gene in
breast cancer (for a review, see [35]); in addition, the
multifunctional transcription factor YY1 has been
shown to cooperate with AP-2 to stimulate ERBB2
promoter activity through the AP-2 binding sites [36].
Other transcription factors have been identified as negative regulators of ERBB2 expression in breast cancer (for a
review, see [37]): e.g., PEA3, an Ets DNA-binding protein
that targets a DNA motif in the ERBB2 gene promoter
[38]; FOXP3, an X-linked breast cancer tumor suppressor
which represses the transcription of the ERBB2 gene by
interacting with forkhead DNA-binding motifs in the
promoter [39]; the zinc-finger transcription factor
Contino et al. BMC Cancer 2013, 13:81
/>
Page 9 of 12
Figure 5 Expression of MBP-1 and HDAC1 in primary breast tumors and adjacent normal tissues. (A) Representative Western blot analysis of
HDAC1, MBP-1 and beta-actin proteins in breast tumors (T) and paired normal tissues (N). (B) HDAC1 protein expression levels in normal versus
breast cancer tissues. Proteins were analyzed by immunoblotting and data normalized with respect to beta-actin. The Box plot represents the
HDAC1/beta-actin ratio determined in 20 normal tissue (normal), 14 MBP-1-positive (+ve) and 16 MBP-1-negative (−ve) breast tumors. HDAC1
protein levels were associated with MBP-1 status, with a statistically significant enrichment in MBP-1-positive IDCs (4.3 fold, p<0.001). Bars above
and below the boxes represent the maximum and minimum expression. Each box delineates the first to third quartiles of expression, and the
central bar represents the median. (C) Representative immunohistochemical staining of normal mammary tissue (a-c), MBP-1-positive (#995) and
MBP-1-negative (#389) IDC tumors (d-f and g-i, respectively). HDAC1 and MBP-1 nuclear staining in normal tissues (panels a, b) and tumors
(panels d, e) correlated with undetectable ErbB2 expression (panels c, f). Magnification: 300x.
GATA4, part of a negative feedback regulatory loop
with the ERBB2 gene [40]. Although the functional
relationships between positive and negative transacting
factors still remain largely unexplored, overall, these data
illustrate the complexity of ERBB2 gene transcriptional
control.
In this context, we report that the c-MYC gene repressor MBP-1 negatively regulates ERBB2 gene transcription in SKBr3 breast cancer cells by targeting regulatory
sequences in the promoter region. Through chromatin
immunoprecipitation, we have located the MBP-1 binding region between nucleotide −514 and −262, relative
to the major transcriptional start site of the ERBB2 gene,
and demonstrated the concomitant recruitment of
HDAC1 to the same region. Furthermore, our ChIP
assays have indicated a decreased AcH4 occupancy at
the same ERBB2 promoter region targeted by MBP-1
and HDAC1, suggesting a regulatory role for HDAC1 in
MBP-1 repression activity, although we cannot exclude
the involvement of other HDAC family members.
Contino et al. BMC Cancer 2013, 13:81
/>
Figure 6 Correlations between MBP-1, HDAC1 and ErbB2 protein
expression in primary breast tumors. Correlation plot for MBP-1
versus HDAC1 (A), MBP-1 versus ErbB2 (B) and HDAC1 versus ErbB2
(C) protein levels. Black squares and coloured triangles represent
expression values determined by immunohistochemical staining of
45 breast IDCs, as described in Materials and Methods. Blue lines
represent the linear regression, dotted lines the 95% CI. The
coefficient of correlation (r) was determined and its statistical
significance was tested using the nonparametric Spearman rank
correlation test.
HDAC1 has positive and negative effects on gene transcription [41] and, like all the HDACs, lacks a DNA-binding
domain; thus, it must be associated with a DNA-binding
protein in order to target a specific chromatin region
(reviewed in [42]). For example, to repress transcription,
HDAC1 interacts with the transcription factor E2F in a
complex containing BRM, BRG1, and SUV39H1 [43].
Page 10 of 12
Ghosh et al. previously demonstrated that MBP-1 physically
associates with HDAC1 in vitro and in vivo, although the
MBP-1-mediated repression of the c-MYC P2 promoter
seems to be independent of HDAC1 [18]. Our results support this previous observation concerning the c-MYC promoter and, conversely, suggest that MBP-1 represses ERBB2
gene transcription by recruiting the HDAC1 protein to its
promoter. Therefore, MBP-1-mediated transcriptional repression may occur through different mechanisms, likely depending on the chromatin structure and the nucleotide
sequence of the promoter. MBP-1 can block the assembly of
the basal transcription complex by competing with TBP, as
reported for the c-MYC P2 promoter [7], or it may bind the
promoter regulatory sequences and recruit HDAC1, as we
suggest here, for the ERBB2 gene. The differences we
observed in the recruitment of HDAC1 to ERBB2 and the
c-MYC P2 promoter strongly support this last hypothesis.
Overall, our data suggest the existence of a novel transcriptional regulatory network that modulates ERBB2 expression, though detailed investigations using different
cellular models are needed to dissect this network and define the molecular mechanisms underlying MBP-1/HDAC1mediated transcriptional repression of the ERBB2 gene in
breast cancer.
We also report a significant inverse correlation between
ERBB2 expression and both MBP-1 (r= −0.278, p= 0.031)
and HDAC1 (r= −0.267, p= 0.037) protein levels in primary breast tumors, and, accordingly, we propose MBP-1
/HDAC1/ERBB2 relative expression as a diagnostic
marker in breast IDC. Our results are in agreement with
previous observations that have associated the reduction
of HDAC1 transcript and protein levels with progression
from normal mammary epithelium to ductal carcinoma in
situ (DCIS) and to IDC [27-29].
Furthermore, it has been independently reported that the
expression of either MBP-1 or HDAC1 is a predictor of
good disease-free survival, and both proteins are independent prognostic factors in breast cancer patients [23,29].
Despite the limited number of patients examined in this
study, the significant positive correlation we observed between MBP-1 and HDAC1 expression in ErbB2-negative
IDC suggests that their concomitant high expression may
have a stronger diagnostic and prognostic significance in
this tumor subtype.
Conclusions
In summary, we have identified ERBB2 as a novel target
gene of MBP-1. We demonstrate that MBP-1 negatively
controls ERBB2 expression in SKBr3 breast cancer cells
and suggest a role for HDAC1 in this regulatory mechanism. We show for the first time that a concomitant high
expression of MBP-1 and HDAC1 inversely correlates
with ERBB2 expression in primary breast tumors.
Contino et al. BMC Cancer 2013, 13:81
/>
The data presented here provide the basis for future
studies involving a larger number of patients with a long
follow-up period to further elucidate the functional
and prognostic relevance of MBP-1 and HDAC1 in
breast cancer.
Page 11 of 12
3.
4.
5.
6.
Additional files
Additional file 1: Table S1. List of gene-specific oligonucleotides used
in this study.
Additional file 2: Figure S1. Immunofluorescence microscopy images
showing intracellular localization of endogenous ErbB2 and either ectopically
expressed MBP-1 or GFP protein. Human SKBr3 cancer cells transiently
expressing either Flag-MBP-1 or GFP protein (upper and lower panels,
respectively) were fixed, permeabilized and double-stained with antiErBB2 and anti-Flag antibody or single-stained with anti-ErbB2, as
indicated. Nuclei were stained with DAPI. Spatial distribution was
visualized by light microscopy as described in Materials and Methods.
The colour merged images show the loss of ErbB2 membrane staining in
MBP-1-expressing cells (upper panel). Scale bar, 25 um.
Additional file 3: Figure S2. Nucleotide sequence of the human ERBB2
promoter and upstream regions. The nucleotide sequence is numbered
with the major transcription start site designated as + 1 (according to
NCBI RefSeq: NG_007503.1). Positions of relevant restriction sites are
indicated and A/T-rich elements are boxed. Arrows indicate the position
of oligonucleotides used for the construction of the ERBB2-luciferase
reporter plasmids and for ChIP-qPCR assays (see Additional file 1).
Competing interests
The authors declare that they have no competing interests.
Authors’ contributions
Conceived and designed the experiments: FC CM ER AG SF. Performed the
experiments: FC CM AF MLP CL GP. Analyzed the data: FC CM ER AG SF.
Contributed reagents/materials/analysis tools: FC CM CL GP AG SF. Wrote the
paper: FC AG SF. All authors read and approved the final manuscript.
Authors’ information
Agata Giallongo and Salvatore Feo share senior co-authorship.
7.
8.
9.
10.
11.
12.
13.
14.
15.
16.
17.
18.
Acknowledgements
Special thanks are due to Patrizia Rubino for her excellent technical
assistance. We thank Valeria Militello and Valeria Vetri for help in the confocal
analysis, and Paola Migliorini for providing the anti-alpha-enolase
monoclonal antibodies. This work was supported by grants from Ministero
dell’Università e della Ricerca (FIRB-MERIT n. RBNE08YYBM) to S.F. and A.G.,
Università degli Studi di Palermo (n. ORPA07Z77R) to S.F., and by a grant
from the Italian Ministry of Economy and Finance to the CNR for the Project
FaReBio di Qualità to A.G.
19.
20.
21.
Author details
1
Dipartimento di Scienze e Tecnologie Molecolari e Biomolecolari, Università
di Palermo, Viale delle Scienze, Ed. 16, Palermo I-90128, Italy. 2Istituto di
Biomedicina e Immunologia Molecolare, CNR, Via Ugo La Malfa, 153, Palermo
I-90146, Italy. 3Unità di Anatomia Patologica, Dipartimento Oncologico di III
livello La Maddalena, Palermo, Italy.
Received: 1 October 2012 Accepted: 28 January 2013
Published: 19 February 2013
References
1. Hynes NE, MacDonald G: ErbB receptors and signaling pathways in
cancer. Curr Opin Cell Biol 2009, 21(2):177–184.
2. Sears R, Nuckolls F, Haura E, Taya Y, Tamai K, Nevins JR: Multiple Rasdependent phosphorylation pathways regulate Myc protein stability.
Genes Dev 2000, 14(19):2501–2514.
22.
23.
24.
25.
Hynes NE, Lane HA: ERBB receptors and cancer: the complexity of
targeted inhibitors. Nat Rev Cancer 2005, 5(5):341–354.
Neve RM, Sutterluty H, Pullen N, Lane HA, Daly JM, Krek W, Hynes NE:
Effects of oncogenic ErbB2 on G1 cell cycle regulators in breast tumour
cells. Oncogene 2000, 19(13):1647–1656.
Hynes NE, Stoelzle T: Key signalling nodes in mammary gland
development and cancer: Myc. Breast Cancer Res 2009, 11(5):210.
Ray R, Miller DM: Cloning and characterization of a human c-myc
promoter-binding protein. Mol Cell Biol 1991, 11(4):2154–2161.
Chaudhary D, Miller DM: The c-myc promoter binding protein (MBP-1)
and TBP bind simultaneously in the minor groove of the c-myc P2
promoter. Biochemistry 1995, 34(10):3438–3445.
Subramanian A, Miller DM: Structural analysis of alpha-enolase. Mapping
the functional domains involved in down-regulation of the c-myc
protooncogene. J Biol Chem 2000, 275(8):5958–5965.
Feo S, Arcuri D, Piddini E, Passantino R, Giallongo A: ENO1 gene product binds
to the c-myc promoter and acts as a transcriptional repressor: relationship
with Myc promoter-binding protein 1 (MBP-1). FEBS Lett 2000, 473(1):47–52.
Lung J, Liu KJ, Chang JY, Leu SJ, Shih NY: MBP-1 is efficiently encoded by an
alternative transcript of the ENO1 gene but post-translationally regulated
by proteasome-dependent protein turnover. FEBS J 2010, 277(20):4308–4321.
Ray RB, Steele R, Seftor E, Hendrix M: Human breast carcinoma cells
transfected with the gene encoding a c-myc promoter-binding protein
(MBP-1) inhibits tumors in nude mice. Cancer Res 1995, 55(17):3747–3751.
Ejeskar K, Krona C, Caren H, Zaibak F, Li L, Martinsson T, Ioannou PA:
Introduction of in vitro transcribed ENO1 mRNA into neuroblastoma
cells induces cell death. BMC Cancer 2005, 5:161.
Ghosh AK, Steele R, Ryerse J, Ray RB: Tumor-suppressive effects of MBP-1
in non-small cell lung cancer cells. Cancer Res 2006, 66(24):11907–11912.
Pal P, Kanaujiya JK, Lochab S, Tripathi SB, Bhatt ML, Singh PK, Sanyal S,
Trivedi AK: 2-D gel electrophoresis-based proteomic analysis reveals that
ormeloxifen induces G0-G1 growth arrest and ERK-mediated apoptosis
in chronic myeloid leukemia cells K562. Proteomics 2011, 11(8):1517–1529.
Trojanowicz B, Winkler A, Hammje K, Chen Z, Sekulla C, Glanz D, Schmutzler
C, Mentrup B, Hombach-Klonisch S, Klonisch T, et al: Retinoic acidmediated down-regulation of ENO1/MBP-1 gene products caused
decreased invasiveness of the follicular thyroid carcinoma cell lines.
J Mol Endocrinol 2009, 42(3):249–260.
Hsu KW, Hsieh RH, Wu CW, Chi CW, Lee YH, Kuo ML, Wu KJ, Yeh TS: MBP-1
suppresses growth and metastasis of gastric cancer cells through COX-2.
Mol Biol Cell 2009, 20(24):5127–5137.
Ghosh AK, Majumder M, Steele R, White RA, Ray RB: A novel 16-kilodalton
cellular protein physically interacts with and antagonizes the functional
activity of c-myc promoter-binding protein 1. Mol Cell Biol 2001, 21(2):655–662.
Ghosh AK, Steele R, Ray RB: MBP-1 physically associates with histone
deacetylase for transcriptional repression. Biochem Biophys Res Commun
1999, 260(2):405–409.
Perconti G, Ferro A, Amato F, Rubino P, Randazzo D, Wolff T, Feo S,
Giallongo A: The kelch protein NS1-BP interacts with alpha-enolase/MBP1 and is involved in c-Myc gene transcriptional control. Biochim Biophys
Acta 2007, 1773(12):1774–1785.
Hsu KW, Hsieh RH, Lee YH, Chao CH, Wu KJ, Tseng MJ, Yeh TS: The
activated Notch1 receptor cooperates with alpha-enolase and MBP-1 in
modulating c-myc activity. Mol Cell Biol 2008, 28(15):4829–4842.
Sedoris KC, Thomas SD, Miller DM: c-myc promoter binding protein
regulates the cellular response to an altered glucose concentration.
Biochemistry 2007, 46(29):8659–8668.
Sedoris KC, Thomas SD, Miller DM: Hypoxia induces differential translation
of enolase/MBP-1. BMC Cancer 2010, 10:157.
Lo Presti M, Ferro A, Contino F, Mazzarella C, Sbacchi S, Roz E, Lupo C,
Perconti G, Giallongo A, Migliorini P, et al: Myc promoter-binding protein-1
(MBP-1) is a novel potential prognostic marker in invasive ductal breast
carcinoma. PLoS One 2010, 5(9):e12961.
Antona V, Cammarata G, De Gregorio L, Dragani TA, Giallongo A, Feo S: The
gene encoding the transcriptional repressor BERF-1 maps to a region of
conserved synteny on mouse chromosome 16 and human chromosome
3 and a related pseudogene maps to mouse chromosome 8. Cytogenet
Cell Genet 1998, 83(1–2):90–92.
Carramusa L, Contino F, Ferro A, Minafra L, Perconti G, Giallongo A, Feo S:
The PVT-1 oncogene is a Myc protein target that is overexpressed in
transformed cells. J Cell Physiol 2007, 213(2):511–518.
Contino et al. BMC Cancer 2013, 13:81
/>
26. Jenuwein T, Allis CD: Translating the histone code. Science 2001,
293(5532):1074–1080.
27. Zhang Z, Yamashita H, Toyama T, Sugiura H, Ando Y, Mita K, Hamaguchi M,
Hara Y, Kobayashi S, Iwase H: Quantitation of HDAC1 mRNA expression in
invasive carcinoma of the breast*. Breast Cancer Res Treat 2005,
94(1):11–16.
28. Suzuki J, Chen YY, Scott GK, Devries S, Chin K, Benz CC, Waldman FM,
Hwang ES: Protein acetylation and histone deacetylase expression
associated with malignant breast cancer progression. Clin Cancer Res
2009, 15(9):3163–3171.
29. Krusche CA, Wulfing P, Kersting C, Vloet A, Bocker W, Kiesel L, Beier HM,
Alfer J: Histone deacetylase-1 and −3 protein expression in human
breast cancer: a tissue microarray analysis. Breast Cancer Res Treat 2005,
90(1):15–23.
30. Bofin AM, Ytterhus B, Martin C, O’Leary JJ, Hagmar BM: Detection and
quantitation of HER-2 gene amplification and protein expression in
breast carcinoma. Am J Clin Pathol 2004, 122(1):110–119.
31. Vernimmen D, Gueders M, Pisvin S, Delvenne P, Winkler R: Different
mechanisms are implicated in ERBB2 gene overexpression in breast and
in other cancers. Br J Cancer 2003, 89(5):899–906.
32. Delacroix L, Begon D, Chatel G, Jackers P, Winkler R: Distal ERBB2 promoter
fragment displays specific transcriptional and nuclear binding activities
in ERBB2 overexpressing breast cancer cells. DNA Cell Biol 2005,
24(9):582–594.
33. Grooteclaes M, Pasleau F, Dijkmans H, Berzi P, Albert A, Winkler-Gol R: The
6-kilobase c-erbB2 promoter contains positive and negative regulatory
elements functional in human mammary cell lines. Cancer Res 1994,
54(15):4193–4199.
34. Bates NP, Hurst HC: An intron 1 enhancer element mediates oestrogeninduced suppression of ERBB2 expression. Oncogene 1997, 15(4):473–481.
35. Hurst HC: Update on HER-2 as a target for cancer therapy: the ERBB2
promoter and its exploitation for cancer treatment. Breast Cancer Res
2001, 3(6):395–398.
36. Begon DY, Delacroix L, Vernimmen D, Jackers P, Winkler R: Yin Yang 1
cooperates with activator protein 2 to stimulate ERBB2 gene expression
in mammary cancer cells. J Biol Chem 2005, 280(26):24428–24434.
37. Birnbaum D, Sircoulomb F, Imbert J: A reason why the ERBB2 gene is
amplified and not mutated in breast cancer. Cancer Cell Int 2009, 9:5.
38. Xing X, Wang SC, Xia W, Zou Y, Shao R, Kwong KY, Yu Z, Zhang S, Miller S,
Huang L, et al: The ets protein PEA3 suppresses HER-2/neu
overexpression and inhibits tumorigenesis. Nat Med 2000, 6(2):189–195.
39. Zuo T, Wang L, Morrison C, Chang X, Zhang H, Li W, Liu Y, Wang Y, Liu X,
Chan MW, et al: FOXP3 is an X-linked breast cancer suppressor gene and
an important repressor of the HER-2/ErbB2 oncogene. Cell 2007,
129(7):1275–1286.
40. Hua G, Zhu B, Rosa F, Deblon N, Adelaide J, Kahn-Perles B, Birnbaum D,
Imbert J: A negative feedback regulatory loop associates the tyrosine
kinase receptor ERBB2 and the transcription factor GATA4 in breast
cancer cells. Mol Cancer Res 2009, 7(3):402–414.
41. Zupkovitz G, Tischler J, Posch M, Sadzak I, Ramsauer K, Egger G,
Grausenburger R, Schweifer N, Chiocca S, Decker T, et al: Negative and
positive regulation of gene expression by mouse histone deacetylase 1.
Mol Cell Biol 2006, 26(21):7913–7928.
42. Yang XJ, Seto E: The Rpd3/Hda1 family of lysine deacetylases: from
bacteria and yeast to mice and men. Nat Rev Mol Cell Biol 2008,
9(3):206–218.
43. Giacinti C, Giordano A: RB and cell cycle progression. Oncogene 2006,
25(38):5220–5227.
doi:10.1186/1471-2407-13-81
Cite this article as: Contino et al.: Negative transcriptional control of
ERBB2 gene by MBP-1 and HDAC1: diagnostic implications in breast
cancer. BMC Cancer 2013 13:81.
Page 12 of 12
Submit your next manuscript to BioMed Central
and take full advantage of:
• Convenient online submission
• Thorough peer review
• No space constraints or color figure charges
• Immediate publication on acceptance
• Inclusion in PubMed, CAS, Scopus and Google Scholar
• Research which is freely available for redistribution
Submit your manuscript at
www.biomedcentral.com/submit