Salinomycin induces cell death and differentiation in head and neck squamous cell carcinoma stem cells despite activation of epithelial-mesenchymal transition and Akt
Bạn đang xem bản rút gọn của tài liệu. Xem và tải ngay bản đầy đủ của tài liệu tại đây (1.24 MB, 14 trang )
Kuo et al. BMC Cancer 2012, 12:556
/>
RESEARCH ARTICLE
Open Access
Salinomycin induces cell death and differentiation
in head and neck squamous cell carcinoma stem
cells despite activation of epithelial-mesenchymal
transition and Akt
Selena Z Kuo1†, Katherine J Blair1†, Elham Rahimy1†, Alan Kiang1, Eric Abhold1, Jian-Bing Fan2,
Jessica Wang-Rodriguez3, Xabier Altuna4 and Weg M Ongkeko1*
Abstract
Background: Cancer stem cells (CSC) are believed to play a crucial role in cancer recurrence due to their resistance
to conventional chemotherapy and capacity for self-renewal. Recent studies have reported that salinomycin, a
livestock antibiotic, selectively targets breast cancer stem cells 100-fold more effectively than paclitaxel. In our study
we sought to determine the effects of salinomycin on head and neck squamous cell carcinoma (HNSCC) stem cells.
Methods: MTS and TUNEL assays were used to study cell proliferation and apoptosis as a function of salinomycin
exposure in JLO-1, a putative HNSCC stem cell culture. MTS and trypan blue dye exclusion assays were performed
to investigate potential drug interactions between salinomycin and cisplatin or paclitaxel. Stem cell-like phenotype
was measured by mRNA expression of stem cell markers, sphere-forming capacity, and matrigel invasion assays.
Immunoblotting was also used to determine expression of epithelial-mesenchymal transition (EMT) markers and Akt
phosphorylation. Arrays by Illumina, Inc. were used to profile microRNA expression as a function of salinomycin
dose.
Results: In putative HNSCC stem cells, salinomycin was found to significantly inhibit cell viability, induce a 71.5%
increase in levels of apoptosis, elevate the Bax/Bcl-2 ratio, and work synergistically with cisplatin and paclitaxel in
inducing cell death. It was observed that salinomycin significantly inhibited sphere forming-capability and repressed
the expression of CD44 and BMI-1 by 3.2-fold and 6.2-fold, respectively. Furthermore, salinomycin reduced invasion
of HNSCC stem cells by 2.1 fold. Contrary to expectations, salinomycin induced the expression of EMT markers Snail,
vimentin, and Zeb-1, decreased expression of E-cadherin, and also induced phosphorylation of Akt and its
downstream targets GSK3-β and mTOR.
Conclusions: These results demonstrate that in HNSCC cancer stem cells, salinomycin can cause cell death and
decrease stem cell properties despite activation of both EMT and Akt.
Keywords: Salinomycin, Cancer stem cells, Head and neck squamous cell carcinoma, Akt, EMT, microRNA
* Correspondence:
†
Equal contributors
1
Division of Otolaryngology-Head and Neck Surgery, Department of Surgery,
University of California, San Diego, San Diego, CA, USA
Full list of author information is available at the end of the article
© 2012 Kuo et al.; licensee BioMed Central Ltd. This is an Open Access article distributed under the terms of the Creative
Commons Attribution License ( which permits unrestricted use, distribution, and
reproduction in any medium, provided the original work is properly cited.
Kuo et al. BMC Cancer 2012, 12:556
/>
Background
Cancer stem cells (CSCs) are a unique subpopulation
within a tumor that have the ability to self-renew and
differentiate, making them responsible for initiating and
maintaining tumors [1-3]. One of the main threats of
CSCs is that they are resistant to conventional cancer
treatments including chemotherapy and radiotherapy.
Standard cancer treatments are effective in killing the
bulk of the tumor but spare the CSCs, thereby progressively increasing the fraction of CSCs in the tumor [4].
The mortality of cancer remains high because conventional therapies often fail to eradicate the CSC population, allowing relapse to occur. Therefore, a complete
cure for cancer likely involves treatments that can effectively eliminate CSCs along with the bulk of the tumor.
In a recent study, Gupta et al. used a high throughput
screening to identify drugs that could potentially be used
to target breast CSCs. By using a novel method of
screening, approximately 16,000 compounds were evaluated for their ability to eradicate breast CSCs. This
screening revealed that the compound salinomycin was
able to kill breast CSCs 100-fold more effectively than
paclitaxel [5]. Commonly, salinomycin is a monocarboxylic polyether antibiotic used to prevent coccidiosis
in poultry. As an antibiotic, salinomycin functions in different biological membranes as an ionophore with a high
specificity for potassium [6,7]. The antibiotic properties
of salinomycin are well known, but its potential to eradicate CSCs in other cancer types needs to be further
elucidated.
The epithelial-mesenchymal transition (EMT) has long
been linked to the invasive properties of cancer stem
cells. It is a key developmental process where immotile
epithelial cells acquire mesenchymal properties and display an increased motility. It is commonly characterized
by a down-regulation of E-cadherin, a critical cell-to-cell
adhesion molecule [8]. An induction of EMT is directly
associated with activation of the PI3K/Akt pathway, as
activation of Akt has been shown to down-regulate Ecadherin in part through stabilization of the transcriptional repressor Snail [9,10]. Akt is a serine/threonine
protein kinase that plays a central role in cell proliferation, growth, and survival. Akt is often found to be constitutively active in many forms of cancer, and is
responsible for the anti-apoptotic properties of carcinomas [11]. Glycogen synthase kinase-3 (GSK3-β) and
mTOR, two immediate downstream targets of Akt kinase activity, have previously been implicated as mediators of EMT [5,12-14].
Recent studies have shown that epithelial cells undergoing EMT acquire critical stem-cell characteristics such
as the ability to self-renew [15]. Furthermore, Gupta
et al. used EMT-induced breast cancer stem cells in the
screening that discovered salinomycin; breast cancer
Page 2 of 14
cells having undergone shRNA-mediated knock-down of
E-cadherin expression displayed an increased proportion
of CD44high/CD24low cells, increased resistance to chemotherapeutic drugs, and enhanced sensitivity to salinomycin [5]. Of particular significance in the context of
our study, Basu et al. demonstrated that salinomycin targets mesenchymal-like cell populations within advancedstage HNSCC. This mesenchymal subpopulation was
characterized as having elevated resistance to the EGFR
inhibitor cetuximab and the chemotherapeutic drugs
paclitaxel and cisplatin, thus demonstrating increased
drug resistance, a characteristic of cancer stem cells. The
observed resistance to cisplatin in vitro and in primarytumor derived xenografts was not present for salinomycin. [16].
The purpose of the present study was to extend our
understanding of salinomycin’s therapeutic properties in
head and neck squamous cell carcinoma (HNSCC) stem
cells. We aim to determine whether salinomycin, alone
and in combination with conventional chemotherapeutic
agents, effectively induces apoptosis in HNSCC stem
cells, and to further investigate its effects on cancer stem
cell properties including invasion, EMT, BMI-1 expression, CD44 expression and sphere formation. CD44 and
BMI-1 regulate self-renewal and have been established
as CSC markers in HNSCC [17]. In addition, the effect
of salinomycin on Akt signaling has not been previously
examined in any cancer type. The results of this study
demonstrate the ability of salinomycin to target head
and neck cancer stem cells, and further examines its
effects on EMT and Akt.
Methods
Ethics statement
Cultures used in this study (JLO-1) were derived in accordance with the policy and procedures of Hospital
Donosita, San Sebastion, Spain. Tissue was obtained anonymously and all data were analyzed anonymously
throughout the study, thus no patient consent was
obtained. Hospital Donostia, San Sebastian approved this
procurement of tissue including the waiver of consent.
Cell lines and cell cultures
JLO-1 is a putative cancer stem cell culture derived anonymously from a fresh laryngeal tumor of patients
undergoing resection of their cancer. Stem cell selective
cultivation conditions for JLO-1 have been described in
our previous study [18]. Briefly, flow cytometry was performed to select for CD44+ cells, which were then
grown on laminin-coated plates and cultured in keratinocyte serum-free media (Invitrogen, Carlsbad, CA)
containing 2 mM L-glutamine (Invitrogen), 50 μg/mL
gentamycin (Invitrogen), and 20 ng/mL EGF and FGF
(R&D Systems, Minneapolis, Minnesota) supplemented
Kuo et al. BMC Cancer 2012, 12:556
/>
daily. Cultures were incubated at 37°C in 5% O2 and
10% CO2.
The established HNSCC cell lines UMSCC-10B, HN1, and HN-30 were used in this study. UMSCC-10B was
a kind gift from Dr. Tom Carey, University of Michigan,
and HN-1 and HN-30 were gifts from Dr. J.S. Gutkind,
National Institute for Dental and Craniofacial Research.
Cell lines were routinely cultured in DMEM supplemented with 10% fetal bovine serum (FBS), 2% streptomycin
sulfate (Invitrogen), and 2% L-glutamine (Invitrogen),
and incubated at 37°C in 5% CO2 and 21% O2.
Chemicals and antibodies
Salinomycin was obtained from MP Biomedicals, LLC
(Solon, OH), and a 1 mM stock solution was prepared
in 100% ethanol. Prior to cell treatment, working concentrations of salinomycin were prepared in culture
media. Control groups were treated with an equal volume of ethanol vehicle. Cisplatin and paclitaxel were
purchased from Sigma-Aldrich (St. Louis, MO). Rabbit
polyclonal Bax, Rabbit polyclonal Bcl-2, Rabbit polyclonal p-Akt (Ser473), rabbit monoclonal vimentin
(D21H3) XP, rabbit monoclonal p-GSK3β (Ser9), rabbit
polyclonal p-mTOR (Ser2448), and rabbit polyclonal
total ERK antibodies were from Cell Signaling (Beverly,
MA). Rabbit polyclonal Snail antibody was obtained
from Abcam (Cambridge, MA).
Flow cytometry
Flow cytometry was used to confirm the CD44+ population of the putative head and neck cancer stem cell
population. Cells were trypsinized and incubated with
anti-human CD44-APC antibody (BD Biosciences) or a
non-specific IgG antibody as a negative control.
Cell proliferation assay
MTS assays were performed using the CellTiter 96 Aqueous non-radioactive cell proliferation assay (Promega,
Madison, WI). Cells were trypsinized, counted, and
replated into a 96-well plate at 5000 cells per well. Cells
were allowed to adhere overnight. To generate a dose–
response curve for salinomycin, indicated doses of salinomycin were added to the corresponding wells for an
incubation period of 48 hours. For synergistic assays involving the combination of cisplatin and salinomycin,
cells were treated with 4 μM of salinomycin for 48 hours
followed by co-treatment with cisplatin at a range of
doses (1, 2, 5, 10, 20 μM) for an additional 48 hours. For
synergistic assays involving the combination of paclitaxel
and salinomycin, cells were treated with 0.5 μM of salinomycin for 48 hours followed by co-treatment with
paclitaxel at a range of doses (1, 2, 3, 4, 6, 8 nM) for an
additional 48 hours. Each permutation was performed in
triplicates. Following the indicated incubation periods for
Page 3 of 14
the above assays, 20 μL of the MTS reagent was added
into each well followed by a 1–3 hour incubation period.
The plates were then read at an absorbance of 490 nm.
Combination index analysis of drug interactions
To determine whether the observed cytotoxic interactions of salinomycin with paclitaxel/cisplatin were
synergistic, additive, or antagonistic in nature, the combination index (CI) method of Chou and Talalay was
used [19]. The CI value is a quantitative measure indicating the type of interaction between two drugs: CI <1
indicates synergism, CI = 1 indicates an additive effect,
and CI > 1 indicates antagonism. The CI value for each
experimental group was calculated using the following
formula: CI = (D)1/(D)2 + (Dx)1/(Dx)2, where (D)1 and
(D)2 in the numerator are the concentrations of drug 1
and 2 required in combination to produce a survival of
x%, and (Dx)1 and (Dx)2 in the denominator are the
concentrations of drug 1 and 2 required to individually
produce a survival of x%.
Trypan blue dye exclusion assay
In order to confirm the observed synergy between salinomycin and cisplatin/paclitaxel, a trypan blue exclusion
assay was performed for the combination treatment
which generated the lowest CI value (indicative of the
greatest synergy) and produced a survival of less than
80%. Cells were pre-treated with indicated doses of salinomycin (4 μM for cisplatin + salinomycin combination
treatments and 0.5 μM for paclitaxel + salinomycin combination treatments) followed by co-treatment with
paclitaxel (3 nM) or cisplatin (5 μM) for an additional
48 hours. Media was replenished following initial salinomycin pre-treatment. Cell viability for each experimental
group was then determined by the percentage of cells
that excluded the dye, as trypan blue only traverses the
membrane of dead cells. Cells were mixed with an equal
volume of 0.4% trypan blue dye, and allowed to incubate
for 5 minutes. The percentage of trypan blue positive
cells was then determined by manually counting the
stained fraction with a hemocytometer.
TUNEL assay
Cells were treated with salinomycin 4 days prior to fixing in 70% Ethanol. Media and growth factors were not
replenished throughout the treatment. Using the APOBRDUTMKit (Phoenix Flow Systems, Inc., San Diego,
CA), the cells undergoing apoptosis were labeled with
bromolated deoxyuridine triphosphate nucleotides
(BrdUTP). These cells were then identified and binded
to a fluorescein labeled antiBrdU monoclonal antibody.
After the required incubation times, the samples analyzed for the proportion of apoptotic cells by flow
cytometry.
Kuo et al. BMC Cancer 2012, 12:556
/>
Quantitative real-time PCR
The cultured cells were treated with salinomycin (0 –
8 μM) for 48 hours. Total cell lysate was collected and
mRNA was extracted using the RNeasy kit (QIAGEN).
cDNA was then synthesized from 1.5 μg of total mRNA
using reverse transcriptase (Invitrogen, Carlsbad, CA,
USA), as per the manufacturer’s instructions. Real-time
quantitative PCR was performed by combining 2.5 μl of
the RT with 22.5 μl of SYBR green (Roche, Basel, Switzerland). The reaction was run using System 7300 (Applied
Biosystems, Foster City, CA, USA) and results were analyzed by the relative quantity method. Experiments were
performed in triplicates with GAPDH expression as the endogenous control. Primers were custom designed by the
authors and created by Operon Biotechnologies,
Alabama, USA. The following sequences were used:
GAPDH forward: 50-CTTCGCTCTCTGCTCCTCC-30
GAPDH reverse: 50-CAATACGACCAAATCCGTTG-30
CD44 forward: 50-ACACCACGGGCTTTTGACCAC-30
CD44 reverse: 50-AGGAGTTGCCTGGATTGTTGCTTG30 BMI-1 forward: 50-TCCACAAAGCACACACATCA-30
BMI-1 reverse: 50-CTTTCATTGTCTTTTCCGCC-30 Snail
forward: 50-CTGCCCTGCGTCTGCGGAAC-30 Snail reverse: 50-GCTTCTCGCCAGTGTGGGTCC-30 E-Cadherin
forward:
50-CTGATGTGAATGACAACGCC-30
ECadherin reverse: 50-TAGATTCTTGGGTTGGGTCG-30
ZEB-1 forward: 50-GCCGCTGTTGCTGATGTGGCT-30
ZEB-1 reverse: 50-TCTTGCCCTTCCTTTCCTGTGTCA-30
ALDH1A1 forward: 50-CGCCAGACTTACCTGTCCTA-30
ALDH1A1 reverse 50-GTCAACATCCTCCTTATCTCCT-30
Oct-4 forward: 50-GCAAAGCAGAAACCCTCGTGC-30
Oct-4 reverse: 50-ACCACACTCGGACCACATCCT-30
Nanog forward: 50-GATTTGTGGGCCTGAAGAAA-30
Nanog reverse: 50-TTGGGACTGGTGGAAGAATC-30.
Tumor sphere formation assay
The putative cancer stem cell cultures were plated at a
density of 500 cells/ml in a low-adhesion tissue culture
plate. Serum free media containing 25 ng/ml growth factors (1/5th normal growth factor concentration) was
used. Salinomycin was added when the cells were plated
at concentrations of 0, 0.5, 1, 2, 4, 8 μM. Salinomycin
was re-added every other day for 10 days and on day 10
the spheres were photographed. Media and growth factors were not replenished throughout the assay. Spheres
were plated and counted in quadruplicates.
Invasion assay
Inserts with 8 μm pores (BD Biosciences) were coated
with Matrigel from EHS murine sarcoma (Sigma), at a
concentration of 3 mg/mL. Cells were pretreated with
their respective concentrations of salinomycin for 4 days
and 100,000 viable cells of each permutation were added
to their respective inserts. To ensure that perceived
Page 4 of 14
changes in invasion were not due to cytotoxicity of salinomycin, an MTS was performed for JLO-1 cells under
the same conditions as the Salinomycin-treated cells.
Cell numbers were then adjusted according to the MTS
data to account for discrepancies in cell death by using
the following formula: (100,000)/(x) = (% cell viability)/
(100), where (x) = number of cells added into each insert
and (% cell viability) is determined by the MTS (i.e., treatment with 4 μM resulted in% cell viability of 33.0%; thus
303,030 cells were added into their respective inserts.).
Each permutation was performed in triplicates. Cells were
left to invade for 48 hours under hypoxic conditions (5%
O2). After 48 hours, cells were fixed for 2 minutes in
100% methanol and then stained in crystal violet. Cells
that invaded were counted in a pre-determined field.
Western blot analysis
Respective doses of salinomycin were added to the cells
48 hours before harvesting. Cells were lysed on ice for
10 minutes with RIPA buffer (0.1 M Tris, 2% SDS, 20%
glycerin, and protease inhibitor tablets from Roche Diagnostics, Indianapolis, IN). Gel electrophoresis using 10%
NuPage Bis-Tris gels separated the proteins, which were
then transferred onto a PVDF membrane. The membrane
was blocked for one hour in 5% non-fat dry milk in TBST
and incubated overnight in primary antibody at a dilution
of 1:1,000. The membranes were then incubated in their
appropriate secondary antibodies at a dilution of 1:10,000
and each specific protein was visualized using SuperSignal
West Pico Luminol (Pierce, Rockford, IL).
MicroRNA profiling
MicroRNA was isolated using the mirVana miRNA isolation kit (Ambion, Austin, TX), following the manufacturer’s instructions. Samples were run on the Illumina
MicroRNA Array Profiling platform [20]. Analyses were
performed using BRB-ArrayTools developed by Dr.
Richard Simon and BRB-ArrayTools development team.
Clustering algorithms were performed by Cluster 3.0
and visualized with TreeView (Eisen Lab, Stanford
University). The data discussed in this study have been
deposited in NCBI’s Gene Expression Omnibus [21] and
are accessible through GEO Series accession number GSE33196 ( />acc.cgi?acc=GSE33196). Candidate microRNAs were
identified and confirmed by RT-qPCR with microRNAspecific forward primers and a universal reverse primer. U6 small nuclear RNA transcript served as the
normalization signal. The sequences of RT-qPCR primers
for microRNA detection were as follows: hsa-mir-328: 50CTGGCCCTCTCTGCCCTTCCGT-30 hsa-mir-203: 50GTGAAATGTTTAGGACCACTAG-30 hsa-mir-199a-3p:
50-ACAGTAGTCTGCACATTGGTTA-30 Universal reverse:
50-GCGAGCACAGAATTAATACGACT-30 U6 forward:
Kuo et al. BMC Cancer 2012, 12:556
/>
Page 5 of 14
50-GGGGACATCCGATAAAATTGG-30 U6 reverse: 50ACCATTTCTCGATTTGTGCGT-30.
Data analysis
Results represent mean and SD where appropriate.
Experiments were performed in duplicate (western blot
and TUNEL) or triplicate.
Results
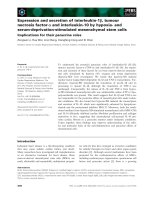
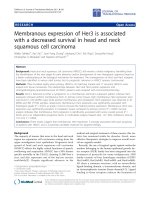
Acquisition of a cancer stem cell culture
A putative cancer stem cell culture, JLO-1, was derived
from a fresh laryngeal cancer tissue. Cells were cultured
for several months under conditions that favored the
growth of stem cells and inhibited the growth of bulk
tumor cells. The culture was confirmed to be 91.5%
CD44 positive by flow cytometry (Fig. 1A). To further
verify the stem cell phenotype of the JLO-1 culture, a
qPCR was performed to evaluate the expression of aldehyde dehydrogenase class-1A1 (ALDH1A1) and the
transcription factors Oct-4 and Nanog in JLO-1 relative
to a HNSCC cell line, UMSCC-10B, cultured under
standard conditions. Previous studies indicate ALDH is
a more specific HNSCC CSC marker than CD44, as
ALDH expression identifies a subpopulation of CD44
positive cells containing the tumorigenic cancer stem
cells [22,23]. JLO-1 demonstrated considerably higher
80 160 240 320 400
Counts
2.64%
91.52%
0
0
Counts
50 100 105 200 205
A
100
101
102
130
104
100
Nonspecific IgG PE
B
101
102
130
104
CD44 PE
JLO-1 Comparison To UMSCC-10B
Fold Change in mRNA Expression
25
20
15
10
5
0
ALDH
Oct-4
Nanog
ALDH
Fold Change in mRNA Expression
Fold Change in mRNA Expression
ALDH
250
200
150
100
50
0
HN-1
JLO-1
350
300
250
200
150
100
50
0
HN-30
JLO-1
Figure 1 Isolation of HNSCC stem cell culture. (A) Flow cytometry confirms that our isolated cell culture is 91.5% CD44 positive. A nonspecific
IgG antibody was used as a negative control. (B) RT-qPCR further confirms the stem cell characteristics of JLO-1 by showing elevated ALDH levels in
comparison to three control cell lines (UMSCC-10B, HN1, and HN30). JLO-1 also has increased levels of Oct-4 and Nanog relative to UMSCC-10B.
Kuo et al. BMC Cancer 2012, 12:556
/>
Page 6 of 14
expression of ALDH, Oct-4, and Nanog relative to
UMSCC-10B (Fig. 1B). ALDH1A1 expression of JLO-1
relative to two additional HNSCC cell lines was assessed
for further verification (Fig. 1B).
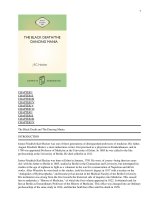
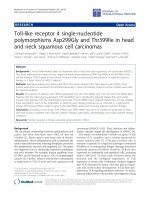
changes in cell proliferation and viability. A range of
doses (0 – 8 μM) previously published by Gupta et al.
was used to quantify cell death after 48 hours. JLO-1
experienced significant toxicity towards salinomycin in a
dose dependent manner, with an IC50 close to 2 μM. In
a parallel experiment, UMSCC-10B exhibited less sensitivity to salinomycin treatment, with an IC50 beyond
8 μM (Fig. 2A). To further verify cell death, a TUNEL
assay was performed to measure amounts of DNA
Salinomycin induces a dose-dependent increase in cell
death
To determine the effects of salinomycin on the HNSCC
stem cells, an MTS assay was performed to measure
Cell Viability
A
1.4
1.3
1.2
1.1
1
0.9
0.8
0.7
0.6
0.5
0.4
0.3
0.2
0.1
0
JLO-1
UMSCC-10B
0
0.5
1
2
4
6
8
Salinomycin Concentration (µM)
B
Control
70
2 µM Salinomycin
60
86.5%
50
40
Counts
0
0
10
20 30
150
100
50
Counts
200
250
15.0%
10
2
3
5
4
10
10
TUNEL FITC-A
10
C
10
2
3
4
10
10
TUNEL FITC-A
5
10
Bax/Bcl-2 Ratio
0.57
0.35
0.17
0
2
4
Salinomycin Concentration ( M)
Bax
Bcl-2
Figure 2 Salinomycin causes a decrease in cell viability and induces apoptosis. (A) MTS assay shows salinomycin causes a selective
decrease in cell proliferation of JLO-1 compared to UMSCC-10B. The absorbance values (Y-axis) were normalized by dividing over the absorbance
of each control. Error bars represent standard deviation. (B) TUNEL assay shows an increase in apoptosis with a 2 μM salinomycin treatment
indicated by the percent increase in DNA strand breaks. (C) Western blot demonstrates a dose dependent increase in apoptosis as seen by the
induction in Bax/Bcl-2 ratio.
Kuo et al. BMC Cancer 2012, 12:556
/>
Page 7 of 14
paclitaxel. MTS assays were performed to compare the
differences in the survival curves between each chemotherapy drug alone and the combination treatments.
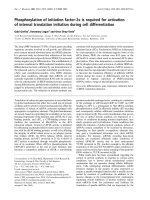
Using the Chou-Talalay combination index (CI) method,
we observed synergistic cytotoxic interactions between
salinomycin and both chemotherapeutic drugs (Fig. 3A
and B). However, paclitaxel exhibited stronger synergism
with salinomycin, as indicated by lower CI values. Interestingly, in a parallel experiment with UMSCC-10B,
paclitaxel and salinomycin exhibited an antagonistic
drug interaction (Fig. 3C). To further confirm the
observed cytotoxic synergism in JLO-1, a trypan blue exclusion dye assay was performed for the combination
treatment exhibiting the lowest CI value (greatest synergism) that induced cytotoxicity of at least 20%. Combination treatment of 5 μM cisplatin and 4 μM salinomycin
resulted in a CI of 0.82, while combination treatment of
3 nM paclitaxel and 0.5 μM salinomycin resulted in a CI
of 0.21 (Fig. 3D). As the CI values are below 1 (1 indicates additivity), the results demonstrate that both
strand breaks, which correspond to the levels of apoptosis caused by salinomycin. At 2 μM, there was a substantial increase in the proportion of CSCs undergoing
apoptosis compared to the control (Fig. 2B). Western
blot analysis revealed increasing protein levels of proapoptotic bax and constant levels of anti-apoptotic bcl-2
upon salinomycin treatment, indicating a dosedependent increase in the Bax/Bcl-2 ratio and greater
mitochondrial permeabilization (Fig. 2C). Our results
are consistent with those of Basu et al. suggesting salinomycin effectively kills treatment-resistant malignant subpopulations in HNSCC [16].
Salinomycin synergistically increases cell death in
combination with cisplatin and paclitaxel
Since salinomycin shows promise as a novel treatment
for cancer, we sought to determine which chemotherapy
drugs would be beneficial for concurrent treatment. We
tested the synergy between salinomycin and two conventional chemotherapy drugs for HNSCC: cisplatin and
Combination Index
B
JLO-1
A
1.1
1
1
0.8
0.9
0.6
0.8
0.4
0.7
0.2
0.6
0
0
5
10
15
20
0
2
4
6
10
9
8
7
6
5
4
3
2
1
0
8
Taxol Concentration (nM)
Cisplatin Concentration (µM)
D
C
JLO-1
1.2
1.2
0
UMSCC-10B
1
2
3
4
5
6
Taxol Concentration (nM)
70%
CI=0.82
% Trypan blue (+) cells
60%
CI=0.21
50%
40%
30%
20%
10%
0%
1
Control
2
4
salinomycin (µM)
5
15
cisplatin (µM)
30
2
4
taxol (nM)
8
cis+Sal
tax+Sal
combination
Figure 3 Combination treatments with salinomycin and chemotherapy drugs synergistically target cancer stem cells. The mean
combination index (CI) value of combination treatments in JLO-1 were calculated as explained in the Methods. CI < 1 indicates synergy, CI = 1
(denoted by dashed line) indicates additivity, and CI > 1 indicates antagonism. (A) CI graph depicts cytotoxic interactions between 4 μM
salinomycin and increasing doses of cisplatin (1, 2, 5, 10, 20 μM) in JLO-1. (B) CI graph depicts cytotoxic interactions between 0.5 μM salinomycin
and increasing doses of taxol (1, 2, 3, 4, 6, 8 nM) in JLO-1. (C) CI graph depicts cytotoxic interactions between 0.5 μM salinomycin and increasing
doses of taxol (1, 2, 3, 4, 6, 8 nM) in a parallel experiment for UMSCC-10B. (D) Trypan blue dye exclusion assay further verifies observed synergy
for JLO-1 receiving combination treatments of 0.5 μM salinomycin + 3nM taxol or 4 μM salinomycin + 5 μM cisplatin. Calculated CI values are
shown above respective bars. All error bars represent standard deviation.
Kuo et al. BMC Cancer 2012, 12:556
/>
combination treatments synergistically targeted the CSC
population more efficiently than either drug alone, although paclitaxel exhibits markedly greater synergism
than cisplatin.
Page 8 of 14
A
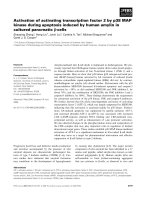
Salinomycin decreases stem cell markers and self-renewal
capabilities
To determine if salinomycin also causes a decrease in
stem cell capabilities, a RT-qPCR was performed to
quantify the change in gene expressions of the known
markers BMI-1 and CD44 were measured. CD44 is a
well-documented cell surface marker for head and neck
cancer and BMI-1 is necessary for self-renewal. Using
the same range of doses, the results showed a dosedependent decrease of CD44 and BMI-1, both of which
are critical for maintaining tumorigenicity in head and
neck CSCs (Fig. 4A). To confirm these effects, a sphere
formation assay was performed. The ability to form
spheres is a defining feature and indicator of CSCs. Salinomycin was added during sphere formation, and the
substantial decrease in number of spheres formed confirms that salinomycin inhibits self-renewal of CSCs. At
the highest doses (4 μM and 8 μM) no spheres were
formed (Fig. 4B and C).
B
Salinomycin induces EMT but decreases invasive abilities
The ability to invade and metastasize is a characteristic
of CSCs that is often enabled by EMT. Recent studies
have even shown a direct link between an induction of
EMT and a gain in stem cell properties such as self-renewal. Therefore, we sought to determine the effects of
salinomycin on EMT by examining the changes in the
known regulatory markers E-cadherin, Zeb-1, Snail, and
vimentin. Contrary to our hypothesis, salinomycin
caused an induction of EMT. As shown by RT-qPCR,
there is a substantial increase in expression of Snail and
Zeb-1 and decrease in epithelial marker E-cadherin
(Fig. 5A-C). Immunoblotting verified the increase in
Snail and further established the induction of EMT by
indicating an increase in the mesenchymal marker
vimentin. (Fig. 5D). In addition, treatment with 2 μM
salinomycin resulted in the acquisition of a spindleshaped cell morphology (Fig. 5E). As induction of EMT
was accompanied by increasing amounts of cell death,
we speculated whether the observed EMT was simply an
epiphenomenon triggered by significant cell death as
opposed to a salinomycin-specific response. To exclude
this possibility, JLO-1 was treated with cytotoxic levels
of a control drug (one that does not influence EMT at
non-cytotoxic doses), and changes in EMT genes were
assessed. Cell death was shown to have marginal to
no effect on EMT in JLO-1 cells (Additional File 1).
Given the surprising activation of EMT, an invasion
assay was then performed to further assess the effect of
C
Figure 4 Salinomycin decreases expression of stem cell
markers and self-renewal properties. (A) The RT-qPCR results
demonstrate a decrease in gene expression of both CD44 and BMI-1
with increasing doses of salinomycin. Values are relative to a control
of 0 μM salinomycin and endogenous control GAPDH. (B) Sphere
formation assay shows that salinomycin inhibits self-renewal
capabilities of the cancer stem cells. Salinomycin was added during
sphere growth. (C) Accompanying graph shows the fold change in
number of spheres formed relative to the control of 0 μM
salinomycin. Error bars denote standard deviation.
salinomycin on migration. Interestingly, in disconnect
with the induction of EMT, salinomycin caused a dosedependent decrease in number of cells migrating
through a matrigel membrane (Fig. 5F).
Kuo et al. BMC Cancer 2012, 12:556
/>
B
E-cadherin
1.2
7
1
6
C
Snail
32
5
0.8
Zeb-1
64
16
4
0.6
8
3
0.4
0.2
0
2
4
1
2
0
0 µM
1 µM
2 µM
4 µM
8 µM
Salinomycin Concentration
1
0 µM 0.5 µM 1 µM
2 µM
4 µM
8 µM
0 M
Salinomycin Concentration
1 M
2 M
4 M
8 M
Salinomycin Concentration
F
D
0 µM
2 µM
1.25
4 µM
Vimentin
Snail
Total Erk
Fold Change of Invaded Cells
Fold Change in mRNA Expression
A
Page 9 of 14
1
0.75
0.5
0.25
0
Control
0.5 µM
1 µM
2 µM
Salinomycin Concentration
E
Control
2µM Salinomycin
Figure 5 Salinomycin induces EMT but decreases invasive properties. (A-C) The RT-qPCR data shows a decrease gene expression in
E-cadherin and an upregulation of Snail and Zeb-1 as labeled, which correspond to an induction of EMT. All data is relative to the control of
0 μM salinomycin and endogenous control GAPDH. (D) Western blotting confirms the induction of Snail and shows an upregulation of the
mesenchymal marker vimentin. (E) Micrographs of JLO-1 upon treatment with 2 μM salinomycin depicts alterations in cell morphology. (F) The
graph denotes the fold change in number of cells that invaded through a matrigel membrane relative to the control of 0 μM salinomycin. Error
bars represent standard deviation.
Salinomycin induces phosphorylation of Akt
The activation of the PI3K/Akt pathway has been shown
to be a central feature of EMT. This signaling pathway is
often found overly active in many cancers, which negatively influences prognosis. In search of an explanation
and further verification of the unanticipated increase in
EMT markers, we investigated the effects of salinomycin
on Akt. Consistent with our EMT results, salinomycin
caused an increase in phosphorylation of Akt (Fig. 6).
Activated Akt has been shown to result in the inhibition
of Bax and up-regulation of Bcl-2, in contrast to
Figure 2C. Thus, to verify that phosphorylation of Akt in
fact correlated with increased kinase activity, we investigated the phosphorylation status of two immediate
downstream effectors implicated in EMT, GSK3-β and
mTOR. Previous studies have identified Snail as a direct
target of active (unphosphorylated Ser-9) GSK3-β,
resulting in inhibition of snail transcription and promotion of snail degradation [12,13]. Immunoblotting
revealed increased phosphorylation of GSK3-β and
mTOR. Taken together, our findings indicate that the induction of EMT follows an increase in activation of Akt,
Kuo et al. BMC Cancer 2012, 12:556
/>
Page 10 of 14
Salinomycin Concentrations
0 µM
2 µM
4 µM
P-Akt
P-mTOR
P-GSK3ß
Total Erk
Figure 6 Salinomycin induces phosphorylation of Akt. Western
blotting shows an increase in phosphorylation of Akt (Ser473), as
well as the immediate downstream targets GSK3-β (Ser9) and mTOR
(Ser2448), when treated with the indicated doses of salinomycin.
Total Erk is utilized as a loading control.
but the levels of cell death caused by salinomycin are independent of this anti-apoptotic pathway.
Salinomycin induces changes in microRNA Expression
MicroRNAs have gained widespread attention for their
roles in regulating many aspects of cancer progression
including EMT, invasion and stem cell properties. To
determine whether the effect of salinomycin could potentially be mediated by microRNA activity, we performed a microarray analysis of global microRNA
expression in JLO-1 cells treated with increasing doses
of salinomycin. Clustering analysis revealed a set of
microRNAs that were consistently up or down-regulated
by salinomycin, suggesting that the effects of salinomycin may potentially be mediated through changes in
microRNA expression (Figure 7a). Among these microRNAs were miR-328 and miR-199a-3p (Figure 7b), both
with known roles in promoting drug sensitivity [24-26].
Interestingly, salinomycin downregulated the expression
of miR-203, which is known to inhibit EMT [27].
Discussion
The CSC-inhibiting activity of salinomycin has previously been demonstrated in a variety of tumors including those of the breast, lung, and colon. Here we have
extended these studies by showing that salinomycin
induces apoptosis and chemosensitivity while inhibiting
cell proliferation, invasion, stem cell marker expression
and sphere formation in putative HNSCC stem cells. Ultimately, these results suggest that salinomycin or its
derivatives may be an effective novel treatment for
HNSCC, especially when administered in combination
with standard treatments. Our results are consistent with
a previous study by Busa et al. reporting the ability of salinomycin to eradicate treatment-resistant phenotypes in
HNSCC. However, Basu et al. report no observed synergistic efficacy between salinomycin and cisplatin in
HNSCC in vitro, speculating a possible overlap of the individual drugs’ cytotoxic mechanisms [16]. Although the
method of quantifying drug interactions is not specified,
we are not surprised by this finding given the relatively
weak synergy observed between cisplatin and salinomycin in JLO-1. In contrast, combination treatment of
paclitaxel with salinomycin resulted in strong synergy for
all tested drug ratios, emphasizing the potential of this
drug pair in the treatment of HNSCC. Salinomycin was
also observed in our system to activate Akt signaling and
induce changes in gene expression indicative of EMT.
These results are quite unusual and potentially worrisome given that Akt signaling and EMT are both heavily
implicated in cell proliferation, invasion and acquisition
of CSC properties.
At this time of writing there appears to be no other
study which documents the effect of salinomycin on
Akt, leaving open for investigation whether salinomycin
also activates Akt in other cancers. Drugs including cisplatin, etoposide, doxorubicin, and tamoxifen have been
shown to induce Akt phosphorylation leading to chemoresistance in some cancers [28-30]. Similarly, it is
possible that pro-survival mechanisms within HNSCC
stem cells activate Akt in the presence of salinomycin in
attempt to overcome drug-induced cell death. Further
investigation is required to elucidate the mechanisms
that are responsible for drug-induced phosphorylation.
What is clear, however, is that salinomycin is ultimately
capable of inducing apoptosis and inhibiting cell proliferation in HNSCC stem cells. Since apoptosis occurs
despite the activation of Akt, it is likely that salinomycin
targets apoptotic pathways that are downstream of Akt.
We report an induction of Bax and constant expression
of Bcl-2 in salinomycin-treated JLO-1 despite increased
Akt kinase activity. Previous studies have also shown
that salinomycin is capable of inducing apoptosis
through a variety of targets including Bcl-2, P-glycoprotein, 26S proteasome, calpain and cytochrome C, all of
which are downstream or independent of Akt [31].
EMT has been nearly synonymous with the acquisition
of an invasive and metastatic phenotype and its link to
cancer stem cell properties is also becoming wellestablished [15,32]. Furthermore, salinomycin was originally identified as a cancer stem cell inhibitor by screening
for drugs with specific toxicity against mesenchymally
transdifferentiated breast cancer cells [5]. Likewise, Basu
et al. demonstrated in vivo depletion by salinomycin of
the vimentin-positive subpopulation and enrichment of
the E-cadherin-positive subpopulation in primary tumorderived xenografts, possibly through selective cytotoxicity, promotion of MET, or inhibition of EMT [16].
Thus, it is interesting that salinomycin induces gene
Kuo et al. BMC Cancer 2012, 12:556
/>
8 µM Salinomycin
4 µM Salinomycin
2 µM Salinomycin
1 µM Salinomycin
0.5 µM Salinomycin
0 µM Salinomycin
A
Page 11 of 14
4.5
1.5
3.0
-1.5
0.0
-3.0
-4.5
HS_243.1
hsa-miR-1277
hsa-miR-330-3p
hsa-miR-337:9.1
hsa-miR-331-5p
hsa-miR-487a
HS_35
hsa-miR-542-3p
HS_109
hsa-miR-138-1*
HS_203
HS_250
HS_305_b
HS_46
hsa-let-7f-2*
HS_194
hsa-miR-671-5p
hsa-miR-520g
hsa-miR-556-3p
hsa-miR-34a*
hsa-miR-614
hsa-miR-376a*:9.1
hsa-miR-450b-5p
hsa-miR-633
HS_241.1
hsa-miR-1249
hsa-miR-34b*
hsa-miR-647
hsa-miR-221*
hsa-miR-431
HS_77
HS_168
hsa-miR-1291
HS_47
HS_57.1
hsa-miR-1283
HS_179
hsa-miR-635
HS_167.1
hsa-miR-541
hsa-miR-521
hsa-miR-216a
hsa-miR-595
hsa-miR-181d
hsa-miR-24-1*
HS_68
hsa-miR-196a*
hsa-miR-302b
HS_69
hsa-miR-217
hsa-miR-627
hsa-miR-1279
hsa-miR-433
hsa-miR-522
HS_263.1
hsa-miR-610
hsa-miR-648
HS_261.1
hsa-miR-494
hsa-miR-130a*
hsa-miR-1468
hsa-miR-493
hsa-miR-630
hsa-miR-892b
HS_89
hsa-miR-219-1-3p
hsa-miR-641
hsa-miR-15a*
HS_176
hsa-miR-346
hsa-miR-504
hsa-miR-589
solexa-6676-127
hsa-miR-448
hsa-miR-566
hsa-miR-558
hsa-miR-625
hsa-miR-101*
hsa-miR-518e*
HS_159
hsa-miR-496
hsa-miR-1247
hsa-miR-188-3p
hsa-miR-432*
solexa-1460-671
hsa-miR-621
HS_232
hsa-miR-661
hsa-miR-562
hsa-miR-767-3p
HS_24
HS_280_b
HS_3
hsa-miR-144
hsa-miR-124*
HS_201
hsa-miR-542-5p
hsa-miR-1178
hsa-miR-1183
HS_202.1
solexa-826-1288
hsa-miR-369-3p
hsa-miR-651
hsa-miR-936
hsa-miR-220a
hsa-miR-518b
hsa-miR-624*
HS_257
hsa-miR-1234
hsa-miR-328
solexa-5620-151
HS_80
hsa-miR-455-5p
hsa-miR-509-3-5p
HS_129
HS_60
hsa-miR-431*
hsa-miR-766
hsa-miR-548l
hsa-miR-548c-3p
hsa-miR-708
hsa-miR-518c
solexa-2580-353
HS_65
hsa-miR-125b-2*
hsa-miR-19b-1*
hsa-miR-550
HS_200
hsa-miR-876-3p
hsa-miR-150*
HS_49
HS_79.1
hsa-miR-639
hsa-miR-509-5p
solexa-3793-229
hsa-miR-892a
hsa-miR-498
hsa-miR-194
hsa-miR-608
hsa-miR-941
hsa-miR-1181
hsa-miR-188-5p
hsa-miR-190b
hsa-miR-642
hsa-miR-192
hsa-miR-93*
hsa-miR-200c*
solexa-3044-295
HS_182.1
hsa-miR-10b
hsa-miR-1303
hsa-miR-181c*
hsa-miR-183*
HS_31.1
hsa-miR-768-3p:11.0
HS_151.1
hsa-miR-628-3p
hsa-miR-27a*
hsa-miR-1259
HS_54
hsa-miR-92a-1*
hsa-miR-565:9.1
hsa-miR-594:9.1
solexa-2683-338
hsa-miR-1296
hsa-miR-29b-1*
hsa-miR-424*
hsa-miR-663b
hsa-miR-628-5p
hsa-miR-139-5p
hsa-miR-874
hsa-miR-505*
hsa-miR-577
solexa-578-1915
hsa-miR-626
HS_284.1
hsa-miR-342-3p
hsa-miR-34c-5p
hsa-miR-514
hsa-miR-511
solexa-3126-285
hsa-miR-129-3p
hsa-miR-450b-3p
hsa-miR-568
hsa-miR-100*
hsa-miR-629*
hsa-miR-891a
hsa-miR-513b
hsa-miR-532-3p
hsa-miR-324-3p
hsa-miR-19a*
hsa-miR-524-3p
hsa-miR-598
hsa-miR-30c-1*
hsa-miR-548o
HS_22.1
hsa-miR-942
hsa-miR-212
hsa-miR-663
HS_183.1
HS_61
hsa-miR-629
hsa-miR-769-3p
solexa-7534-111
hsa-miR-1307
hsa-miR-576-5p
hsa-miR-340*
hsa-miR-134
hsa-miR-631
hsa-miR-654-5p
B
Relative to Untreated Cells (Log2)
5
4
3
2
1
hsa-mir-199a-3p
0
-1
0.5 µM
1 µM
2 µM
4 µM
-2
-3
-4
-5
Figure 7 (See legend on next page.)
Salinomycin Concentration (µM)
8 µM
hsa-mir-203
hsa-mir-328
Kuo et al. BMC Cancer 2012, 12:556
/>
Page 12 of 14
(See figure on previous page.)
Figure 7 Salinomycin induces changes in microRNA expression. (A) Heatmap derived from microarray data showing sets of microRNAs upor down-regulated by salinomycin. (B) Three candidate microRNAs identified by microarray were further verified via RT-qPCR. Data is shown as
the mean results of two separate experiments.
expression changes indicative of EMT in HNSCC stem
cells, especially while inhibiting invasion and stemness.
This surprising observation requires a reassessment of
the link between EMT and cancer stem cells, and
strongly suggests that EMT may not in all cases lead to
an invasive or stem cell-like phenotype.
Although this study marks the first instance in which
salinomycin is shown to induce EMT, it is not the first
to show a disconnection between EMT and stem cells.
In fact, it is well known that embryonic stem cells
(ESCs) resemble epithelial cells and have high expression
of E-cadherin, which is crucial for pluripotency in ESCs
and may even be used in place of Oct-4 during somatic
cell reprogramming [33]. It is also well established that
the reverse of EMT, mesenchymal-epithelial transition
(MET), is a critical step for reprogramming mouse fibroblasts to induced pluripotent stem cells (iPSCs) [34,35].
In terms of cancer, it was recently demonstrated that
prostate cancer stem cells are characterized by high Ecadherin expression, are highly invasive, and exhibit high
expression of stem cell markers Oct-3/4 and Sox2 compared to cells with low E-cadherin expression [36,37]. It
has been hypothesized that cancer stem cells possess a
high degree of plasticity, and that following EMT, Ecadherin expression may be restored without losing stem
cell function or invasive capacity [36].
Further research is required to reconcile the apparent
inconsistency between contexts in terms of the relationship between EMT and stemness. Contrary to the data
presented here, a previous report has confirmed the ability of salinomycin to reverse EMT in colorectal cancer
[38]. Thus, whether salinomycin promotes or inhibits
EMT varies between cases and may be highly dependent
on cell type. In any case, the data presented here make it
clear that EMT does not always correspond to stem cell
phenotype or invasion, and that salinomycin may induce
loss of stemness through pathways that are independent
of EMT.
Investigating changes in microRNA expression may
offer additional insight into the mechanism of salinomycin. In particular, microRNAs have previously been
shown to regulate invasion via EMT-independent pathways [39]. MiR-328 has been shown to negatively regulate the expression of ABCG2 in human cancer cells,
while miR-199a-3p has been shown to induce cell cycle
arrest, reduce invasion, and increase doxorubicin sensitivity by negatively regulating mTOR and c-Met [25,26].
Interestingly, we report an increase in activation of
mTOR upon salinomycin treatment despite induction of
miR-199a-3p. However, it is known that individual
microRNAs can target multiple components within one
signaling pathway. MiR-199a-3p has also been shown to
inhibit proliferation by negatively regulating the cancer
stem cell marker CD44 [24]. The upregulation of these
miRs may explain some of the effects of salinomycin including the downregulation of CD44, decrease in invasion, and the synergy observed between salinomycin and
cisplatin or paclitaxel. The ability of salinomycin to induce EMT in HNSCC stem cells may be explained by
the dose-dependent downregulation of miR-203, which
has been shown to inhibit EMT in prostate cancer [27].
Further characterization of these microRNAs and other
potential pathways affected by salinomycin will provide a
greater understanding of how to target cancer stem
cells.
Conclusions
The results of this study lend promise to the notion of
targeting cancer stem cells with small molecules. Consistent with a prior study in breast cancer, we have
shown that salinomycin induces apoptosis and chemosensitivity while inhibiting cell proliferation, invasion,
stem cell marker expression and sphere formation in putative HNSCC stem cells. Microarray analysis revealed
that increased chemosensitivity could potentially be
mediated through changes in certain microRNA levels.
Contrary to the above effects and to current understanding of cancer stem cell biology, salinomycin also activated Akt signaling and induced changes in gene
expression indicative of an EMT. This can be worrisome
if the purpose of this drug is to inhibit proliferation and
invasion/metastasis. Thus, a more complete understanding of the biological effects of salinomycin is a prerequisite to translating this compound or potential derivatives
for use in a clinical setting. In addition, there is a potential need to re-investigate the relationship between stem
cell phenotype, EMT and Akt signaling.
Additional file
Additional File 1: Format: PDF. Cell death does not significantly alter
expression of EMT and stem cell genes in JLO-1. A drug control was used
to confirm that dose-dependent induction of EMT genes and repression
of stem cell genes was not a mere epiphenomenon of cell death
accompanying salinomycin treatment. We have previously discovered
that Metformin does not influence EMT in JLO-1 cells at non-cytotoxic
doses, indicating it does not regulate EMT in JLO-1 (unpublished data).
(A) An MTS assay was initially performed to determine the cytoxicity
curve for JLO-1 cells treated with Metformin for 72 hours. (B) At non–
Kuo et al. BMC Cancer 2012, 12:556
/>
cytotoxic concentrations, Metformin does not regulate EMT based on RTqPCR data of Snail and E-cadherin transcript levels, thus it is an
appropriate drug control to induce cell death in JLO-1. (C) Upon 48-hour
treatment of JLO-1 with 15 mM Metformin to induce approximately 60%
cell death (equivalent to the cell death observed from 4 μM salinomycin
treatment), expression of EMT genes Snail and E-cadherin showed only
minor changes. In addition, CD44 expression was not effected by
induction of cell death.
Abbreviations
CSC: Cancer stem cell; HNSCC: Head and neck squamous cell carcinoma;
EMT: Epithelial to mesenchymal transition; miRNA: microRNA.
Competing interests
The authors declare that they have no competing interests.
Authors’ contributions
SZK performed the qPCR for EMT genes, western blots, MTS assays, TUNEL
assay, prepared the figures and wrote the manuscript excluding the
discussion. KJB performed the qPCR for stem cell genes, sphere formation
assay, matrigel invasion assay, and drafted the first version of the manuscript.
ER performed additional qPCR assays, western blots, trypan blue assays, MTS
assays, assisted in data analysis, and revised the manuscript. AK prepared the
microRNA for analysis, wrote the discussion, and revised the manuscript. EA
assisted SZK in many of the experimental assays and helped analyze data.
JBF performed the microarray for miRNA expression. JWR participated in
design and coordination of this study. XA derived the putative CSC and
helped analyze the data. WMO conceived of the study, supervised the entire
project, analyzed the data, and revised the manuscript. All authors read and
approved the final manuscript.
Author details
1
Division of Otolaryngology-Head and Neck Surgery, Department of Surgery,
University of California, San Diego, San Diego, CA, USA. 2Illumina Inc., San
Diego, CA 92121, USA. 3Veterans Administration Medical Center and
Department of Pathology, University of California, San Diego, La Jolla, CA,
USA. 4Hospital Universitario Donostia, San Sebastian, Spain.
Received: 19 June 2012 Accepted: 21 November 2012
Published: 24 November 2012
References
1. Ailles LE, Weissman IL: Cancer stem cells in solid tumors. Curr Opin
Biotechnol 2007, 18(5):460–466.
2. Al-Hajj M, Wicha MS, Benito-Hernandez A, Morrison SJ, Clarke MF:
Prospective identification of tumorigenic breast cancer cells. Proc Natl
Acad Sci U S A 2003, 100(7):3983–3988.
3. Reya T, Morrison SJ, Clarke MF, Weissman IL: Stem cells, cancer, and cancer
stem cells. Nature 2001, 414(6859):105–111.
4. Li X, Lewis MT, Huang J, Gutierrez C, Osborne CK, Wu MF, Hilsenbeck SG,
Pavlick A, Zhang X, Chamness GC, et al: Intrinsic resistance of tumorigenic
breast cancer cells to chemotherapy. J Natl Cancer Inst 2008,
100(9):672–679.
5. Gupta PB, Onder TT, Jiang G, Tao K, Kuperwasser C, Weinberg RA, Lander ES:
Identification of selective inhibitors of cancer stem cells by highthroughput screening. Cell 2009, 138(4):645–659.
6. Fuchs D, Heinold A, Opelz G, Daniel V, Naujokat C: Salinomycin induces
apoptosis and overcomes apoptosis resistance in human cancer cells.
Biochem Biophys Res Commun 2009, 390(3):743–749.
7. Matsumori N, Morooka A, Murata M: Conformation and location of
membrane-bound salinomycin-sodium complex deduced from NMR in
isotropic bicelles. J Am Chem Soc 2007, 129(48):14989–14995.
8. Creighton CJ, Chang JC, Rosen JM: Epithelial-mesenchymal transition
(EMT) in tumor-initiating cells and its clinical implications in breast
cancer. J Mammary Gland Biol Neoplasia 2010, 15(2):253–260.
9. Larue L, Bellacosa A: Epithelial-mesenchymal transition in development
and cancer: role of phosphatidylinositol 30 kinase/AKT pathways.
Oncogene 2005, 24(50):7443–7454.
Page 13 of 14
10. Li J, Zhou BP: Activation of beta-catenin and Akt pathways by Twist are
critical for the maintenance of EMT associated cancer stem cell-like
characters. BMC Cancer 2011, 11:49.
11. Martelli AM, Evangelisti C, Follo MY, Ramazzotti G, Fini M, Giardino R,
Manzoli L, McCubrey JA, Cocco L: Targeting the phosphatidylinositol
3-kinase/Akt/mammalian target of rapamycin signaling network in
cancer stem cells. Curr Med Chem 2011, 18(18):2715–2726.
12. Bachelder RE, Yoon SO, Franci C, de Herreros AG, Mercurio AM: Glycogen
synthase kinase-3 is an endogenous inhibitor of Snail transcription:
implications for the epithelial-mesenchymal transition. J Cell Biol 2005,
168(1):29–33.
13. Zhou BP, Deng J, Xia W, Xu J, Li YM, Gunduz M, Hung MC: Dual regulation
of Snail by GSK-3beta-mediated phosphorylation in control of epithelialmesenchymal transition. Nat Cell Biol 2004, 6(10):931–940.
14. Gulhati P, Bowen KA, Liu J, Stevens PD, Rychahou PG, Chen M, Lee EY,
Weiss HL, O'Connor KL, Gao T, et al: mTORC1 and mTORC2 regulate EMT,
motility, and metastasis of colorectal cancer via RhoA and Rac1 signaling
pathways. Cancer Res 2011, 71(9):3246–3256.
15. Mani SA, Guo W, Liao MJ, Eaton EN, Ayyanan A, Zhou AY, Brooks M,
Reinhard F, Zhang CC, Shipitsin M, et al: The epithelial-mesenchymal
transition generates cells with properties of stem cells. Cell 2008,
133(4):704–715.
16. Devraj Basu KTM, Li-Ping W, Gimotty PA, Rachel H, Alan Diehl J, Rustgi AK,
Lee JT, Kati R, Weinstein GS, Meenhard H: Detecting and targeting
mesenchymal-like subpopulations within squamous cell carcinomas.
Cell Cycle 2011, 10(12):2008–2016.
17. Prince ME, Sivanandan R, Kaczorowski A, Wolf GT, Kaplan MJ, Dalerba P,
Weissman IL, Clarke MF, Ailles LE: Identification of a subpopulation of cells
with cancer stem cell properties in head and neck squamous cell
carcinoma. Proc Natl Acad Sci U S A 2007, 104(3):973–978.
18. Abhold EL, Kiang A, Rahimy E, Kuo SZ, Wang-Rodriguez J, Lopez JP, Blair KJ,
Yu MA, Haas M, Brumund KT, et al: EGFR kinase promotes acquisition of
stem cell-like properties: a potential therapeutic target in head and neck
squamous cell carcinoma stem cells. PLoS One 2012, 7(2):e32459.
19. Chou TC: Drug combination studies and their synergy quantification
using the Chou-Talalay method. Cancer Res 2010, 70(2):440–446.
20. Chen J, Lozach J, Garcia EW, Barnes B, Luo S, Mikoulitch I, Zhou L, Schroth
G, Fan JB: Highly sensitive and specific microRNA expression profiling
using BeadArray technology. Nucleic Acids Res 2008, 36(14):e87.
21. Edgar R, Domrachev M, Lash AE: Gene expression omnibus: NCBI gene
expression and hybridization array data repository. Nucleic Acids Res 2002,
30(1):207–210.
22. Clay MR, Tabor M, Owen JH, Carey TE, Bradford CR, Wolf GT, Wicha MS,
Prince ME: Single-marker identification of head and neck squamous cell
carcinoma cancer stem cells with aldehyde dehydrogenase. Head Neck
2010, 32(9):1195–1201.
23. Chen YC, Chen YW, Hsu HS, Tseng LM, Huang PI, Lu KH, Chen DT, Tai LK,
Yung MC, Chang SC, et al: Aldehyde dehydrogenase 1 is a putative
marker for cancer stem cells in head and neck squamous cancer.
Biochem Biophys Res Commun 2009, 385(3):307–313.
24. Henry JC, Park JK, Jiang J, Kim JH, Nagorney DM, Roberts LR, Banerjee S,
Schmittgen TD: miR-199a-3p targets CD44 and reduces proliferation of
CD44 positive hepatocellular carcinoma cell lines. Biochem Biophys Res
Commun 2010, 403(1):120–125.
25. Fornari F, Milazzo M, Chieco P, Negrini M, Calin GA, Grazi GL, Pollutri D,
Croce CM, Bolondi L, Gramantieri L: MiR-199a-3p regulates mTOR and cMet to influence the doxorubicin sensitivity of human hepatocarcinoma
cells. Cancer Res 2010, 70(12):5184–5193.
26. Pan YZ, Morris ME, Yu AM: MicroRNA-328 negatively regulates the
expression of breast cancer resistance protein (BCRP/ABCG2) in human
cancer cells. Mol Pharmacol 2009, 75(6):1374–1379.
27. Saini S, Majid S, Yamamura S, Tabatabai L, Suh SO, Shahryari V, Chen Y,
Deng G, Tanaka Y, Dahiya R: Regulatory role of mir-203 in prostate
cancer progression and metastasis. Clin Cancer Res 2011,
17(16):5287–5298.
28. Clark AS, West K, Streicher S, Dennis PA: Constitutive and inducible Akt
activity promotes resistance to chemotherapy, trastuzumab, or
tamoxifen in breast cancer cells. Mol Cancer Ther 2002, 1(9):707–717.
29. Liu SQ, Yu JP, Yu HG, Lv P, Chen HL: Activation of Akt and ERK signalling
pathways induced by etoposide confer chemoresistance in gastric
cancer cells. Dig Liver Dis 2006, 38(5):310–318.
Kuo et al. BMC Cancer 2012, 12:556
/>
Page 14 of 14
30. Winograd-Katz SE, Levitzki A: Cisplatin induces PKB/Akt activation and p38
(MAPK) phosphorylation of the EGF receptor. Oncogene 2006,
25(56):7381–7390.
31. Boehmerle W, Endres M: Salinomycin induces calpain and cytochrome
c-mediated neuronal cell death. Cell Death Dis 2011, 2:e168.
32. Singh A, Settleman J: EMT, cancer stem cells and drug resistance: an
emerging axis of evil in the war on cancer. Oncogene 2010,
29(34):4741–4751.
33. Redmer T, Diecke S, Grigoryan T, Quiroga-Negreira A, Birchmeier W, Besser
D: E-cadherin is crucial for embryonic stem cell pluripotency and can
replace OCT4 during somatic cell reprogramming. EMBO Rep 2011,
12(7):720–726.
34. Li R, Liang J, Ni S, Zhou T, Qing X, Li H, He W, Chen J, Li F, Zhuang Q, et al:
A mesenchymal-to-epithelial transition initiates and is required for the
nuclear reprogramming of mouse fibroblasts. Cell Stem Cell 2010,
7(1):51–63.
35. Samavarchi-Tehrani P, Golipour A, David L, Sung HK, Beyer TA, Datti A,
Woltjen K, Nagy A, Wrana JL: Functional genomics reveals a BMP-driven
mesenchymal-to-epithelial transition in the initiation of somatic cell
reprogramming. Cell Stem Cell 2010, 7(1):64–77.
36. Bae KM, Parker NN, Dai Y, Vieweg J, Siemann DW: E-cadherin plasticity in
prostate cancer stem cell invasion. Am J Cancer Res 2011, 1(1):71–84.
37. Bae KM, Su Z, Frye C, McClellan S, Allan RW, Andrejewski JT, Kelley V,
Jorgensen M, Steindler DA, Vieweg J, et al: Expression of pluripotent stem
cell reprogramming factors by prostate tumor initiating cells. J Urol 2010,
183(5):2045–2053.
38. Dong TT, Zhou HM, Wang LL, Feng B, Lv B, Zheng MH: Salinomycin
selectively targets ‘CD133 +’ cell subpopulations and decreases
malignant traits in colorectal cancer lines. Ann Surg Oncol 2011,
18(6):1797–1804.
39. Ahn YH, Gibbons DL, Chakravarti D, Creighton CJ, Rizvi ZH, Adams HP,
Pertsemlidis A, Gregory PA, Wright JA, Goodall GJ, et al: ZEB1 drives
prometastatic actin cytoskeletal remodeling by downregulating miR-34a
expression. J Clin Invest 2012, 122(9):3170–3183.
doi:10.1186/1471-2407-12-556
Cite this article as: Kuo et al.: Salinomycin induces cell death and
differentiation in head and neck squamous cell carcinoma stem cells
despite activation of epithelial-mesenchymal transition and Akt. BMC
Cancer 2012 12:556.
Submit your next manuscript to BioMed Central
and take full advantage of:
• Convenient online submission
• Thorough peer review
• No space constraints or color figure charges
• Immediate publication on acceptance
• Inclusion in PubMed, CAS, Scopus and Google Scholar
• Research which is freely available for redistribution
Submit your manuscript at
www.biomedcentral.com/submit