A simple method for exploring adverse drug events in patients with different primary diseases using spontaneous reporting system
Bạn đang xem bản rút gọn của tài liệu. Xem và tải ngay bản đầy đủ của tài liệu tại đây (1.66 MB, 7 trang )
Noguchi et al. BMC Bioinformatics (2018) 19:124
/>
RESEARCH ARTICLE
Open Access
A simple method for exploring adverse
drug events in patients with different
primary diseases using spontaneous
reporting system
Yoshihiro Noguchi*, Anri Ueno, Manami Otsubo, Hayato Katsuno, Ikuto Sugita, Yuta Kanematsu, Aki Yoshida,
Hiroki Esaki, Tomoya Tachi and Hitomi Teramachi*
Abstract
Background: Patient background (e.g. age, sex, and primary disease) is an important factor to consider when
monitoring adverse drug events (ADEs) for the purpose of pharmacovigilance. However, in disproportionality
methods, when additional factors are considered, the number of combinations that have to be computed
increases, and it becomes very difficult to explore the whole spontaneous reporting system (SRS). Since the
signals need to be detected quickly in pharmacovigilance, a simple exploration method is required. Although
association rule mining (AR) is commonly used for the analysis of large data, its application to pharmacovigilance is rare
and there are almost no studies comparing AR with conventional signal detection methods.
Methods: In this study, in order to establish a simple method to explore ADEs in patients with kidney or liver injury as
a background disease, the AR and proportional reporting ratio (PRR) signal detection methods were compared. We
used oral medicine SRS data from the Japanese Adverse Drug Event Report database (JADER), and used AR as the
proposed search method and PRR as the conventional method for comparison. “Rule count ≥ 3”, “min lift value > 1”,
and “min conviction value > 1” were used as the AR detection criteria, and the PRR detection criteria were “Rule count
≥3”, “PRR ≥ 2”, and “χ2 ≥ 4”.
Results: In patients with kidney injury, the AR method had a sensitivity of 99.58%, specificity of 94.99%, and Youden’s
index of 0.946, while in patients with liver injury, the sensitivity, specificity, and Youden’s index were 99.57%, 94.87%,
and 0.944, respectively. Additionally, the lift value and the strength of the signal were positively correlated.
Conclusions: It was suggested that computation using AR might be simple with the detection power equivalent
to that of the conventional signal detection method as PRR. In addition, AR can theoretically be applicable to SRS
other than JADER. Therefore, complicated conditions (patient’s background etc.) that must take factors other than
the ADE into consideration can be easily explored by selecting the AR as the first screening for ADE exploration
in pharmacovigilance using SRS.
* Correspondence: ;
Laboratory of Clinical Pharmacy, Gifu Pharmaceutical University,
1-25-4,Daigakunishi, Gifu 501-1196, Japan
© The Author(s). 2018 Open Access This article is distributed under the terms of the Creative Commons Attribution 4.0
International License ( which permits unrestricted use, distribution, and
reproduction in any medium, provided you give appropriate credit to the original author(s) and the source, provide a link to
the Creative Commons license, and indicate if changes were made. The Creative Commons Public Domain Dedication waiver
( applies to the data made available in this article, unless otherwise stated.
Noguchi et al. BMC Bioinformatics (2018) 19:124
Background
Recently, due to advances in information technology, large
data have begun to be utilized in many fields. Among
them is the field of medical monitoring, where numerous
risk assessments of drugs have been reported using spontaneous reporting system (SRS), which are based on spontaneous reports of drug-adverse event (AE) pair
accumulated and published by regulatory authorities [1–
5].
Various risk assessment methods exist for evaluating
adverse drug events (ADEs) based on SRS data, including
those based on the proportional reporting ratio (PRR) [6],
which is used by the Medicines and Healthcare Products
Regulatory Agency (MHRA), and the reporting odds ratio
(ROR) [7], which is used by the Netherlands Pharmacovigilance Center Lareb. In addition, a Bayesian Confidence
Propagation Neural Network (BCPNN) -based method [8]
is used by the World Health Organization (WHO), and a
Gamma-Poisson Shrinker (GPS) -based method [9] is
used by the United States Food and Drug Administration
(FDA). These methods are all signal detection methods
used in disproportionality analysis, based on the principle
of inequality, focusing on differences in the ratio of the
number of reported drug-AE pairs.
If there is no causal relationship between the drug of
interest and the AE, the reporting ratio should be approximately the same as the average reporting ratio of
other medicines overall. If the reporting ratio of the drug
of interest is significantly higher than the average reporting ratio, it is indicative of an ADE, suggesting a causal
relationship between the drug and AE [10].
Since the PRR and the ROR are easy to calculate, it is
possible to detect an ADE at an early stage, and since
these methods are sensitive, there is little risk of missing
a true signal.
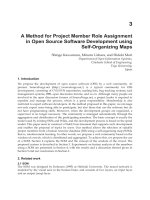
These methods use data from an SRS database to create “drug–AE pairs k × m contingency table”. In a typical
“drug–AE pairs 2 × 2 contingency table” the data are
classified into target drug, other drugs, target AE, and
other AEs, and the table is used to calculate a risk evaluation index as shown in Fig. 1.
When evaluating ADEs, patient background (e.g. age,
sex and primary disease) is another important factor
that should be taken into consideration. However, in
order to consider additional factors, the drug–AE pairs
2 × 2 contingency table must be prepared from a database
that extracts data for each factor, and signal indices must
be calculated. As a result, the number of combinations
becomes enormous, and it is very difficult to implement
the calculations efficiently. Thus, a simple signal detection
method that allows other factors to be easily considered is
urgently needed.
In large data analysis, association rule mining (AR) is
aimed at “enumerating interesting patterns hidden in the
Page 2 of 7
database” [11–13]. Several analysis methods using AR in
pharmacovigilance have recently been proposed [14–17],
but there are few reports comparing AR with conventional signal detection methods [17].
Therefore, in this study, in order to establish a simple
method for exploring ADEs in patients with kidney injury or liver injury as a primary disease, signal detection
using AR and PRR methods was compared.
Methods
We used the SRS dataset from the 1st quarter of 2004 to
the 4th quarter of 2015 from the Japanese Adverse Drug
Event Report database (JADER). The JADER was downloaded from Pharmaceuticals and Medical Devices Agency
and composed of four tables as follows: DEMO table (with
information on gender, age, and weight), DRUG table (with
information on suspect drug and concomitant drug), REAC
table (with information on AE and outcome), and HIST
table (containing medical history of primary diseases and
secondary diseases) [18]. Duplicate data and data for nonoral medications were removed from the JADER, and the
remaining 184,917 cases were analyzed.
Kidney injury and liver injury can affect drug metabolism,
so these primary diseases were considered. The AEs registered in the JADER are represented using the preferred
terms (PTs) from the Medical Dictionary for Regulatory
Activities (MedDRA). We extracted all of the data for each
PT included in the standardized MedDRA Queries (SMQ)
for kidney injury and liver injury, which are standard search
formulae for MedDRA. The methods used to extract the
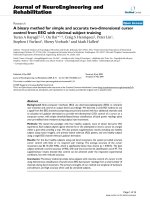
data from the JADER are illustrated in Fig. 2.
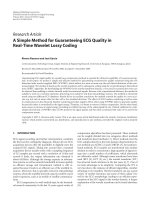
In this study, we used “lift” and “conviction” as the detection criteria for searching the association rule “A ∩ B → C”,
where A is the drug, B is the primary disease, and C is the
AE. The calculation methods are shown in Fig. 3 and formula (1) and (2).
lift ðA∩B→CÞ ¼ confidence ðA∩B→CÞ=support ðCÞ
¼ ðnAB1 =nABþ Þ=ðnþ1 =nþþ Þ
ð1Þ
conviction ðA∩B→CÞ
¼ ð1–Support ðCÞ=ð1–Confidence ðA∩B→CÞ Þ
¼ ð1–nþ1 =nþþ Þ=ð1–nAB1 =nABþ Þ
ð2Þ
“Lift” is an index that indicates the relative magnitude
of the probability of observing C under the condition of
A ∩ B, compared to the overall probability of observing
C. When the lift value is 1, the two events A ∩ B and C
are independent of each other. When the lift value is
greater than 1, the two events A ∩ B and C are not
Noguchi et al. BMC Bioinformatics (2018) 19:124
Fig. 1 Create the drug–AE k × m contingency table to 2 × 2 contingency table for signal detection
Fig. 2 Database processing for AR mining and mining by signal detection considered about primary disease
Page 3 of 7
Noguchi et al. BMC Bioinformatics (2018) 19:124
Page 4 of 7
Fig. 3 The calculation of AR for the Venn diagram and the drug–AE pairs 4 × 2 contingency table
independent, and the higher the value, the greater the
relevance of the interaction [19].
On the other hand, “conviction” is an indicator that
evaluates whether or not the rule makes a wrong prediction, paying particular attention to the exclusion event
of the conclusion part of the obtained rule. If the conviction value is large, it is less likely that the conclusion C
is not true for the premise A ∩ B [20].
In general, lift > 1 is used as the detection standard for
the AR method, but conviction > 1 was also used in this
study. Furthermore, “Rule count (nAB 1) ≥ 3” was also
used according to the detection criteria of the PRR
method for comparison.
In addition, in order to verify the accuracy of the signal
detected by the AR method, we compared it with the signal detected using the PRR method, which is a conventional signal detection method. As shown in Figs. 2 and 4
Fig. 4 The calculation of PRRDrug
A with Hist B
and formula (3) and (4), the PRR signal value is calculated
from “the drug–AE pairs 2 × 2 contingency table” for each
case. In the data set, Drug A, Hist B and AE C can be represented by the Venn diagram shown in Fig. 3, but only
the part limited to Hist B shown in Fig. 4 is used for calculation of PRR value. The calculation method of PRR is
similar to risk ratio which is a general statistical index. According to the criteria of MHRA, the detection standard
for the PRR method is “Rule count (nAB 1) ≥ 3”, “PRR ≥
2”, and “χ2 ≥ 4” [6].
Since there were no simulation data in this study, there
are no complete data of true risk. Therefore assuming that
the signal detected by PRR is true risk, the accuracy of signal detection using the AR method was examined using
sensitivity, specificity, Youden’s index, positive predictive
value (PPV), negative predictive value (NPV), receiver operating characteristic (ROC) curve and area under the ROC
for the Venn diagram and the drug–AE 2 × 2 contingency table
Noguchi et al. BMC Bioinformatics (2018) 19:124
Page 5 of 7
curve (AUC). However, based on the assumption, the cutoff
value was not calculated in this study.
Furthermore, the correlation which was investigated
using a single regression line between the lift value of the
AR method and the signal intensity of the PRR method
was also examined (Fig. 4). When examining this correlation, the signal intensity of the PRR is expressed as “log
PRR + log χ2”, as proposed by Takagi et al. [15].
PRRDrug A with Hist B ¼ ðnAB1 =nABþ Þ=ðnB1 =nBþ Þ
ð3Þ
χ2 ¼ ðnABþ þ nBþ ÞfjnAB1 nB2 −nAB2 nB1 j−ðnABþ þ nBþ Þ=2g2
=fðnABþ nBþ ðnAB1 þ nB1 Þ ðnAB2 þ nB2 Þg
ð4Þ
Data management and analyses were performed using
Visual Mining Studio software (version 8.1; Mathematical Systems, Inc. Tokyo, Japan). Drawing the ROC curve
and AUC calculation were performed using JMP 11.2.0
(SAS Institute Inc.)
Results
Among all the cases analyzed (184,917 cases), there were
18,252 cases (24,463 drug–ADE pairs) of kidney injury,
and 23,183 cases (23,460 drug–ADE pairs) of liver injury. The number of signals detected for the ADEs using
the PRR was 2371 drug–ADE pairs for kidney injury,
and 2303 pairs for liver injury.
Table 1 shows the signal detection power of AR for
each primary diseases. For kidney injury, the sensitivity
was 99.58%, specificity was 94.99%, Youden’s index was
0.946, PPV was 68.08%, and NPV was 99.95%. For liver
injury, the sensitivity was 99.57%, specificity was 94.87%,
Youden’s index was 0.944, PPV was 67.88%, and NPV
was 99.95%.
Figure 5 shows the ROC curve. For kidney injury, the
AUC was 0.974, and for liver injury, the AUC was 0.940.
Figure 6 shows the correlation between the lift value and
PRR signal intensity. The decision coefficient (R2) = 0.
649 for kidney injury and R2 = 0.708 for liver injury.
Discussion
Although there are several reports of previous studies on
the exploration of ADEs using SRS, reports that consider
Table 1 Ability of AR to detect signals for primary diseases
Primary
diseases
Sensitivity
(%)
Specificity
(%)
Youden’s
index
PPV
(%)
NPV
(%)
Kidney injury
99.58
94.99
0.946
68.08
99.95
Liver injury
99.57
94.87
0.944
67.88
99.95
AR association rule mining, PPV positive predictive value, NPV negative
predictive value
factors other than the drug–AE pairs, such as the primary
disease affecting the patient, are limited. The reason for
this is that in disproportionality methods, considering
additional factors requires an enormous number of combinations to be taken into account when signal detection
is performed and the respective risk indicators are calculated. Therefore, considering additional factors seems to
be impractical as an exploration method.
A potential solution to this issue would be to utilize
AR. However, although AR is often used to efficiently
analyze large data, there are only a few examples of it
being used in the medical field, especially in SRS analysis
[14–17]. Signal detection using AR has already been validated as an effective method for the initial identification
of “multi-item ADEs” in a study by Harpaz et al. [14].
Furthermore, although information on primary diseases
was not included similar to this study, the use of AR in
drug–AE pairs was compared with the conventional signal detection method by Wang et al. [17]. Currently, signal detection using AR is not used in pharmacovigilance
at regulatory authorities, but is considered very useful
for performing complicated analysis considering the patient’s background as primary disease.
Therefore, in this study, kidney injury or liver injury as
primary disease was considered in addition to the drug–
AE pairs, and signal detection was performed using AR
method. The conventional PRR method was also used,
and the signal detection powers of each method were
compared.
In this study, the detection criteria for AR were nAB 1 ≥
3, lift > 1, and conviction > 1. For kidney or liver injury, in
the AR method, both sensitivities were greater than 99%,
and both specificities were greater than 94%. The same
detection results were also obtained using the PRR
method, indicating that the detection powers of the AR
and PRR methods are similar. In addition, the AUC was 0.
974 for kidney injury and 0.940 for liver injury. These high
values suggest that the AR method is also highly accurate.
However, the NPV was greater than 99.9% for both
kidney and liver injury, but the PPV was only 68.08% for
kidney injury and 67.88% for liver injury.
These results suggest that the AR method may have
detected signals that could not be detected by the conventional PRR method. However, unfortunately, we cannot prove our hypothesis, because we did not have “the
true risk”. The true risk dataset containing “unknown
AEs” does not exist.
Because SRS is the result of voluntary reporting and is
influenced by reporting bias including underreporting,
and the value of the signal easily changes depending on
the timing of the analysis, signal detection is not necessarily the true risk, but is limited to the hypothesis of risk. In
other words, PRR signals and AR signals are limited to the
hypothesis of risk, but they are not the true risk.
Noguchi et al. BMC Bioinformatics (2018) 19:124
Page 6 of 7
Fig. 5 The ROC curve and AUCs for each primary diseases
The detected signals are hypotheses to be clinically noticed until pharmacologic verification is completed. For
the AR method to be an alternative to the PRR method,
a correlation with the magnitude of the signal value is
desirable.
The magnitude of the lift values as AR signals and the
PRR signals intensity are positively correlated. Thus, the
correlation of the signal values of each method also makes
the AR method easy to use for pharmacovigilance.
The conventional PRR method involves extracting data
for each of the primary diseases, as shown in Figs. 1, 2
and 4, and constructing a 2 × 2 drug–AE k × m table. If a
similar calculation method as shown in Figs. 2 and 3 that
simply creates combinations from the database was used
for AR method, the number of the combinations considered would be enormous and it would be difficult to calculate within a realistic time, even if AR method is used.
However, in the AR method, the “apriori algorithm”
can be used to reduce the number of calculations. The
apriori algorithm is based on the principle that “support
of a certain item set is always less than or equal to
support of its partial item set” [12]. Therefore, it is unnecessary to calculate the risk index for all combinations, which is required in the conventional method.
In this study, the AR method proposed also requires
verification for primary diseases other than kidney injury
and liver injury. However, it was suggested that computation using the “apriori algorithm” of AR method might
be simple with the detection power equivalent to that of
the conventional PRR method.
Conclusion
The use of post-marketing drugs is complicated, and unlike clinical trials, background factors of patients are diverse. In addition, the frequency of occurrence of ADEs
in clinical trial is not known, and there are ADEs that
occur over a period longer than the duration of the clinical trial.
SRS analysis using signal detection enables the exploration of unknown ADEs not found in clinical trials and
safety assessments in specific populations. It is possible to
evaluate safety reflecting the actual clinical use situation.
Fig. 6 Relation between log lift value and log PRR + log χ2 for each primary diseases
Noguchi et al. BMC Bioinformatics (2018) 19:124
In addition, SRS has played a major role in pharmaepidemiological studies centered on drug safety assessment.
The PRR, which is a conventional signal detection
method, is suggestive of ADEs; a similar detection tendency was observed for the AR method. Then, the signal
value should be calculated quickly for pharmacological
and clinical research. Therefore, in order to reveal the true
risk, further pharmacological and clinical research is
needed based on the hypothesis obtained. If the method
of signal detection is simplified, it will be possible to detect
more unknown ADE at an early stage. This is considered
important for conducting pharmacological and clinical
verification.
In this study, it was suggested that computation using
AR method might be simple with the detection power
equivalent to that of the conventional signal detection
method. In addition, AR method can theoretically be
applicable to SRS other than JADER. Therefore, complicated conditions (patient’s background etc.) that must
take factors other than the AE–drug pairs into consideration can be easily explored by selecting the AR method
as the first screening in pharmacovigilance using SRS.
Abbreviations
ADE: Adverse drug event; AE: Adverse event; AR: Association rule mining;
AUC: Area under the ROC curve; BCPNN: Bayesian Confidence Propagation
Neural Network; FDA: Food and Drug Administration; GPS: Gamma-Poisson
Shrinker; JADER: the Japanese Adverse Drug Event Report database;
MedDRA: Medical Dictionary for Regulatory Activities; MHRA: Medicines and
Healthcare Products Regulatory Agency; NPV: Negative predictive value;
PPV: positive predictive value; PRR: Proportional reporting ratio; PT: Preferred
term; ROC: Receiver operating characteristic; ROR: Reporting odds ratio;
SMQ: Standardized MedDRA Queries; SRS: Spontaneous reporting system;
WHO: World Health Organization
Acknowledgements
This study was carried out with the aid of JSPS scientific research fund
16 K19175.
Funding
JSPS scientific research fund 16 K19175.
Availability of data and materials
Authors do not own the data because the Japanese authority, PMDA, does not
does not permit sharing the Japanese Adverse Drug Event Report database
(JADER) directly. Data owned by PMDA can be accessed directly here: http://
www.info.pmda.go.jp/fukusayoudb/CsvDownload.jsp (only in Japanese).
Authors’ contributions
Conceived and designed the experiments: YN, HT. Performed the experiments:
YN, AU, MO HK. Analyzed the data: YN, IS, YK, AY, HE. Contributed reagents/
materials/analysis tools: YN, HT, TT. Wrote the paper: YN, HT. All authors read
and approved the final manuscript.
Ethics approval and consent to participate
Not applicable
Consent for publication
Not applicable
Competing interests
The authors declare that they have no competing interests.
Page 7 of 7
Publisher’s Note
Springer Nature remains neutral with regard to jurisdictional claims in
published maps and institutional affiliations.
Received: 16 May 2017 Accepted: 26 March 2018
References
1. Poluzzi E, Raschi E, Koci A, Moretti U, Spina E, Behr ER, Sturkenboom M, De
Ponti F. Antipsychotics and torsadogenic risk: signals emerging from the US
FDA adverse event reporting system database. Drug Saf. 2013;36(6):467–79.
2. Fujimoto M, Hosomi K, Takada M. Statin-associated lower urinary tract
symptoms: data mining of the public version of the FDA adverse event
reporting system, FAERS. Int J Clin Pharmacol Ther. 2014;52(4):259–66.
3. Noguchi Y, Esaki H, Asano S, Yokoi T, Usui K, Kato M, Saito K, Tachi T,
Teramachi H. Analysis of effects of the diuretics on levels of blood
potassium and blood sodium with angiotensin receptor blockers and
thiazide diuretics combination therapy: data Mining of the Japanese
Adverse Drug Event Report Database, JADER. Jpn J Pharm Health Care Sci.
2015;41(7):488–96.
4. Ali TB, Schleret TR, Reilly BM, Chen WY, Abagyan R. Adverse effects of
cholinesterase inhibitors in dementia, according to the Pharmacovigilance
databases of the United-States and Canada. PLoS One. 2015;10(12):
e0144337. />5. Gahr M, Connemann BJ, Schönfeldt-Lecuona C, Zeiss R. Sensitivity of Quantitative
Signal Detection in Regards to Pharmacological Neuroenhancement. Int J Mol
Sci. 2017;18(1) />6. Evans SJ, Waller PC, Davis S. Use of proportional reporting ratios (PRRs) for
signal generation from spontaneous adverse drug reaction reports.
Pharmacoepidemiol Drug Saf. 2001;10(6):483–6.
7. van Puijenbroek EP, Bate A, Leufkens HG, Lindquist M, Orre R, Egberts AC. A
comparison of measures of disproportionality for signal detection in
spontaneous reporting systems for adverse drug reactions.
Pharmacoepidemiol Drug Saf. 2002;11(1):3–10.
8. Bate A, Lindquist M, Edwards IR, Olsson S, Orre R, Lansner A, De Freitas RM.
A Bayesian neural network method for adverse drug reaction signal
generation. Eur J Clin Pharmacol. 1998;54(4):315–21.
9. Szarfman A, Machado SG, O'Neill RT. Use of screening algorithms and computer
systems to efficiently signal higher-than-expected combinations of drugs and
events in the US FDA's spontaneous reports database. Drug Saf. 2002;25(6):381–92.
10. Zorych I, Madigan D, Ryan P, Bate A. Disproportionality methods for
pharmacovigilance in longitudinal observational databases. Stat Methods
Med Res. 2013;22(1):39–56.
11. Agrawal R, Imieliński T, Swami A. Mining association rules between sets of
items in large databases. ACM SIGMOD Rec. 1993;22(2):207–16.
12. Agrawal R, Srikant R. Fast algorithms for mining association rules. In
Proc20thintconf very large databases. 1994;1215:487–99.
13. Lenca P, Meyer P, Vaillant B, Lallich S. On selecting interestingness measures
for association rules: user oriented description and multiple criteria decision
aid. Eur J Oper Res. 2008;184(2):610–26.
14. Harpaz R, Chase HS, Friedman C. Mining multi-item drug adverse effect
associations in spontaneous reporting systems. BMC Bioinformatics. 2010;11
/>15. Shirakuni Y, Okamoto K, Kawashita N, Yasunaga T, Takagi T. Signal detection
of drug complications applying association rule learning for StevensJohnson syndrome. J Com Aid Chem. 2009;10:118–27.
16. Fujiwara M, Kawasaki Y, Yamada H. A Pharmacovigilance approach for postMarketing in Japan Using the Japanese adverse drug event report (JADER)
database and association analysis. PLoS One. 2016;11(4):e0154425. https://
doi.org/10.1371/journal.pone.0154425.
17. Wang C, Guo XJ, Xu JF, Wu C, Sun YL, Ye XF, Qian W, Ma XQ, Du WM, He J.
Exploration of the association rules mining technique for the signal
detection of adverse drug events in spontaneous reporting systems. PLoS
One. 2012;7(7):e40561. />18. The Japanese Adverse Drug Event Report database (JADER). [http://www.
info.pmda.go.jp/fukusayoudb/CsvDownload.jsp] (in Japanese only).
19. Hahsler M, Grün B, Hornik K. Arules - a computational environment for mining
association rules and frequent item sets. J Stat Soft. 2005;14(15):1–25.
20. Brin S, Motwani R, Ullman JD, Tsur S. Dynamic itemset counting and
implication rules for market basket data. ACM SIGMOD Rec. 1997;26(2):255–64.