Incorporating biological information in sparse principal component analysis with application to genomic data
Bạn đang xem bản rút gọn của tài liệu. Xem và tải ngay bản đầy đủ của tài liệu tại đây (593.13 KB, 12 trang )
Li et al. BMC Bioinformatics (2017) 18:332
DOI 10.1186/s12859-017-1740-7
METHODOLOGY ARTICLE
Open Access
Incorporating biological information in
sparse principal component analysis with
application to genomic data
Ziyi Li1 , Sandra E. Safo1 and Qi Long2*
Abstract
Background: Sparse principal component analysis (PCA) is a popular tool for dimensionality reduction, pattern
recognition, and visualization of high dimensional data. It has been recognized that complex biological mechanisms
occur through concerted relationships of multiple genes working in networks that are often represented by graphs.
Recent work has shown that incorporating such biological information improves feature selection and prediction
performance in regression analysis, but there has been limited work on extending this approach to PCA. In this article,
we propose two new sparse PCA methods called Fused and Grouped sparse PCA that enable incorporation of prior
biological information in variable selection.
Results: Our simulation studies suggest that, compared to existing sparse PCA methods, the proposed methods
achieve higher sensitivity and specificity when the graph structure is correctly specified, and are fairly robust to
misspecified graph structures. Application to a glioblastoma gene expression dataset identified pathways that are
suggested in the literature to be related with glioblastoma.
Conclusions: The proposed sparse PCA methods Fused and Grouped sparse PCA can effectively incorporate prior
biological information in variable selection, leading to improved feature selection and more interpretable principal
component loadings and potentially providing insights on molecular underpinnings of complex diseases.
Keywords: Principal component analysis, Sparsity, Structural information, Genomic data
Background
A central problem in high-dimensional genomic research
is to identify a subset of genes and pathways that can help
explain the total variation in high-dimensional genomic
data with as little loss of information as possible. Principal
component analysis (PCA) [1] is a popular multivariate analysis method which seeks to concentrate the total
information in data with a few linear combinations of the
available data, making it an appropriate tool for dimensionality reduction, data analysis, and visualization in
genomic research. Despite its popularity, the traditional
PCA is often difficult to interpret as the principal component loadings are linear combinations of all available
*Correspondence:
Department of Biostatistics, Epidemiology and Informatics, Perelman School
of Medicine, University of Pennsylvania, 423 Guardian Drive, 19104
Philadelphia, PA, USA
Full list of author information is available at the end of the article
2
variables, the number of which can be very large for
genomic data. It is therefore desirable to obtain interpretable principal components that use a subset of the
available data to deal with the problem of interpretability
of principal component loadings.
Several alternatives to PCA have been proposed in the
literature, most of which constrain the size of non-zero
principal component loadings. An ad hoc approach sets
the absolute value of loadings that are smaller than a
threshold to zero. Though simple to understand, this
approach has been shown to be misleading in the sense
that magnitude of loadings is not the only factor to determine the importance of variables in a linear combination
[2]. Truncating PCs by loadings may result in quite different PCs explaining much smaller variation compared with
the original PCs. Other approaches regularize the loadings
to ensure that some are exactly zero, which implies that
the corresponding variables are unimportant in explaining
© The Author(s). 2017 Open Access This article is distributed under the terms of the Creative Commons Attribution 4.0
International License ( which permits unrestricted use, distribution, and
reproduction in any medium, provided you give appropriate credit to the original author(s) and the source, provide a link to the
Creative Commons license, and indicate if changes were made. The Creative Commons Public Domain Dedication waiver
( applies to the data made available in this article, unless otherwise stated.
Li et al. BMC Bioinformatics (2017) 18:332
the total variation in the data. For instance, Jolliffe et al. [3]
proposed the SCotLass method that constrains the loadings with a lasso penalty, but their optimization problem
is nonconvex, which is difficult to solve and does not
guarantee convergence to a global solution. Zou et al. [4]
proposed a convex sparse PCA method (SPCA) that reformulates the PCA problem as a regression problem and
imposes elastic net penalty on the PC loadings. Witten
and Tibshirani [5] also proposed the penalized matrix
decomposition (PMD) that approximates the data with its
spectral decomposition and imposes a lasso penalty on
the right singular vectors, i.e., the principal component
loadings.
Although the aforementioned methods can effectively
produce sparse principal component coefficients, their
main limitation is that they are purely data driven and do
not exploit available biological information such as gene
networks. It has been recognized that complex biological mechanisms occur through concerted relationships
of multiple genes working together in pathways. Recent
work [6, 7] has demonstrated in the regression setting
that utilizing prior biological information among variables can improve variable selection and prediction and
help gain a better understanding of analysis results. It is
therefore desirable to conduct PCA with incorporation of
known structural information. Allen et al. [8] proposed
a generalized least-square matrix decomposition framework for PCA that incorporates known structure of noise
and generate sparse solutions. Although this method can
flexibly account for noise structure in data, they do not
utilize prior biological information, and do not consider
the relationships among the signal variables in PCA.
Jenatton et al. [9] proposed a structured sparse PCA
method that considers correlations among groups of variables and imposes a penalty similar to group lasso on
the principal component loadings, but their method does
not take into account the complex interactions among
variables within a group. In this article, we proposed
two new sparse PCA methods called Fused and Grouped
sparse PCA that enable incorporation of prior biological
information in PCA. The methods will allow for identification of genes and pathways. We generalize fused lasso
[10] and utilize Lγ norm [7] to achieve automatic variable selection and simultaneously account for complex
relationships within pathways.
Our work makes several contributions. To the best of
our knowledge, this is the first attempt to impose both
sparsity and smoothing penalties on principal component
loadings to encourage the selection of variables that are
connected in a network. Although Jenatton et al. [9] and
Shiga and Mamitsuka [11] incorporated group information of variables when generating sparse PC solutions,
they did not consider how variables are connected in
each group . Our method considers not only the group
Page 2 of 12
information, but also any interaction structure of variables within a group. By utilizing the existing biological
structure in the data, we are able to obtain sparse principal components that are more interpretable and may shed
light on the underlying complex mechanisms in the data.
We also develop an efficient algorithm that can handle
high-dimensional problems. Simulation studies suggest
that the methods have higher sensitivity and specificity
in detecting true signals and ignoring noise variables, and
are quite effective in improving the performance of sparse
PCA methods when the graph structure is correctly specified. In addition, the proposed methods are robust to
misspecified graph structure.
The remainder of the paper is organized as follows. In
“Methods” section, we present methods and algorithms
for the proposed sparse PCA. In “Results” section, we conduct simulation studies to assess the performance of our
methods in comparison with several existing sparse PCA
methods. In “Analysis of Glioblastoma data” section, we
apply the proposed methods to data from a glioblastoma
brain multiform study. We conclude with some discussion
remarks in “Discussions” section.
Methods
Suppose that we have a random n × p matrix X =
(x1 , . . . , xp ), x ∈ n . We also assume that the predictors
are centered to have column means zero. The network
informaton for the p variables in X is represented by a
weighted undirected graph G = (C, E, W ), where C is the
set of nodes corresponding to the p features, E = {i ∼ j} is
the set of edges indicating that features i and j are associated in a biologically meaningful way, and W includes the
weight of each node. For node i, denote by di its degree,
i.e., the number of nodes that are directly connected to
node i and by wi = f (di ) its weight which can depend
on di . Our goal is to obtain sparse PCA loadings while
utilizing available structural information G in PCA. Our
approach to the sparse PCA problem relies on the eigenvalue formulation of PCA, and for completeness sake, we
briefly review the classical and sparse PCA problems.
Standard and sparse principal component analysis
Classical PCA finds projections α ∈ p such that the
variance of the standardized linear combination Xα is
maximized. Mathematically, the first principal component
loading α solves the optimization problem
max α T XT Xα subject to α T α = 1.
α=0
(1)
For subsequent principal components, additional constraints are added to ensure that they are uncorrelated with previous principal components, so that each
principal component axis captures different information
Li et al. BMC Bioinformatics (2017) 18:332
Page 3 of 12
in the data. Generally, for the rth PC, we have the
optimization problem
max
α r =0
T
αT
r X Xα r
(2)
T
subject to α T
r α r = 1, α s α r = 0
∀s < r, r = 2, . . . , q
min(p, n − 1).
(3)
Then the rth principal component loadings of X is the
rth eigenvector that corresponds to the rth eigenvalue
λ˜ 1 ≥ · · · ≥ λ˜ r ≥ · · · ≥ 0 of the sample covariance matrix
XT X. Of note, the magnitude, αrk of each principal component loading α˜ r =[ αr1 , . . . , αrk , . . . , αrp ] represents the
importance of the kth variable to the rth principal component, and these are typically nonzero. When p
n,
interpreting the principal components is a difficult task
because the principal components are linear combinations of all variables. Thus for high-dimensional data, a
certain type of regularization that ensures that some variables have negligible or no effect on the rth principal
component is warranted to yield interpretable principal
components.
To achieve sparsity of the principal component loadings while incorporating structural information G , we
utilize ideas in Safo and Ahn [12] which is motivated
by the Dantzig Selector for sparse estimation in regression problems. Specifically, we bound a modified version
of the eigenvalue difference in (3) with a l∞ norm while
minimizing a structured-sparsity inducing penalty of the
principal component loadings:
minP (α, τ ) subject to XT Xα˜ r − λ˜ r α
α=0
∞
The first approach we propose is the grouped sparse PCA,
similar in spirit with Pan et al. [7]. Utilizing the graph
structure G , we propose the following structured sparse
PCA criterion for the rth principal component loading:
min
Using Lagrangian multipliers, one can show that problem (2) results in the eigenvalue problem
XT Xα = λα.
Grouped sparse PCA
≤τ
and AT
r−1 α = 0.
Here, for a random vector z ∈ p , z ∞ is the l∞ norm
defined as max1≤i≤p |zi |, τ > 0 is a tuning parameter
that controls how many of the coefficients in the principal component loadings will be exactly zero. In addition,
A =[ αˆ 1 , . . . , αˆ s ] ∀s < r is a concatenation of the previous
sparse PCA solutions αˆ s , and α˜ r is the nonsparse rth PCA
loading, which is the eigenvector corresponding to the rth
largest eigenvalue λˆ r of XT X.
There are a few advantages of this new formulation
over the standard formulation for PCA. First, the objective
function P (α, τ ) can easily incorporate the prior information about the PC loadings, for example, the structural
information of variables. Second, this optimization problem can be easily solved by any off-the-shelf optimization
software given P (α, τ ) is a convex function, e.g. CVX in
Matlab. In the next sections, we introduce sparse PCA
methods that utilize the network information G in X.
α=0
(1 − η)
subject to
i∼j
|αi |γ
wi
+
|αj |γ
wj
XT Xα˜r − λ˜ r α
1/γ
∞
+η
di =0 |αi |
(4)
≤ τ and AT
r−1 α = 0,
where · ∞ is the l∞ norm , τ > 0 is a tuning parameter,
γ > 1 and 0 < η < 1 are fixed, Ar−1 = (αˆ 1 , αˆ 2 , . . . , αˆ r−1 )
is the matrix constituted of r − 1 structured sparse PC
loadings, and α˜ r is the rth nonsparse PC loading vector,
which is the eigenvector corresponding to the rth largest
eigenvalue of XT X.
The first term in the objective function (4) is the
weighted grouped penalty of Pan et al. [7], which induces
grouped variable selection. The penalty encourages both
αi and αj to be equal to zero simultaneously, suggesting
that two neighboring genes in a network are more likely to
participate in the same biological process simultaneously.
The second term in the objective function induces sparsity in selection of singletons that are not connected to
any other variables in the network. The tuning parameter
τ enforces some coefficients of the principal components
to be exactly zero with larger values encouraging more
sparsity. The selection of τ is usually data-driven, and
is discussed in section 2.4. The optimization problem is
convex in α and can be solved with any off the shelf
convex optimization package such as the CVX package
[13] in Matlab.
Fused sparse PCA
The second structured sparse PCA is the Fused sparse
PCA, which generalizes fused lasso [10] to account for
complex interactions within a pathway. Utilizing the graph
structure G , we propose the following structured sparse
PCA for the rth principal component loading:
min
α=0
(1 − η)
subject to
αi
i∼j wi
−
αj
wj
XT Xα˜ r − λ˜ r α
+η
∞
di =0 |αj |
(5)
≤ τ and AT
r−1 α = 0
where τ > 0 is tuning parameters, 0 ≤ η ≤ 1 is fixed,
Ar−1 = (αˆ 1 , αˆ 2 , . . . , αˆ r−1 ) is the matrix constituted of
r − 1 structured sparse PC loadings, and α˜ r is the rth
nonsparse PC loading vector. This penalty is a combination of weighted l1 penalty on variables that are connected
in the network and l1 penalty on singletons that are not
connected to any genes in the network. The first term in
the objective function (5) is the fused structured penalty
that encourages the difference between variable pairs that
are connected in the network to be small and hence the
variables to be selected together.
Li et al. BMC Bioinformatics (2017) 18:332
Page 4 of 12
This penalty is similar to some existing penalties, but
different in a number of ways. First, it is similar to the
fused lasso—both attempt to smooth the coefficients that
are connected in G . However, the fused lasso does not
utilize prior biological information. Instead, it uses a datadriven clustering approach to order the variables that
are correlated and imposes l1 penalty on the difference
between coefficients of adjacent variables. It also does
not weight neighboring features, which may allow one to
enforce various prior relationships among features. Second, the Fused sparse penalty is also similar but different
to the network constrained penalty of Li and Li [6]. Their
α
2
penalty η1 j |αj | + η2 i∼j wαii − wjj uses the l2 norm
and it has been shown that this does not produce sparse
solutions, where sparsity refers to variables that are connected in a network. In other words, it does not encourage
grouped selection of variables in the network [7]. Also,
the additional tuning parameter η2 increases computational costs for very large p since it requires solving
a graph-constrained regression problem with dimension
(n + p) × p.
The two proposed methods differ in how the structural information is incorporated in the PCA problem.
Grouped sPCA is dependent on γ in the Lγ norm and
have different sparsity solution in the PC loadings for
different γ . Unlike the Fused sPCA, the weights in the
Grouped sPCA allow for two neighboring nodes to have
opposite effects, which may be relevant in some biological
process. However, in the Fused sPCA, it is easy to understand that the l1 norm difference of connected pairs allows
variables that are connected or behave similarly to be close
together, which is not so intuitive in the Grouped sPCA.
Algorithms
We present two algorithms for the proposed structured
sparse PCA methods. Algorithm 1 obtains the rth principal component loading vector for a fixed tuning parameter
τ . Algorithm 2 provides a data driven approach for selecting the optimal tuning parameter value τ from a range of
values. The normalization in step (3) of Algorithm 1 eases
interpretation, and usually facilitates a visual comparison
of the coefficients. Once the principal component loading
vector is obtained, the coefficients (in absolute value) can
be ranked to assess the contribution of the variables to a
given PC. Both our methods require the data to be centered (column-centered for a n × p matrix) so that PCA
can be conducted on covariance matrix. If the variables
are measured on different scales or on a common scale
with widely differing ranges, it is recommended to center and scale the variables to have unit variance before
implementing the proposed methods.
Algorithm 1 is developed to obtain r PC loading vectors. For the best r, we can introduce tuning parameter
Algorithm 1 Optimization for r structured sparse PC
˜ r and
1: Initialize α r and λr with nonsparse estimates α
λ˜ r : solve the eigen-decomposition of XT X. α˜ r is the
rth eigen-vector corresponding to the rth largest
eigen-value λ˜ r of XT X.
2: Given a fixed positive tuning parameter τ and prespecified parameters η and γ , solve problem (4) or (5)
using optimization package for the rth Grouped sPC
or Fused sPC vector, αˆ r .
ˆ r : αˆ r = αˆαˆ r .
3: Normalize α
r 2
Algorithm 2 Selecting optimal tuning parameter
1: for each τ in a set of fine grid from (0, τmax ), and for
a desired number of principal components r, do
(i) Apply Algorithm 1 on X to derive the r th
ˆ r (τ ). Then
principal component loadings A
ˆ r (τ ) to obtain the best
project X onto A
ˆ r (τ ).
principal components as Yr (τ ) = XT A
(ii) Calculate the BIC value defined as
BIC(τ ) = log
1
ˆT
X − Yr (τ )A
r (τ )
np
F
+
γτ log(np)
np
(6)
where · F is the Frobenius norm and γτ is
ˆ r (τ ).
the number of non-zero components of A
2:
3:
end for
Select the optimal tuning parameter as τopt
minτ {BIC(τ )}.
=
selection in step (2) using, for example cross validation
to maximize the total variance explained by the rth principal component, with the smallest r explaining some
proportion of variance explained selected as the optimal
rth principal component. This would add extra layer of
complexity to the tuning parameter selection, however.
The tuning parameters τ = (τ1 , . . . τr ) control the
model complexity and their optimal values need to be
selected. We use Bayesian information criterion (BIC) [8]
and implement Algorithm 2 to select τ that yields a better rank r approximation to the test data. Compared with
using cross-validation to select best tuning parameters,
BIC can be computationally more efficient, especially for
large datasets. The selection of the other tuning parameters in our experiments are described as follows. We fix
η = 0.5 for an equal likelihood of selecting networks and
singletons. Since Pan et al. [7] chose gamma=2 and 8 and
showed that these two gamma values achieved good performance, we fix γ = 2 for both the simulation study
and the real data analysis and we also compare in a subset of simulations γ = 2 and γ = 8 (see Additional file 1:
Li et al. BMC Bioinformatics (2017) 18:332
Page 5 of 12
Tables S1 and S2) to assess whether the results are robust
to the gamma value. We set wi and wj as the degree
of each node following the suggestion in Pan et al. [7].
Our paper seeks to develop methods for estimating sparse
principal components, as such it is not the focus of the
paper to investigate principled approaches for selecting
the number of principal components that will be used in
subsequent analyses. We use the top two principal components in both our simulation study and the real data
analysis. In practice, some ad-hoc approaches, such as
choosing the top K PCs with more than 80% variation
explained, can be used.
Results
We conduct numerical studies including simiulations and
real data analysis to assess the performance of the proposed methods in comparison with several existing sparse
PCA methods. We consider two simulation settings that
differ by the proportions of variation explained by the first
two PCs. In the first setting, the first two PCs explain 6%
of the total variation which indicates that true signals in
the data are weak. In the second setting, the first two PC’s
explain 30% of the total variation in the data, representing a case where signals are strong. Within each setting,
we consider the dimensions p = 500 and p = 10, 000,
and also consider two scenarios that differ by the graph
structure G for the proposed methods.
Simulation settings
Let X be a n × p matrix and let G0 be the true covariance
matrix used to generate X. Let G0 be the corresponding graph structure. The true covariance matrix G0 is
partitioned as
G0 =
0
G00
0 ν × Ip−36
,
where G00 is block diagonal with ten blocks each of size
18 for p = 500 and size 250 for p = 10, 000, and between
block correlation 0. We set the variance of variables in the
first two blocks to be 1, and 0.3 for the remaining eight
blocks. In addition, we set the correlation of a main and
connecting variable to be 0.9 for the first two blocks and
0.2 for the other blocks. Meanwhile, we let the correlation
ρik ∼ Uniform(0.7, 0.8), i = k and i, k ≥ 2 for the first two
blocks, and ρik ∼ Uniform(0, 0.2), i = k and i, k ≥ 2 for
the other blocks. This type of covariance matrix G0 suggests that data structure is determined by ten underlying
subnetworks, where the first two PCs of the first two subnetworks are mostly important in detecting signals in the
data. In other words, in both settings, the true PCs has
36 important variables and p − 36 noise variables when
p = 500, and p = 500 important variables and p − 500
noise variables for p = 10, 000. We note that by changing the value of ν, we control the proportions of variation
explained by the first two PCs. The ν values we used in
both simulation settings are presented in Additional file 1:
Table S3. For each setting, we specify n = 100, and simulate X from multivariate normal distribution with mean 0
and variance G0 .
For each setting and dimension, we consider two scenarios that differ by the graph structure G specified in
the proposed sPCA methods. In the first scenario, the
graph structure is correctly specified, that is G = G0 .
This corresponds to the situation where all true structural
information are available in G so that G is informative. The
resulting network includes 500 variables and 170 edges
between each main variable and connecting variable when
p equals 500 (or 10,000 variables and 2490 edges when p
equals 10,000), i.e.,E = {i ∼ j|i, j = 1, · · · , 180} in G when
p equals 500 (or E = {i ∼ j|i, j = 1, · · · , 2, 500} in G when
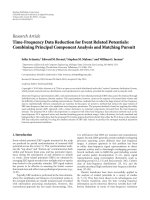
p equals 10,000). Figure 1 is a graph of the network G used
in Fused and Grouped sPCA when network information
is correctly specified.
In the second scenario, the graph structure is randomly
generated and does not capture the true information in
the data. The resulting network includes a total of 170
random edges when p equals 500 (or 2490 edges when
p equals 10,000). We first generate a p × p matrix with
each element from U(0, 1) distribution. The elements with
values more than an arbitrary cutoff 0.95 are saved as
candidates for random edges by considering their row
numbers and column numbers are connected nodes. We
then choose a random subset with size 170 (or 2490) as
the noninformative structure. It is possible that few random edges have overlaps with informative edges, but most
of them are still noises. This setting assesses the performance of the proposed methods in cases where the
structural information is uninformative and sheds light
on robustness of the proposed methods. Additional file 1:
Figure S1 shows the graph structure for randomly specified edges.
Performance Metrics We compare the proposed methods Grouped PCA and Fused PCA to the traditional PCA
[1], SPCA [4] and SPC [14]. We implement SPCA and
SPC using the R-packages elasticnet and PMA respectively. We evaluate the performance of the methods using
the following criteria.
ˆA
ˆ T ||2 ,
• Reconstruction error : ||Xtest AAT − Xtest A
F
where A = (α 1 α 2 ) are the true PC loadings and
ˆ = (αˆ 1 αˆ 2 ) are the estimated PC loadings. This
A
criterion tests the methods ability to approximate the
testing data reconstructed using only the first two PC
loadings.
ˆA
ˆ T ||2 . This criterion
• Estimation error : ||AAT − A
F
tests the methods ability to estimate the linear
subspace spanned by the true PC loadings [15], with a
smaller estimate preferred.
Li et al. BMC Bioinformatics (2017) 18:332
Page 6 of 12
Fig. 1 Network structure of simulated data: Correctly specified graph. Variables in circle represent signals, and square represent noise. (G = G0 )
• Selectivity : We also test the methods ability to select
the right variables while ignoring noise variables
using sensitivity and specificity which are defined as
# of True Positive
Sensitivity = # of True Positive+#
of False Negative ,
# of True Negative
Specificity = # of True Negative+# of False Positive .
Sensitivity and specificity capture the accuracy of
estimated PC loadings with high values indicating
better performance.
• Proportion of variance explained : The fourth
comparison criterion is the proportion of variation
explained in the testing and training data sets by the
T
αˆ XX αˆ
first two PC loadings, which is defined as trace(XX
T) ,
where X is either the centered training or testing data
set, and αˆ is the estimated first or second PC.
T
Simulation results
Table 1 shows the performance of the methods for the
first setting where the first two PCs explain only 6%
of the total variation in the data. We observe that the
proposed methods are competitive for p = 500 and even
more so when p = 10, 000. In particular, Grouped sPCA
has smaller reconstruction and estimation errors when
the graph structure is correctly specified and even when
the graph structure is uninformative. On the other hand,
Fused sPCA shows a suboptimal performance in comparison to Grouped sPCA, yet better or competitive performance when compared to the traditional PCA and SPCA
for correctly specified graph structure and mis-specified
graph structure. In terms of sensitivity and specificity, we
observe that both Grouped sPCA and more especially
Fused sPCA are better in detecting signals even when the
graph structure is mis-specified, while Grouped sPCA is
more competitive at not selecting noise variables. We also
notice that both Grouped sPCA and Fused sPCA have
good performance in proportions of cumulative variation
explained compared with existing sparse PCA methods,
especially compared with SPCA. In Table 2 where the first
two PC’s explain 30% of the total variation in the data, we
observe a similar performance of the proposed methods.
Li et al. BMC Bioinformatics (2017) 18:332
Page 7 of 12
Table 1 Simulation results of setting 1
Method
RE
EE
PCA
31 (9e-1)
SPCA
34 (3)
SPC
16 (8)
Sensitivity
Specificity
cPVE
1stPC
2ndPC
1stPC
2ndPC
1stPC
2ndPC
1.1 (3e-2)
1.0
1.0
0.0
0.0
4.3e-2 (2e-3)
8.2e-2 (2e-3)
1.2 (1e-1)
0.54
0.50
0.95
0.90
2.0e-2 (2e-3)
4.0e-2 (4e-3)
0.57 (3e-1)
0.57
0.60
0.98
1.0
2.8e-2 (3e-3)
5.5e-2 (6e-3)
P = 500
Biological information correctly specified
Fused sPCA
25 (6)
0.90 (2e-1)
1.0
1.0
0.73
0.70
2.9e-2 (4e-3)
5.1e-2 (7e-3)
Grouped sPCA
8.0 (6)
0.29 (2e-1)
0.81
0.80
0.97
1.0
3.2e-2 (2e-3)
6.0e-2 (3e-3)
Biological information randomly specified
Fused sPCA
32 (4)
1.1 (2e-1)
0.95
1.0
0.51
0.51
3.0e-2 (4e-3)
5.2e-2 (7e-3)
Grouped sPCA
9.1 (6)
0.33 (2e-1)
0.81
0.80
0.97
1.0
3.2e-2 (2e-3)
5.9e-2 (3e-3)
PCA
112 (3)
1.3 (2e-2)
1.0
1.0
0.0
0.0
2.6e-2 (1e-3)
5.0e-2 (1e-3)
SPCA
160 (4)
1.9 (3e-2)
0.15
0.15
0.99
0.99
2.3e-3 (5e-4)
4.5e-3 (7e-4)
SPC
172 (4)
2.0 (8e-3)
0.01
0.01
1.0
1.0
1.7e-4 (1e-4)
3.4e-4 (3e-4)
P = 10,000
Biological information correctly specified
Fused sPCA
81 (50)
0.94 ( 0.5 )
0.62
0.55
0.99
0.99
1.2e-2 (6e-3)
2.2e-2 (1e-2)
Grouped sPCA
54 (40)
0.62 ( 0.4 )
0.62
0.58
0.99
1.0
1.4e-2 (3e-3)
2.6e-2 (6e-3)
Biological information randomly specified
Fused sPCA
140 (30)
1.6 (0.4)
0.60
0.60
0.68
0.68
8.9e-3 (5e-3)
1.6e-2 (1e-2)
Grouped sPCA
58 (40)
0.67 (0.5)
0.59
0.55
0.99
1.0
1.4e-2 (3e-3)
2.6e-2 (7e-2)
Cumulative proportions of variance explained by true PCs are 0.03 for PC 1 and 0.06 for PC 1 and 2. P, number of variables. RE, reconstruction error, defined as
||Xtest AAT − Xtest Aˆ Aˆ T ||2F , where A = (α 1 α 2 ). EE, estimation error, defined as ||AAT − Aˆ Aˆ T ||2F . cPVE, proportions of cumulative variation explained. ·(·), mean(std)
A comparison between p = 500 and p = 10, 000 scenarios for both settings indicates that the gain in reconstruction error, estimation error, sensitivity, and proportions of
variation explained can be substantial for Grouped sPCA
and Fused sPCA compared with the existing sparse PCA
methods, as the number of variables increases. This suggests that Grouped sPCA or Fused sPCA can achieve
sparse PC loading estimations with higher accuracy, better variable selection, and larger proportion of variation
explained, especially when the number of variables is
relatively large.
We evaluate the results on different γ values. Both
Tables 1 and 2 use γ = 2 and the results of the
same settings with γ = 8 are presented in Additional
file 1: Tables S1 and S2. A comparison of Table 1 versus
Additional file 1: Table S1 (or Table 2 versus Additional
file 1: Table S2) shows very similar results, indicating that
the proposed methods are robust to the different selection of γ values. We also explore how much the results
would be impacted by adding noise structural information
in both settings with P = 500. The results are demonstrated in Additional file 1: Tables S4 and S5. We find
that the results by both Fused sPCA and Grouped sPCA
worsen a little as expected after adding 170 noise edges.
We also find that Grouped sPCA is more robust to noise
information than Fused sPCA. After noise informtion is
added, Grouped sPCA still has good performance.
Analysis of Glioblastoma data
We apply the proposed methods to analyze data from
a Glioblastoma cancer study. Glioblastoma brain multiform (GBM) is the most common malignant brain tumor
and is defined as grade IV astrocytoma by the Whold
Health Organization because of its aggressive and malignant nature [16]. The Cancer Genome Atlas Project
(TCGA) [17] integratively analyzed genome information
of patients with glioblastoma and expanded the knowledge about the pathways and genes that may relate with
glioblastoma. In our data analysis, we obtain part of the
genomic data from TCGA project for glioblastoma, which
is explained in detail by McLendon et al. [17], Verhaak
et al. [18], Cooper et al. [19]. This data set contains
microarray data of 558 subjects with glioblastoma. The
GBM subtype of each subject is also given.
The goal of the analysis is to identify a subset of relevant
genes that contribute to the variation in the different GBM
subtypes, and also determine how the first two estimated
PCs separate these subtypes. For both datasets, we first
select 2,000 variables with the largest variation following
the data preprocessing procedure in Witten et al. [14].
Li et al. BMC Bioinformatics (2017) 18:332
Page 8 of 12
Table 2 Simulation results of setting 2
Method
RE
EE
PCA
31 (0.9)
SPCA
35 (2)
SPC
15 (7)
Sensitivity
Specificity
cPVE
1stPC
2ndPC
1stPC
2ndPC
1stPC
2ndPC
1.1 (3e-2)
1.0
1.0
0.0
0.0
4.3e-2 (2e-3)
8.2e-2 (2e-3)
1.3 (9e-2)
0.49
0.50
0.95
1.0
1.9e-2 (3e-3)
3.9e-2 (4e-3)
0.54 (3e-1)
0.57
0.60
0.98
1.0
2.8e-2 (3e-3)
5.6e-2 (5e-3)
P = 500
Biological information correctly specified
Fused sPCA
27 (4)
0.93 (2e-1)
1.0
1.0
0.70
0.70
3.0e-2 (3e-3)
5.3e-2 (5e-3)
Grouped sPCA
7.9 (5)
0.29 (2e-1)
0.80
0.80
0.97
1.0
3.2e-2(2e-3 )
6.0e-2 (3e-3)
Biological information randomly specified
Fused sPCA
32 (5)
1.1 (2e-1)
0.96
1.0
0.52
0.50
2.9e-2 (5e-3)
5.1e-2 (8e-3)
Grouped sPCA
9.2 (6)
0.33 (0.2)
0.79
0.8
0.97
1.0
3.2e-2 (2e-3)
5.9e-2 (4e-3)
PCA
112 (3)
1.3 (2e-2)
1.0
1.0
0.0
0.0
2.7e-2 (1e-3)
5.0e-2 (1e-3)
SPCA
162 (4)
1.9 (3e-2)
0.16
0.16
1.0
1.0
2.0e-3 (5e-4)
4.0e-3 (8e-4)
SPC
173 (4)
2.0 (5e-3)
5.0e-3
5.0e-3
1.0
1.0
1.6e-4 (1e-4)
3.2e-4 (2e-4)
P = 10,000
Biological information correctly specified
Fused sPCA
77 ( 40 )
0.89 ( 0.5 )
0.65
0.57
0.99
1.0
1.3e-2 (5e-3)
2.3e-2 (9e-3)
Grouped sPCA
46 ( 30 )
0.53 ( 0.4 )
0.65
0.62
0.99
1.0
1.5e-2 (2e-3)
2.8e-2 (5e-3)
Biological information randomly specified
Fused sPCA
140 ( 30 )
1.6 ( 0.4 )
0.59
0.60
0.68
0.70
9.0e-3 (5e-3)
1.7e-2 (1e-2)
Grouped sPCA
53 ( 40 )
0.61 ( 0.4 )
0.63
0.60
0.99
1.0
1.5e-2 (3e-3)
2.7e-2 (6e-3)
Cumulative proportions of variance explained by true PCs are 0.15 for PC 1 and 0.30 for PC 1 and 2. P, number of variables. RE, reconstruction error, defined as
||Xtest AAT − Xtest Aˆ Aˆ T ||2F , where A = (α 1 α 2 ). EE, estimation error, defined as ||AAT − Aˆ Aˆ T ||2F . cPVE, proportions of cumulative variation explained. ·(·), mean(std)
In the next step, we select patients with subtype Classical, Mesenchymal, Neural, and Proneural following the
previous work by Verhaak et al. [18] resulting in 481
patients with subtype data. We obtain the gene network
information for Fused and Grouped sparse PCA methods from the Kyoto Encyclopedia of Genes and Genomes
(KEGG) database [20]. The resulting network has 2000
genes and 1297 edges in the network. We center each variable to have mean 0 and standardize each variable to have
variance one.
To justify the structural information we use for the proposed methods, we conduct exploratory analysis using
correlation coefficients of gene pairs. We group the
gene pairs consisting of the selected 2000 genes into
three categories: unconnected gene pairs (two genes that
are not in any pathway), direct-connected gene pairs
(two genes that have a direct edge connecting them),
indirect-connected gene pairs (two genes that belong
to the same pathway but do not have a direct edge
connecting them) according to the KEGG Pathway information and we use boxplots to demonstrate the correlation coefficients of these three types of gene pairs.
Additional file 1: Figure S2 shows the plot of correlation coefficients of gene pairs by their categories.
There is a small but clear decreasing trend in correlation coefficients as one moves from direct-connected
gene pairs to unconnected gene pairs. This shows that
the gene pairs that are directly connected tend to have
stronger correlations than those that are indirectly connected or unconnected, thus justifying the validity of
pathway information we use in the analysis.
In the analysis, we equally split each data set into training and testing sets, where the training set is used to
estimate the optimal tuning parameters via BIC. The plots
of BIC values versus tuning parameters for Grouped sPCA
and Fused sPCA are shown in Additional file 1: Figure S3.
We then apply the optimal parameters on the whole training set to estimate the first two PC loadings αˆ i , i = 1, 2,
and use the testing set to evaluate the estimated loadings
using the following two criteria:
Number of non-zero loadings of
αˆ i =
2000
ˆ ij
j=1 I{α
= 0},
i = 1, 2;
Proportion of variation explained by
αˆ i =
ˆi
αˆ T
i Xα
,
trace(XXT )
i = 1, 2,
where X is the centered training or testing data matrix. We
also obtain the first two PCs αˆ by αˆ i = Xαˆ i , i = 1, 2 and
Li et al. BMC Bioinformatics (2017) 18:332
Page 9 of 12
determine how well they separate patients with different
GBM subtypes using support vector machine (SVM).
Table 3 shows the number of non-zero loadings, the
cumulative proportions of variation explained by the first
two PC loadings, and the classification results using SVM.
We find that SPC and SPCA are more sparse than the
Fused sparse PCA and the Grouped sparse PCA. This is
consistent with the simulation settings where SPC and
SPCA tend to be more sparse and have higher false negatives that result in lower sensitivity. Regarding cumulative
proportions of variation explained, we find that the proposed methods explain higher variation in the data, but
this may be due to the large number of variables selected.
The last column of Table 3 gives the classification results
from applying SVM on the testing set using the estimated
first two PC loadings. The Fused and Grouped sparse
PCA have the highest number of correctly specified subjects. Of the existing methods, PCA and SPCA achieve
good performance of separating patients with different
subtypes, while SPC has the lowest number of subjects
correctly classified.
We also conduct pathway enrichment analysis using
bioinformatics software ToppGene Suite [21]. We take the
first PC as an example for illustration. We identify the
genes that have non-zero loadings in the first PC from
the proposed sparse PCA methods and existing methods, and obtain significantly enriched pathways that are
associated with glioblastoma for each method. We seek to
identify methods that have more glioblastoma-associated
pathways, and whether these overlap. Table 4 shows the
Glioblastoma-related pathways found by the proposed
methods and existing sparse PCA methods. Among the
existing sparse PCA methods, both SPC and SPCA find
Spinal Cord Injury pathway. Compared with the existing methods, Fused and Grouped sPCA find a few new
Glioblastoma-related pathways: Proteoglycans in cancer,
Transcriptional misregulation in cancer, Pathways in cancer, Bladder cancer, and Angiogenesis. These pathways
have been demonstrated in existing literatures to be associated with Glioblastoma [22–27]. We do not conduct
pathway enrichment analysis with the results of traditional PCA because traditional PCA does not perform any
variable selection and automatically select all variables.
We also plot the first two PC loadings by Fused and
Grouped sPCA in Additional file 1: Figure S4 and the loadings of genes enriched in Glioblastoma-related pathways
are highlighted in color. These results indicate that the
proposed methods may be more sensitive in detecting disease related signals and thus can identify more biologically
important genes.
Discussions
In this paper, we propose two novel structured sparse
PCA methods. Through extensive simulation studies and
an application to Glioblastoma gene expression data, we
demonstrate that incorporating known biological information improves the performance of sparse PCA methods. Specifically, our simulation study indicates that the
proposed methods can decrease reconstruction and estimation errors, and increase sensitivity and proportions
of variation explained, especially when number of variables is large. Compared with Fused sPCA and existing
PCA methods, Grouped sPCA achieves the lowest reconstruction error and estimation error for correctly specified
and mis-specified graph structure. On the other hand,
Fused sPCA has higher sensitivity values. Because we
utilize prior biological information, the proposed methods usually have less sparse PC loadings compared with
the existing sPCA methods and thus lower specificity.
However, there is a trade-off between sparsity and the
benefit from extra information. Consistent with the simulations results, the real data analysis demonstrates that
the proposed methods generate less sparse PC loadings.
However, the classification results show the advantages of
incorporating biological information into sparse PCA.
The proposed methods require the structure of variables to be known in advance and specified during analysis. In real data analysis, this task is not trivial and it may
take some efforts in searching for a proper variable structure to use. Regarding this, we make the following comments. First of all, many sources of structural information
may be available to use including KEGG pathway [20],
Panther pathway [28], Human protein reference database
[29]. It may be helpful to conduct some exploratory analysis such as Additional file 1: Figure S2 to confirm the
need for using biological information. Additional file 1:
Table 3 Analysis of the GBM data using Kegg Pathway information. cPVE represents proportions of cumulative variation explained
Method
Non-zero Loadings
cPVE
Subjects correctly classified
1stPC
2ndPC
1stPC
2ndPC
SVM
PCA
2000
2000
0.1955
0.3175
97
SPCA
240
238
0.0333
0.0591
97
SPC
45
59
0.0215
0.0383
67
Fused sPCA
1644
1410
0.1792
0.2787
123
Grouped sPCA
1330
970
0.1731
0.2652
119
Li et al. BMC Bioinformatics (2017) 18:332
Page 10 of 12
Table 4 Enriched Glioblastoma-related pathways for the genes in first PC by different sPCA methods
Pathway ID
Pathway name
P-value
739007
Spinal cord injury
782000
Proteoglycans in cancer
523016
83105
83115
Gene
From input
In annotation
7.43E-18
45
112
5.77E-11
55
225
Transcriptional misregulation in cancer
3.31E-7
40
179
Pathways in cancer
3.36E-7
61
327
Bladder cancer
6.10E-6
14
38
739007
Spinal Cord Injury
1.97E-14
36
112
523016
Transcriptional misregulation in cancer
4.06E-7
34
179
83105
Pathways in cancer
2.58E-5
46
327
P00005
Angiogenesis
4.90E-5
26
150
Spinal Cord Injury
1.43E-5
5
112
Spinal Cord Injury
6.46E-5
8
112
Fused sPCA
Grouped sPCA
SPC
739007
SPCA
739007
Figure S2 demonstrates that gene pairs connected in the
same pathway generally have higher correlation than gene
pairs unconnected in the same pathway, and further than
gene pairs in different pathways. Second, our simulation
study indicates that even if the structural information is
irrelevant as in the biological information randomly specified section, the proposed methods still perform well,
especially Grouped sPCA method.
Our proposed methods have some limitations. First,
when structural information includes a large number of
edges, the proposed methods, particularly, Fused sPCA,
may generate PC loadings that include more false positive
selections. To solve this problem, one potential approach
is to obtain a smaller but more relevant biological structure. Second, the proposed methods, especially Grouped
sPCA may be computationally slow in the presence of a
large number of edges. Based on our experience with the
simulations and the real data set, Fused sPCA is computationally more efficient than Grouped sPCA since we
are able to vectorize the penalty for Fused sPCA in the
algorithm. Lastly, it has been observed that many studies used gene expression data that are inefficiently and
insufficiently pre-processed or normalized, which leads
to failure of eliminating technical noise or batch effects
[30]. Our proposed methods do not provide steps for
pre-processing or normalizing data. The users should
adequately pre-process gene expression data to remove
potential technical noises and batch effects before applying our methods.
Our structured sparse PCA methods are aimed for estimating sparse PCs and can be considered a dimension
reduction technique. Subsequent analyses could use the
estimated PCs in a number of different ways. For example,
one could use PCs for visualizing gene expression data,
clustering, or building prediction model. Following suggestions from a reviewer, we conducted one additional
set of simulations to assess the prediction performance
of using the top k PCs that achieve a certain proportion
of total variation explained, and the impact of different threshold values for the proportion of total variation
explained. We used a simulation setting similar to Setting
2 in the Simulation section with 100 subject, 500 variables,
and 100 simulated datasets. The cumulative proportions
of variation explained by the first two PCs are 30%. We
generated a binary outcome variable using the first PC
through a logistic regression model: logit(Pr(Yi = 1)) =
0.5 + PC1i . The simulation results presented in Additional
file 1: Table S6 show that Fused sPCA has the highest
prediction accuracy among all the sparse PCA methods
when 30, 50, and 60% are used as the threshold, consistent with our findings in real data analysis. Also, the
prediction accuracy is not very sensitive to the choice
of threshold values. Of note, in these simulations, the
proportion of total variation explained by all PCs estimated using sparse PCA methods fails to reach 70% for
our method and 60% for other methods, which is likely
due to regularization/sparsity. It has been reported previously [14, 31] that sparse PCA generates PC solutions that
explain smaller proportions of total variation than standard PCA. Future research is needed to investigate more
principled approaches for choosing the top k PCs in subsequent analysis and to understand why the proportion
Li et al. BMC Bioinformatics (2017) 18:332
of total variation explained by all PCs estimated using
sparse PCA methods fails to reach certain threshold and
potential remedy for this limitation.
Although we apply the proposed methods to analysis of
gene expression data, our methods are flexible and general
enough to be applied to other data types, such as epigenomics data discussed in the review paper by Qin et al.
[32]. Besides the potential application to other data, some
extensions are of potential interest. One may use alternative convex optimization solvers other than the CVX
solver in Matlab used in our work, potentially to speed
up the computations. In addition, Fused and Grouped
sPCA only incorporate the edge information in a graph.
As variables are often grouped into pathways, sPCA using
hierarchical penalties [33] can be developed to incorporate group membership information in addition to edge
information.
Conclusions
The proposed sparse PCA methods Fused and Grouped
sparse PCA can effectively incorporate prior biological
information in variable selection, leading to improved
feature selection and more interpretable principal component loadings and potentially providing insights on
molecular underpinnings of complex diseases.
Additional file
Additional file 1: Figure S1. Network structure of simulated data :
Randomly specified graph (G ). Figure S2. Correlation of gene pairs by
relationship types. Figure S3. BIC value by tuning parameter with GBM
microarray data. X-axis is tuning parameter, y-axis is BIC value. Figure S4.
Loading plots of the first two PCs by Fused and Grouped sPCA. Colored
points are genes enriched in Glioblastoma related pathways found by the
proposed methods but not found by existing methods. Table S1.
Simulation results of Setting 1 when γ equals 8. Table S2. Simulation
results of Setting 2 when γ equals 8. Table S3. ν value used in the
simulation settings. Table S4. Simulation results of Setting 1 when extra
noise edges are added to structural information. Table S5. Simulation
results of Setting 2 when extra noise edges are added to structural
information. Table S6. Prediction accuracy using the PCs of PCA-based
methods. ·(·) represents mean(sd). (PDF 1270 kb)
Abbreviations
GBM: Glioblastoma brain multiform; KEGG: Kyoto encyclopedia of genes and
genomes; PCA: Principal component analysis; PMD: Penalized matrix
decomposition; TCGA: The cancer genome atlas project
Acknowledgements
The authors acknowledge helpful discussions with Dr. Hao Wu and helpful
suggestions from two anonymous reviewers.
Funding
This work was supported in part by NIH grants K12HD085850, R03CA173770,
R03CA183006 and P30CA016520. The content is solely the responsibility of the
authors and does not represent the views of the NIH.
Availability of data and materials
Matlab code is available at The
gene expression data used for the real data analysis are obtained from the
TCGA data portal at />
Page 11 of 12
Authors’ contributions
QL and SS formulated the ideas. SS and ZL developed the software and wrote
the first draft. QL, SS and ZL designed the experiments and revised paper. ZL
performed the experiments and analyzed the data. All authors read and
approved the final manuscript.
Ethics approval and consent to participate
Not applicable.
Consent for publication
Not applicable.
Competing interests
The authors declare that they have no competing interests.
Publisher’s Note
Springer Nature remains neutral with regard to jurisdictional claims in
published maps and institutional affiliations.
Author details
1 Department of Biostatistics and Bioinformatics, Emory University, 1518 Clifton
Road, 30322 Atlanta, GA, USA. 2 Department of Biostatistics, Epidemiology and
Informatics, Perelman School of Medicine, University of Pennsylvania, 423
Guardian Drive, 19104 Philadelphia, PA, USA.
Received: 6 December 2016 Accepted: 22 June 2017
References
1. Hotelling H. Relations between two sets of variables. Biometrika. 1936;28:
321–77.
2. Cadima J, Jolliffe IT. Loading and correlations in the interpretation of
principle compenents. J Appl Stat. 1995;22(2):203–14.
3. Jolliffe IT, Trendafilov NT, Uddin M. A modified principal component
technique based on the lasso. J Comput Graph Stat. 2003;12(3):531–47.
4. Zou H, Hastie T, Tibshirani R. Sparse principal component analysis. J
Comput Graph Stat. 2006;15:265–86.
5. Witten DM, Tibshirani RJ. Extensions of sparse canonical correlation
analysis with applications to genomic data. Stat Appl Genet Mol Biol.
2009;8:1–29.
6. Li C, Li H. Network-constrained regularization and variable selection for
analysis of genomic data. Bioinformatics. 2008;24(9):1175–82.
7. Pan W, Xie B, Shen X. Incorporating predictor network in penalized
regression with application to microarray data. Biometrics. 2010;66(2):474–84.
8. Allen GI, Grosenick L, Taylor J. A generalized least-square matrix
decomposition. J Am Stat Assoc. 2014;109(505):145–59.
9. Jenatton R, Obozinski G, Bach FR. Structured sparse principal
component analysis. AISTATS. Proceedings of Machine Learning
Research. 2010;9:366–73.
10. Tibshirani R, Saunders M, Rosset S, Zhu J, Knight K. Sparsity and
smoothness via the fused lasso. J R Stat Soc Ser B Stat Methodol.
2005;67(1):91–108.
11. Shiga M, Mamitsuka H. Non-negative matrix factorization with auxiliary
information on overlapping groups. IEEE Trans Knowl Data Eng.
2015;27(6):1615–28.
12. Safo SE, Ahn J, Jeon Y, Jung S. Sparse generalized eigenvalue problem
with application to canonical correlation analysis for integrative analysis
of methylation and gene expression data. 2016. />01066.
13. CVX Research I. CVX: Matlab Software for Disciplined Convex
Programming, version 2.0. 2012. Accessed Nov, 2016.
14. Witten DM, Tibshirani RJ, Hastie T. A penalized matrix decomposition,
with applications to sparse prinicial components and canonical
correlation analysis. Biostatistics. 2009;10(3):515–34.
15. Cai T, Ma Z, Wu Y. Sparse pca: Optimal rates and adaptive estimation.
Ann Stat. 2013;41:3074–110.
16. Furnari FB, Fenton T, Bachoo RM, Mukasa A, Stommel JM, Stegh A,
Hahn WC, Ligon KL, Louis DN, Brennan C, et al. Malignant astrocytic
glioma: genetics, biology, and paths to treatment. Genes Dev.
2007;21(21):2683–710.
Li et al. BMC Bioinformatics (2017) 18:332
Page 12 of 12
17. McLendon R, Friedman A, Bigner D, Van Meir EG, Brat DJ,
Mastrogianakis GM, Olson JJ, Mikkelsen T, Lehman N, Aldape K, et al.
Comprehensive genomic characterization defines human glioblastoma
genes and core pathways. Nature. 2008;455(7216):1061–8.
18. Verhaak RG, Hoadley KA, Purdom E, Wang V, Qi Y, Wilkerson MD, Miller
CR, Ding L, Golub T, Mesirov JP, et al. Integrated genomic analysis
identifies clinically relevant subtypes of glioblastoma characterized by
abnormalities in pdgfra, idh1, egfr, and nf1. Cancer Cell. 2010;17(1):98–110.
19. Cooper L, Gutman DA, Long Q, Johnson BA, Cholleti SR, Kurc T, Saltz
JH, Brat DJ, Moreno CS. The proneural molecular signature is enriched in
oligodendrogliomas and predicts improved survival among diffuse
gliomas. PloS ONE. 2010;5(9):12548.
20. Kanehisa M, Goto S. Kegg: kyoto encyclopedia of genes and genomes.
Nucleic Acids Res. 2000;28(1):27–30.
21. Chen J, Bardes EE, Aronow BJ, Jegga AG. Toppgene suite for gene list
enrichment analysis and candidate gene prioritization. Nucleic Acids Res.
2009;37(suppl 2):305–11.
22. Streit WJ, Semple-Rowland SL, Hurley SD, Miller RC, Popovich PG,
Stokes BT. Cytokine mrna profiles in contused spinal cord and
axotomized facial nucleus suggest a beneficial role for inflammation and
gliosis. Exp Neurol. 1998;152(1):74–87.
23. Gilbertson RJ, Rich JN. Making a tumour’s bed: glioblastoma stem cells
and the vascular niche. Nat Rev Cancer. 2007;7(10):733–6.
24. Croce CM. Causes and consequences of microrna dysregulation in
cancer. Nat Rev Genet. 2009;10(10):704–14.
25. McLendon R, Friedman A, Bigner D, Van Meir EG, Brat DJ,
Mastrogianakis GM, Olson JJ, Mikkelsen T, Lehman N, Aldape K, et al.
Comprehensive genomic characterization defines human glioblastoma
genes and core pathways. Nature. 2008;455(7216):1061–8.
26. Spruck CH, Ohneseit PF, Gonzalez-Zulueta M, Esrig D, Miyao N, Tsai YC,
Lerner SP, Schmütte C, Yang AS, Cote R, et al. Two molecular pathways
to transitional cell carcinoma of the bladder. Cancer Res. 1994;54(3):784–8.
27. Rong Y, Durden DL, Van Meir EG, Brat DJ. ‘pseudopalisading’necrosis in
glioblastoma: a familiar morphologic feature that links vascular pathology,
hypoxia, and angiogenesis. J Neuropathol Exp Neurol. 2006;65(6):529–39.
28. Mi H, Poudel S, Muruganujan A, Casagrande JT, Thomas PD. Panther
version 10: expanded protein families and functions, and analysis tools.
Nucleic Acids Res. 2016;44(D1):336–42.
29. Prasad TK, Goel R, Kandasamy K, Keerthikumar S, Kumar S, Mathivanan
S, Telikicherla D, Raju R, Shafreen B, Venugopal A, et al. Human protein
reference database—2009 update. Nucleic Acids Res. 2009;37(suppl 1):
767–72.
30. Leek JT, Scharpf RB, Bravo HC, Simcha D, Langmead B, Johnson WE,
Geman D, Baggerly K, Irizarry RA. Tackling the widespread and critical
impact of batch effects in high-throughput data. Nat Rev Genet.
2010;11(10):733–9.
31. Rasmussen MA, Bro R. A tutorial on the lasso approach to sparse
modeling. Chemometr Intell Lab Syst. 2012;119:21–31.
32. Qin Z, Li B, Conneely KN, Wu H, Hu M, Ayyala D, Park Y, Jin VX, Zhang
F, Zhang H, et al. Statistical challenges in analyzing methylation and
long-range chromosomal interaction data. Stat Biosci. 2016;8:1–26.
33. Zhao Y, Chung M, Johnson BA, Moreno CS, Long Q. Hierarchical feature
selection incorporating known and novel biological information:
Identifying genomic features related to prostate cancer recurrence.
2016;J Am Stat Assoc:. (in press).
Submit your next manuscript to BioMed Central
and we will help you at every step:
• We accept pre-submission inquiries
• Our selector tool helps you to find the most relevant journal
• We provide round the clock customer support
• Convenient online submission
• Thorough peer review
• Inclusion in PubMed and all major indexing services
• Maximum visibility for your research
Submit your manuscript at
www.biomedcentral.com/submit