Social Network Mapping Software - New Frontiers in HRM
Bạn đang xem bản rút gọn của tài liệu. Xem và tải ngay bản đầy đủ của tài liệu tại đây (705.87 KB, 17 trang )
68 Bhattacharya & Huntley
Copyright © 2005, Idea Group Inc. Copying or distributing in print or electronic forms without written
permission of Idea Group Inc. is prohibited.
Chapter III
Social Network
Mapping Software:
New Frontiers in HRM
Mousumi Bhattacharya, Fairfield University, USA
Christopher Huntley, Fairfield University, USA
Abstract
Recent developments in social network mapping software have opened up
new opportunities for human resource management (HRM). In this
chapter we discuss how social network mapping information may
provide critical inputs to managers for increasing the effectiveness of
their HRM programs.
Introduction
In a knowledge-driven economy, returns on effective management of human
capital are likely to exceed those available from more efficient management of
financial and physical assets. In order to realize these returns, however,
companies must go beyond notions of productivity and cost effectiveness, and
Social Network Mapping Software 69
Copyright © 2005, Idea Group Inc. Copying or distributing in print or electronic forms without written
permission of Idea Group Inc. is prohibited.
develop new approaches and management techniques to tap the knowledge,
intellect, and creativity used to achieve these outcomes. Mapping and under-
standing social networks within an organization is an approach to understand
how social relationships may affect business processes. Network perspectives
build on the general notion that economic actions are influenced by the social
context in which they are embedded and by the position of actors in social
networks (Granovetter, 1985). Research on social networks indicates that
network structure and activities influence employees and affect individual and
organizational outcomes (Sparrowe, Liden, Wayne, & Kraimer, 2001), and
provides motivation to explore this rich field for possible inputs in human
resource management (HRM) activities. In this chapter we suggest ways in
which social networks can be analyzed using network mapping software and
how some the information derived can be used meaningfully for HRM.
What do networks within organizations look like? How do we efficiently
construct and analyze maps of these networks? What effect do these networks
have on HRM activities? What opportunities exist to use social network
mapping information to improve HRM activities? These questions are signifi-
cant for organizations that want to manage their social and human capital
efficiently and effectively. Given that vigorous network activities usually take
place within organizations, and that social capital may have a direct bearing on
human capital management, it becomes important to examine how these social
processes affect HRM activities. Recent developments in social network
mapping software help organizations to discover and analyze network struc-
tures. While such software has been available for quite some time, only recently
have high-quality tools become readily accessible to mainstream business
users. Partly this is because of improvements in computing power (i.e., modern
computers are more capable), but there has also been significant improve-
ments in the functionality and usability of the software. Our discussion
highlights the capabilities of some of these software applications, as well as
their implications for various HRM functions.
What are Social Networks?
The social network theory (Uzzi, 1996; Ibarra, 1993; Granovetter, 1973,
1985) emphasizes that human decisions are, to a large extent, functions of the
ties between people (Burt, 1992). Individuals obtain support, information, and
70 Bhattacharya & Huntley
Copyright © 2005, Idea Group Inc. Copying or distributing in print or electronic forms without written
permission of Idea Group Inc. is prohibited.
power from the network structure around them and from their position in the
network. Factors that determine the influence of a social network on decision
making include accessibility to network, network structure, the actors involved,
and the location of the decision maker in the network (Burt, 1992).
While the influence of social networks within organizations has long been
acknowledged, it is only recently that one could quantify and visualize social
networks of substantial size. To understand the complexity of the task, let us
consider the various structural measures that can be applied to social networks.
Network structures refer to a definable set of relationships, which hold together
a number of objects (or people) in juxtaposition with one another (Burt, 1992).
These structures are characterized by relationships, entities, context, configu-
rations, and temporal stability. Some of the indices and dimensions that express
outcomes of network are:
• frequency of interaction among the contacts;
• structural holes or non-connectivity between contacts;
• centrality, which refers to the extent to which an individual could reach
others in the network through a minimum number of links;
• criticality, which reveals the degree to which an individual’s position was
crucial to the flow of materials in the workflow network;
• transaction alternatives, which refers to whether or not redundancy
was built into the system in terms of inputs to particular individuals and
their output to others;
• reachability, which focuses on how many links a communication must
flow through to get from one node to another;
• connectiveness, which refers to whether or not all of the possible linkages
in an aggregate are being utilized;
• inclusiveness, which refers to the number of points that are included
within the various connected parts of the network; and
• density of a network, which is defined as the number of relationships
expressed as a proportion of the maximum possible number of relation-
ships.
Clearly, with such a rich vocabulary of quantitative terms used to describe just
the structure of a network, there is much more to network mapping and
Social Network Mapping Software 71
Copyright © 2005, Idea Group Inc. Copying or distributing in print or electronic forms without written
permission of Idea Group Inc. is prohibited.
analysis than constructing a few diagrams. Calculating even one measure
manually would be quite tedious and error-prone. Thus, network analyses
are almost always performed using specialized software, the subject of our
next section.
Social Network Mapping Software
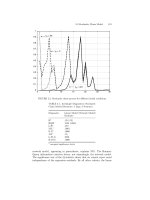
Figure 1 summarizes the common features of network mapping software. Most
social network analysis software supports at least one of three functions: data
collection, descriptive modeling, and decision support. Data collection is the
most fundamental requirement. Generally, the input data takes on one of two
forms, depending on the focus of the analysis. For perceptual or egocentric
data, the traditional method is to survey individuals about themselves (age,
gender, etc.) and their relationships to others in the organization. If the objective
is to provide a onetime or occasional snapshot of the network, such methods
can work very well. However, for more frequent analyses, an alternative
method is to collect interaction data (e.g., adjacency matrices) based on some
measure of activity between people in the organization. The data is then input
to the software through some sort of import utility. In some cases, the import
utility can be used to collect activity data from e-mail servers, instant messaging
gateways, and other “watering holes” in cyberspace.
Descriptive modeling, the second function, is used to “map” the structure of the
network. Quantitative models use descriptive statistics (e.g., centrality, criti-
cality, etc.) to measure global or local properties of the network. For example,
IKNOW (2003) can calculate measures of centrality and prestige for demo-
graphic groups within a larger network. Similarly, UCINET (2003) provides
dozens of analytical models, ranging from measures of criticality, cohesion,
inclusiveness, and similar quantities, to more advanced procedures like corre-
spondence analysis and multiple regressions. Visualization models are also
useful, particularly when looking for useful patterns (e.g., centers of control) in
the network structure. Two of the most common visual models are network
“graphs” (NetVis, 2003) that look like stick and ball models used in chemistry
classes and clustering diagrams (UCINET, 2003) that use tree shapes called
“dendrograms” or colored scatter plots to group individuals within the network.
The last and most advanced function of social network software is to provide
72 Bhattacharya & Huntley
Copyright © 2005, Idea Group Inc. Copying or distributing in print or electronic forms without written
permission of Idea Group Inc. is prohibited.
decision support to those who seek to alter or manage the social network itself.
Providing that the data collection process is sufficiently automated, customized
reports can be used to detect trends or unusual activity in the network. They
may also be used in so-called what-if analyses, where the network is analyzed
under various scenarios. Since in principle any descriptive model can be used
as the basis for the report, virtually any package will support this functionality
to some degree. A somewhat more sophisticated use of such longitudinal data
is simulation (SIENA, 2003), which tries to predict the evolution and long-term
behavior of the network given certain network parameters. Typically, these
parameters are estimated from several snapshots of the interaction matrices.
A representative sample of the available software packages taken from the
INSNA Web site (INSNA, 2003) is presented in Table 1. IKNOW (2003)
is a Web-based package that uses surveys to elicit network data. It is free for
noncommercial use, but you must contact the developer for a commercial
license. InFlow (2003) and NetForm (2003) are offered as part of consulting
services by the developers and include a formal methodology for conducting
network analysis. NetVis (2003) and SIENA (2003) are free packages
targeted at researchers that support advanced statistical features like simula-
tion. UCINET (2003) is similarly advanced, but requires a commercial license.
As even this small sample demonstrates, social network software is quite a
diverse lot, ranging from relatively simple network mappers to comprehensive
methodologies to cutting-edge research tools. Further, each tool has its
strengths and weaknesses, making the choice of which to use somewhat
Figure 1. Social network mapping software classification
Data Collection
Descriptive Modeling
Decision Support
Surveys Interaction Data
Statistical
Visual Reporting
Simulation
Social Network Mapping Software 73
Copyright © 2005, Idea Group Inc. Copying or distributing in print or electronic forms without written
permission of Idea Group Inc. is prohibited.
dependent on individual needs and resources. If your needs are extensive and
you have the budget to afford it, then you may want to consider software like
InFlow or NetForm that are backed by consulting organizations. Similarly, if
you can’t afford consulting services and do not want to scale the learning curve
of the more advanced tools like SIENA or UCINET, then you may want to opt
for the simplicity of a tool like IKNOW or NetVis which, once installed,
requires very little maintenance or training.
HRM and Social Network Mapping
Social network theorists have discussed how networks provide access to
information and knowledge (Burt, 1992). Flow of information, power, and
status are the three major outcomes from social networks and the network
position of an individual or a group facilitates this flow (Sparrowe et al., 2001).
From the HRM perspective, information on knowledge, power, and status flow
can be input for effective management of people. HRM activities like recruit-
ment and selection, performance management, training and development,
communication, employee relation, and compensation can use this information
for better decision making. Flow of knowledge tells us how human, social, and
Table 1. A sample of social network software
IKNOW InFlow NetVis NetForm SIENA UCINET
Data Collection
Surveys X X X X
Import Utility X X X X
Descriptive
Modeling
Statistics X X X X X X
Graphs X X X X X
Decision Support
Custom Reports X X X
Simulation X X
Software
Vendor Univ. Illinois Orgnet.com Netvis.org NetForm Tom
Snijders
Analytic
Technologies
Platform Web PC Web PC PC PC
Free Download Yes No Yes No Yes Evaluation
Licenses Free
Commercial
Commercial Free Commercial Free Commercial
Paid Support
Available
Yes Yes No Yes No Yes