Shrinkage Estimation of Covariance Matrix for Portfolio Selection on Vietnam
Bạn đang xem bản rút gọn của tài liệu. Xem và tải ngay bản đầy đủ của tài liệu tại đây (3.53 MB, 128 trang )
MINISTRY OF EDUCATION AND TRAINING
THE STATE BANK OF VIETNAM
BANKING UNIVERSITY OF HO CHI MINH CITY
DOCTORAL DISSERTATION
NGUYEN MINH NHAT
SHRINKAGE ESTIMATION OF COVARIANCE MATRIX
FOR PORTFOLIO SELECTION ON VIETNAM STOCK MARKET
Ho Chi Minh City - 2020
i
Table of Contents
List of Abbreviations .................................................................................................... iv
List of Figures ............................................................................................................... vi
List of Tables............................................................................................................... viii
CHAPTER 1: INTRODUCTION ................................................................................. 1
1.1 Vietnam stock market overview ............................................................................. 1
1.2 Problem statements ................................................................................................. 6
1.3 Objectives and research questions ........................................................................ 11
1.4 Research Methodology ......................................................................................... 11
1.5 Expected contributions ......................................................................................... 13
1.6 Disposition of the dissertation .............................................................................. 13
CHAPTER 2: LITERATURE REVIEW ................................................................... 16
2.1 Modern Portfolio Theory Framework ................................................................... 16
2.1.1 Concept of risk and return .............................................................................. 17
2.1.2 Assumptions of the modern portfolio theory ................................................... 18
2.1.3 MPT investment process ................................................................................. 19
2.1.4 Critism of the theory ....................................................................................... 20
2.2 Parameter estimation ............................................................................................ 21
2.2.1 Expected returns parameter ........................................................................... 23
2.2.2 The covariance matrix parameter ................................................................... 25
2.3 Portfolio Selection ................................................................................................ 30
2.3.1 Mean-Variance Model .................................................................................... 30
2.3.2 Global Minimum Variance Model (GMV) ...................................................... 32
CHAPTER 3: THEORETICAL FRAMEWORK ..................................................... 34
3.1 Basic preliminaries ............................................................................................... 34
3.1.1 Return ............................................................................................................ 34
3.1.2 Variance ......................................................................................................... 35
i
3.2 Portfolio Optimization .......................................................................................... 36
3.3 The estimators of covariance matrix ..................................................................... 37
3.3.1 The sample covariance matrix (SCM)............................................................. 38
3.3.2 The single index model (SIM) ......................................................................... 39
3.3.3 Constant correlation model (CCM) ................................................................ 41
3.3.4 Shrinkage towards single-index model (SSIM)................................................ 42
3.3.5 Shrinkage towards Constant correlation Model (SCCM) ................................ 44
3.3.6 Shrinkage to identity matrix (STIM) ............................................................... 47
CHAPTER 4: METHODOLOGY .............................................................................. 51
4.1 Input Data............................................................................................................. 51
4.2 Portfolio performance evaluation methodology .................................................... 55
4.3 Transaction costs .................................................................................................. 59
4.4 Performance metrics ............................................................................................. 60
4.4.1 Sharpe ratio (SR)............................................................................................ 60
4.4.2 Maximum drawdown (MDD) .......................................................................... 61
4.4.3 Portfolio turnover (PT)................................................................................... 61
4.4.4 Winning rate (WR) ......................................................................................... 62
4.4.5 Jensen’s Alpha ............................................................................................... 62
4.4.6 The statistical significance of the differences between two strategies on the
performance measures ............................................................................................ 63
4.5 VN - Index and 1/N portfolios benchmarks .......................................................... 64
CHAPTER 5: EMPIRICAL RESULTS ..................................................................... 66
5.1 VN – Index and 1/N portfolio performance .......................................................... 66
5.1.1 VN – Index performance ................................................................................. 66
5.1.2 1/N portfolio performance .............................................................................. 69
5.2 Portfolio out – of –sample performance ................................................................ 72
5.2.1 Sample covariance matrix (SCM) ................................................................... 72
5.2.2 Single index model (SIM) ............................................................................... 76
5.2.3 Constant correlation model (CCM) ................................................................ 79
ii
5.2.4 Shrinkage towards single index model (SSIM) ................................................ 82
5.2.5 Shrinkage towards constant correlation model (SCCM) ................................. 90
5.2.6 Shrinkage towards identity matrix (STIM) ...................................................... 95
5.3 Summary performances of covariance matrix estimators on out – of – sample ..... 99
CHAPTER 6: CONCLUSIONS AND FUTURE WORKS ...................................... 105
6.1 Conclusions ........................................................................................................ 105
6.2 Future works ...................................................................................................... 111
REFERENCES ................................................................................................................
iii
List of Abbreviations
APT: Arbitrage Pricing Theory
CAPM: Capital Asset Pricing Model
CCM: Constant Correlation Model
DIG: Development Investment Construction Joint Stock Company
GDP: Gross Domestic Product
GICS: Global Industry Classification Standard
GMV: Global Minimum Variance Model
HOSE: Ho Chi Minh City Stock Exchange
HNX: Ha Noi Stock Exchange
ICF: ICF Cable Joint Stock Company
IPO: Initial Public Offering
MDD: Maximum Drawdown
MLE: Maximum Likelihood Estimator
MV: Mean - Variance
MVO: Mean-Variance Optimization
MPT: Modern Portfolio Theory
OLS: Ordinary Least Squares
PT: Portfolio Turnover
REE: Refrigeration Electrical Engineering Corporation
SAM: Sam Holdings Corporation
SCM: Sample Covariance Matrix
SIM: Single Index Market Model
SSIM: Shrinkage towards Single-index Model
SCCM: Shrinkage towards Constant Correlation Model
STIM: Shrinkage to Identity Matrix
SR: Sharpe Ratio
UPCoM: Unlisted Public Company Market
USD: United States Dollar
iv
VIC: Vingroup Joint Stock Company
VND: Viet Nam Dong
VN - Index: Vietnam stock index
WR: Winning rate
YEG: Yeah1 Group Corporation
v
List of Figures
Figures
Pages
Figure 1.1: The performance of investment funds in the period of 2009 – 2019
2
Figure 1.2: The performance of investment funds in the period of 2017 – 2019
3
Figure 1.3: Determinants of portfolio performance
4
Figure 2.1 The MPT investment process
18
Figure 4.1: The universe of stocks on HOSE from 2013 – 2019
52
Figure 4.2: The number of listed companies into industry groups on HOSE,
2019
53
Figure 4.3: The market capitalization of industry groups on HOSE, 2019
54
Figure 4.4: Back – testing procedure
57
Figure 5.1: VN-Index’s performance in the period of 2013 – 2019
64
Figure 5.2: Back-testing results of 1/N portfolio benchmark on out – of –
sample from 1/1/2013 – 31/12/2019
Figure 5.3: Back-testing results of SCM on out – of – sample from 1/1/2013 –
31/12/2019
Figure 5.4: Compare the cumulative return between SCM and VN-Index
Figure 5.5: Back-testing results of SIM on out – of – sample from 1/1/2013 –
31/12/2019
Figure 5.6: Compare the cumulative return between SIM and VN-Index
Figure 5.7: Back-testing results of CCM on out – of – sample from 1/1/2013 –
31/12/2019
69
72
73
75
76
78
Figure 5.8: Compare the cumulative return between CCM and VN-Index
79
Figure 5.9: Back-testing results of SSIM on out – of – sample from 1/1/2013 –
82
vi
31/12/2019
Figure 5.10: Compare the cumulative return between SSIM and VN-Index
Figure 5.11: Back-testing results of SSIM’s shrinkage coefficient ( ) on out
– of – sample from 1/1/2013 - 31/12/2019
Figure 5.12: Back-testing results of SCCM on out – of – sample from
1/1/2013 – 31/12/2019
Figure 5.13: Compare the cumulative return between SCCM and VN-Index
Figure 5.14: Back-testing results of SCCM’s shrinkage coefficient ( ) on out
– of – sample from 1/1/2013 - 31/12/2019
Figure 5.15: Back-testing results of STIM on out – of – sample from 1/1/2013
– 31/12/2019
Figure 5.16: Compare the cumulative return between STIM and VN-Index
Figure 5.17: Back-testing results of STIM’s shrinkage coefficient ( ) on out
– of – sample from 1/1/2013 - 31/12/2019
vii
85
86
89
91
92
94
95
96
List of Tables
Tables
Pages
Table 2.1: Summarized works related to portfolio optimization
29
Table 4.1: The sample dataset are collected in the period of 2011 – 2019
51
Table 5.1: The performance of VN – Index in the period of 2013 – 2019
66
Table 5.2: The performance of the 1/N portfolio benchmark from 1/1/2013 to
31/12/2019
67
Table 5.3: The performance of SCM from 1/1/2013 to 31/12/2019
70
Table 5.4: The performance of SIM from 1/1/2013 to 31/12/2019
74
Table 5.5: The performance of CCM from 1/1/2013 to 31/12/2019
77
Table 5.6: The performance of SSIM from 1/1/2013 to 31/12/2019
80
Table 5.7: The performance of SCCM from 1/1/2013 to 31/12/2019
88
Table 5.8: The performance of STIM from 1/1/2013 to 31/12/2019
93
Table 5.9: Summary back-testing results of covariance matrix estimators on
out – of – sample
Table 5.10: The movement value of shrinkage coefficient ( )
viii
97 – 98
102
CHAPTER 1: INTRODUCTION
The target of this chapter is to introduce background information relating to the topic of
this dissertation as well as to provide its key points such as objective, research questions,
research questions and expected contributions.
1.1 Vietnam stock market overview
The Vietnamese stock market has been developing for 20 years since the Ho Chi Minh
City Stock Exchange officially came into operation in July 2000 with the first two
tickers, REE and SAM, hitting the historic turning point of the Vietnam stock market. So
far, the Vietnam stock market has had flourish development. The number of listed and
registered companies trading on two stock exchanges is 1.605 companies, with the stock
volume of 150 billion. The market capitalization as of the beginning of 2020 reached
nearly 5.7 million billion VND, accounting for 102.74% of GDP, thereby, showing the
significant role of Vietnam stock market to the economy.
Vietnam's stock market operates with three official exchanges, including two listed
(HOSE, HNX) and one unlisted (UPCoM) stock exchange. In specifically, Ho Chi Minh
City Stock Exchange (HOSE) is considered the largest scale exchange. By the end of
2019, HOSE had 382 listed companies; the trading volume reached 8.8 billion shares, the
average trading value reached more than 4,000 billion VND/session. Market
capitalization on HOSE accounts for 88% of the total market, equivalent to 54.3% of
GDP. Enterprises to be listed on the HOSE have to achieve higher standards in terms of
charter capital, time of operation, performance, information disclosure, and shareholders
structure. Specifically, enterprises registered to list on the HOSE need to have the
minimum charter capital contributed at the time of listing registration based on the book
value of VND 120 billion, higher than the amount of VND 30 billion on the Ha Noi
Stock Exchange (HNX). Regarding the time of operation, enterprises must have at least
two years of operation as a joint-stock company before the time of registration for listing
1
on HOSE while on HNX it takes one year. Regarding performance criteria, HOSE
stipulates that listed enterprises must have profitable business activities in the previous
two years, one year more than required by HNX. Regarding shareholder structure, HOSE
requires businesses to have a minimum of 300 non-major shareholders holding at least
20% of the voting stock of the company. For HNX, this standard is a minimum of 100
shareholders holding at least 15% of the shares. Especially, HOSE has higher listing
standards for information disclosure. Accordingly, the company must disclose all its
debts to internal persons, major shareholders, and related persons.
The development of Vietnam's stock market has attracted a growing number of domestic
and foreign investors, from 3000 trading accounts in 2000 to 2.5 million accounts in the
current period. In particularly, there are about 33,000 accounts of foreign organizations
and individuals with a total value of securities held nearly 35 billion USD as of June 30,
2020. During this period, many foreign fund management companies also joined
Vietnam's stock market. Investment results show that investment funds in the period of
2009 - 2019 have relatively good investment results compared to the average growth rate
of Vietnam's stock market (Figure 1.1).
Figure 1.1: The performance of investment funds in the period of 2009 - 2019
2
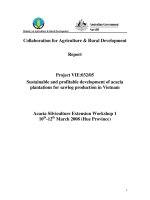
However, if you look at the period of 2017-2019, when Vietnam's stock market is facing
many difficulties due to complicated developments from the US-China trade war and the
recession of major economies in the world gender has led to disappointing investment
results of domestic and foreign investment funds, even the portfolio value of these
investment funds has fallen significantly more than the overall decline of the market
(Figure 1.2).
3.2%
0.0%
-4.3%
-6.6% -7.1%
-9.3% -9.6% -10.0%
-10.6% -10.7%
-11.7% -12.4%
-13.7%
VanEck
SSI-SCA
VN30
Index
VFMVF4
VFM
VN30
VCBF
-BCF
PYN
VFMVF1
VN Index
SSIAM
FTSE
VCBF
-TCF
VOF
VEIL
-16.9%
Figure 1.2: The performance of investment funds in the period of 2017 - 2019
According to research by Brinson, Singer, Beebover (1991), asset allocation activity has
a 91.5% impact on the investment results of the portfolio, while securities selection,
buying, and selling time and other factors affecting only about 9% of the portfolio
results (Figure 1.3). However, asset allocation and optimal portfolio selection on
Vietnam's stock market are relatively new and face many difficulties due to the
following main reasons:
3
2% 2%
5%
Asset Allocation
Security Selection
Market Timing
Other Factors
91%
Figure 1.3: Determinants of portfolio performance
First, the application of quantitative methods in asset allocation and optimal portfolio
selection is quite new in Vietnam's stock market, especially for individual investors. The
majority of investors in the Vietnamese stock market are individual investors, who
mostly use fundamental and technical analysis methods to select stocks. The optimal
investment portfolio construction is primarily selected by investors according to their
own feelings or subjective judgments, not based on specific quantitative methods.
Besides, there are also a few individual investors actively in using quantitative models to
choose optimal portfolios. However, these models are traditional models with certain
limitations and not highly applicable.
Next, the particularities of the Vietnam stock market make it difficult for investors,
especially for investment funds who want to apply quantitative models in choosing
optimal portfolios. The first is data problem. Although the Vietnamese stock market has
gone through 20 years of development; however in the early stages, the number of
companies participating in the market is not much, and the quality of information stored
in this period is also not guaranteed. This affects not only the length of the data but also
4
its quality. Meanwhile, we know that today’s modern methods of portfolio optimization
require the size of research data to be large enough and the reliability of the data to be
guaranteed. Moreover, regulations on the Vietnamese stock market make it difficult for
investors to build optimal portfolios using quantitative models. For example, the
regulations of daily trading limit on HOSE (±7%) and HNX (±10%), UPCoM (±15%).
This means that the prices of stocks on the market can only fluctuate by a certain margin
regardless of how bad or good the market moves. The regulation can help stabilize
investors' sentiment during periods of deep decline or hot bull market, but it also prevents
the market events from being fully reflected in the prices of stocks, making it difficult for
investors to forecast the fluctuation of their portfolio in the future.
Furthermore, the delay settlement date of a stock is up to some business days that
influence the testing and adoption of portfolio optimization models. Investors who
execute a buying transaction of stock today ( ), they must be waiting for three business
days (T+3) to be able to selling this stock on Vietnam stock market. Besides, after they
sell this stock, they need to wait two more business days (T+2) to start with another
buying transaction or accept interest payments to the stock company during these two
days to have money to support their buying transaction immediately. These limitations of
Vietnam stock market increase risks and incur much transaction costs for investors.
Moreover, these restrictions also make it difficult to apply the high – frequency trading
models on the Vietnamese stock market. Therefore, in the process of building the optimal
portfolio selection models, they need to consider and calculate the impact of these
restrictions on their models when applying the models in practice.
Moreover, the liquidity risk is also one of the important factors leading to deviations in
the practical application of portfolio optimization models. The market size is small and
the number of shares traded during the day is not much, leading to high liquidity risks for
investors when they want to buy or sell stocks in large quantities. Thus, when developing
and back-testing the quantitative models, investors need to pay attention to this slippage
factor in the stock trading activity, especially the transactions with large volume of
buying and selling in their portfolios. Otherwise, the theoretical buying and selling prices
5
could be significantly different from the actual buying and selling prices, which in turn
affects the reliability of the optimal portfolio selection models.
Therefore, the research and selection of an appropriate portfolio optimization method is
essential for investors on the Vietnam stock market. In the next sections, the author will
focus on presenting suitable methods in selecting the optimal investment portfolios on the
stock market in general and the Vietnamese stock market in particular.
1.2 Problem statements and research gap
Modern Portfolio Theory (MPT) has been playing an important role in the selection and
construction of investment portfolios for over 65 years, since it was firstly introduced by
Harry Markowitz in his “Portfolio Selection” (1952) article. The framework of MPT is to
attain as highest return as possible for a certain level of risk through structuring the
optimal weights of various assets (Iyiola, 2012). Although it is broadly employed in
practical investment activities, the main assumptions of MPT model have been facing
great challenges in recent years. One of the main reasons comes from the two main inputs
of MPT that are the mean and the covariance matrix of asset returns.
To implement the technique in practice, investors have to estimate the mean and the
covariance matrix of assets’ return. At this point, sample mean as well as covariance
matrix approaches are usually employed. However, these estimators are not really stable
in many cases because of estimation error, this makes the weights of portfolio fluctuate
continuously over time. As a result, the mean – variance portfolios are difficult to be
applied in practice by the portfolio managers. Moreover, many well – known empirical
evidences showed that these portfolios underperformed in term of mean and variance
metrics during the out–of–sample period (Michaud, 1989).
In general, there are two ways to overcome the challenges of MPT that are to initiate the
new approaches for estimating the expected return and covariance matrix of assets in
portfolio optimization. The well-known models have been utilized to estimate expected
return parameter such as Capital Asset Pricing Model (CAPM) and Fama – French
6
models. The CAPM, which is considered as one – factor model, describes a linkage
between systematic risk and expected return of assets. Meanwhile, Fama – French states
that the expected returns of assets should be explained by some other variables besides of
beta coefficient of CAPM such as size risk, value risk factor, profitability, and investment
factor. In addition, the robust estimators are also applied by the researchers and portfolio
managers to improve the expected return estimation, for example the truncated/trimmed
mean or winsorized mean are employed by Martin, Clark and Green in 2010. Moreover,
the other robust estimation methods like M – estimator or S – estimator, Bayes – Stein
estimator are developed to solve the non-stationary returns limitation in estimating the
expected return input.
The improvement of estimating assets’ expected returns is one of the ways to remedy
MPT’s shortcomings. However, the results of Merton’s research (1980) showed that it is
not easy to measure the expected return (µ). In most asset price models, they made an
assumption that there is a linkage between the assets’ expected return and the market’s
expected return (
), in which (
) is constant overtime. Although this assumption
makes the assets’ expected return estimation to be easier, it would still take a very long
time series to estimate µ accurately (Merton, 1980). Moreover, all we know that the
assumption of constant expected return is not reasonable, but if this assumption is
relaxed, the estimating µ will be even harder. This paves the way for a second research
direction, selecting portfolios based on the covariance matrix estimation instead of the
expected return estimation. The estimation of covariance matrix parameter is an
important research direction that researchers have paid special attention in the recent
period, due to the potential of this method in improving stability and minimizing risk in
selecting the investment portfolios.
The instability of the mean-variance portfolios comes from estimating the mean assets
return. Thus, the minimum – variance portfolios have recently been used by many
researchers and portfolio managers. In this method, the investigated portfolios are
primarily based on the estimation of covariance matrix, making them less sensitive to
7
the estimation errors (Jagannathan and Ma, 2003). Moreover, Jagannathan and Ma
suggested that “the estimation error in the sample mean is so large that nothing is lost in
ignoring the mean altogether”. This argument also provides detailed empirical evidence
showing that the minimum-variance portfolio is likely to outperforms on Sharpe’s ratio
and other performance metrics in out-of-sample period than any other mean-variance
portfolios (DeMiguel, 2005; Jagannathan and Ma, 2003).
Demiguel (2009) stated that although the minimum-variance portfolio does not depend
on the mean returns estimation, it is still under great impact of estimation error. The
sensitivity of the minimum-variance portfolio to estimation error is quite interesting.
“These portfolios are based on the sample covariance matrix, which is the maximum
likelihood estimator (MLE) for normally distributed returns. Moreover, MLEs are
theoretically the most efficient for the assumed distribution; that is, these estimators have
the smallest asymptotic variance provided the data follows the assumed distribution”. At
this point, a question was raised that why the sample covariance matrix generates
unsuitable portfolios. Huber (2004) answered that “the efficiency of MLEs based on
assuming normality of returns is highly sensitive to deviations of the asset-return
distribution from the assumed (normal) distribution. In particular, MLEs based on the
normality assumption are not necessarily the most efficient for data that depart even
slightly from normality”. For portfolio selection, this is very useful as comprehensive
evidence indicates that the empirical return distribution is generally different from
normal distribution.
Moreover, although the core of minimum - variance portfolio researches relies solely on
how to estimate reliably the covariance matrix, however, almost traditional approaches of
covariance matrix estimation such as using the sample covariance matrix (SCM) or
ordinary least squares (OLS) face many problems in the case of high-dimensional
portfolios. Having large dimensionality means that it is easier to get unexpected and
uncontrollable errors in some of computational steps, and the sample data may not be
enough for the estimation of the true covariance matrix. These lead to the estimated
8
covariance matrix to become ill-conditioned or even singular which is very popular in
matrix computation research. Consequently, the portfolios selected from considering the
sample covariance matrix often perform poorly and fail in generating profit. To solve this
problem, some new estimators of covariance matrix are conducted by many researchers
and portfolio managers. There have been many approaches proposed in the literature, and
among them, Ledoit and Wolf (2003) proposed to select the optimal portfolios by using
the shrinkage estimator of covariance matrix. This method is a combination between a
rough sample covariance matrix and a high-structured target matrix to achieve the
balance between bias and variance. The balance can be customized, which is the trade-off
between bias and estimation errors recognized by shrinkage coefficients. The shrinkage
technique shows theoretically and empirically attractive approach to a high-dimensional
portfolio's covariance estimation problem since it ensures a well-defined covariance
matrix is achieved. Liu (2014) estimated the covariance matrix by applying the weighted
average of different shrinkage target matrices, instead of using a single shrinkage target
matrix as Ledoit and Wolf method. Next, by inheriting the potentials and development of
Random Matrix Theory, Ledoit and Wolf extended their pilot works (Ledoit & Wolf,
2017a, 2017b) by using a nonlinear transformation applied for the eigenvalues
considering solely the sample data. Also, coefficient asymptotically leads to the
maximization of the out-of-sample expected utility. Then, they performed both numerical
and empirical investigation where the out-of-sample behavior of the obtained estimator is
analyzed and it shows remarkable improvements over the simple diversification, and its
robustness is expressed to the deviations from normality. As a matter of fact, DeMiguel et
al. (2013) provided an important review paper of shrinkage frameworks and their
practical application especially for asset optimization, and then they also discussed on a
new category of shrinkage-based techniques for the means of return and the
corresponding covariance matrix, as well as, the weights in the asset. As a slight
enhancement for this research approach, the work of Candelon et al. (2012) presented
such a kind of double shrinkage adaptation to improve the general stability of the
9
estimation on even small sample sizes covariance matrices via taking into account a ridge
regression approach to shrink the all the weights towards the equally-weighted asset.
Research gap
Clearly, the selection of covariance matrix estimators influences the performance of
optimized portfolios. The above approaches for covariance matrix estimations pose an
opportunity for investors, who usually apply the traditional estimator of sample
covariance matrix, to improve their portfolio performance by altering the new estimators
of covariance matrix in their portfolio optimization models. The problem is that there is
not a complete and sure research base regarding the effectiveness of out – of – sample
performance when making changes to covariance matrix estimations. In the other words,
there is no solid foundation involved in this field, and portfolio managers would not risk
their money to make investments based on unproven or rigorous research.
Moreover, the traditional estimator of covariance matrix is facing many difficulties and
does not bring the expected results because the development of the financial market has
resulted in the number of investment assets in the market increasing rapidly and much
larger than the observed sample, from that requiring the new estimators of covariance
matrix to be studied and applied. Besides, there is still a lot of controversy surrounding
the applicability and effectiveness of covariance matrix estimation methods in different
markets.
Furthermore, the robust estimators of covariance matrix are mainly applied and tested in
the developed markets; there are not many researches on emerging and developing
financial market. In particular, there is almost no research in Vietnam related to the
selection of covariance matrix estimators for optimizing the portfolios, especially in the
shrinkage methods. Therefore, there is a gap for the author to investigate the level of
influence of covariance matrix estimators on the minimum – variances optimized
portfolios, and to test the performance of these estimators on Vietnam stock market.
10
1.3 Objectives and research questions
The objective of this dissertation is to investigate that whether the investors can improve
the performance of minimum – variance optimized portfolios by altering the estimators of
covariance matrix input. Besides, based on the results of out – of – sample portfolio
performance metrics, the dissertation is going to select the suitable estimators of
covariance matrix for portfolio optimization on Vietnam stock market.
In order to achieve the above objectives, this dissertation will attempt to answer the
research questions as follows:
Question 1: How do the robust estimators of covariance matrix perform on out – of –
sample performance metrics such as portfolio return, level of risk, portfolio turnover,
maximum drawdown, winning rate and Jensen’s Alpha in selecting minimum – variance
optimized portfolios?
Question 2: How do the estimators of covariance matrix affect the out – of – sample
performance of minimum – variance optimized portfolios when the number of assets in
the portfolio changes?
Question 3: Could the alternation of covariance matrix estimation for portfolio
optimization beat the traditional estimator of covariance matrix and benchmarks of stock
market on out - of - sample?
1.4 Research Methodology
In order to achieve the research objectives and answer the above questions, the author
needs to choose an appropriate research method. In this dissertation, the author applied
some research methodology as follows:
First, there are six estimators of covariance matrix used in this study to examine how the
change of covariance matrix estimation affects the optimal portfolio selection. These
estimators of covariance matrix includes the sample covariance matrix (SCM), the single
index model (SIM), the constant correlation model (CCM), the shrinkage towards single
11
index model (SSIM), the shrinkage towards constant correlation model (SCCM), and the
shrinkage towards identity matrix (STIM). In which, SCM is seen as the traditional or
standard estimator of covariance matrix while SIM and CCM are called as model – based
approaches; and SSIM, SCCM, STIM are mentioned as shrinkage methods. In addition,
the minimum – variance optimization is selected for generating the optimal portfolios
through the estimated covariance matrices by the above estimators.
Second, to evaluate the feasibility and potential application of the estimators of
covariance matrix mentioned above, a back-testing process based on the Python
programming language has been developed and applied in this study. The back – testing
process was simulated on the back – testing platform in the previous research of Tran et
al. (2020). The statistical properties of estimators of covariance matrix will be examined
and clarified by the back – testing procedure, from that providing insight into whether
which estimator will be able to make profit in the reality.
Third, through the back – testing process, the portfolio performance metrics which are
considered as the important criteria for evaluating the portfolios will be estimated.
Besides of the basic portfolio evaluation criteria such as portfolio return and volatility of
portfolio, other useful evaluation criteria are also calculated in this research including
portfolio turnover, maximum drawdown, winning rate and Jensen’s Alpha. In order to
calculate these portfolio evaluation criteria, the author used a “rolling – horizon”
technique that defines as a reactive scheduling method that “solves iteratively the
deterministic problem by moving forward the optimization horizon in every iteration;
assuming that the status of the system is updated as soon as the different uncertain or not
accurate enough parameters became to be known, the optimal schedule for the new
resulting scenario (and optimization horizon) may be found” Silvente et al.(2015). The
rolling – horizon approach allows the investors to update or adjust their input data for
optimal portfolio selection based on currently available information. The technique will
be presented more clearly in the next sections. Moreover, the input data for the back testing process are weekly stock price series, which will then be converted to weekly
12
return during the optimization procedure. One more thing, when calculating the portfolio
performance metrics, the transaction costs are also considered at every rebalancing point.
Lastly, these estimated performance metrics are applied for comparing the differences
among the estimators of covariance matrix in selecting the optimal portfolios. To make
sure that there are significant differences of performance metrics between the two certain
estimators, the p – values are computed following the bootstrapping methodology that is
mentioned in the research of DeMiguel (2009).
1.5 Expected contributions
After answering the research questions and achieving the research objective, this
dissertation will expect to make some contributions as follows:
First, through empirical research on the Vietnamese stock market, the dissertation has
added concrete evidence that investors can improve their portfolio’s investment
performance by using the estimation methods to adjust the covariance matrix parameter
in the portfolio optimization. These empirical research results show that the model –
based estimators of covariance matrix (SIM, CCM) and the shrinkage estimators of
covariance matrix (SSIM, SCCM, STIM) give much superior results compared to the
traditional sample covariance matrix (SCM) on almost tested portfolios (N = 50, 100,
200, 350) and most portfolio performance metrics such as portfolio return, level of risk,
portfolio turnover, maximum drawdown, winning rate and Jensen’s Alpha. In particular,
this superiority is more evident when the number of stocks considered in the portfolio
tends to increase.
Second, among the estimators of covariance matrix mentioned in this dissertation, the
shrinkage estimators of covariance matrix show outstanding results compared to other
estimators and benchmarks of market on almost the portfolio evaluation criteria,
especially in the case of high – dimensional portfolios. Besides, the shrinkage towards
constant correlation model (SCCM) reflects the most efficient level of optimal portfolio
13
selection compared to the shrinkage towards single index model (SSIM) and shrinkage
towards identity matrix (STIM).
Third, another new point of the dissertation is to consider the performance of the
estimators of covariance matrix under the influence of dimension of covariance matrix
and the effect of transaction costs in computing the portfolio performance on out – of –
sample. Specifically, the dissertation has evaluated the effectiveness of the estimation
methods when the number of stocks in the portfolio changes from N = 50 to N = 350
while the transaction costs considered at every rebalancing point is 0.3%.
Fourth, one more point is that the dissertation uses a variety of criteria to measure the
effectiveness of a portfolio. In order to have multi-dimensional perspectives and a
reasonable assessment of the effectiveness of estimation methods in the selection of the
optimal portfolio, the dissertation employs more portfolio performance metrics such as
Sharpe ratio, portfolio turnover, maximum drawdown, winning rate or Jensen’s Alpha to
evaluate the performance of the selected portfolios, instead of using the common
performance metrics including return and variance criteria like the previous researches.
This can be seen as the author's effort in analyzing the effectiveness of the covariance
matrix estimation methods compared to previous studies.
The final contribution of this dissertation is that all estimators of covariance matrix have
been experimented on Vietnam stock market where is considered as an emerging market.
Although, there are many researchers and financial practitioners using the estimation
methods to optimize their investment portfolios on the developed financial market such
as US or European, however, there are very few researches employing this method on the
emerging market, especially on Vietnam stock market. The empirical results of this study
will support the researchers and investors to see clearly the different performance of the
estimators of covariance matrix between the emerging financial market and the
developed financial market.
14
1.6 Disposition of the dissertation
This dissertation includes 6 chapters, in which Chapter 1 focuses on the problem
statements, objectives of the study, research questions, research methodology as well as
expected contributions of the research. The next chapters are presented as follows:
Chapter 2, Literature Review, provides an overall review about relevant researches
regarding portfolio optimization before developing a specific theoretical framework and
methodology in the next chapter.
Chapter 3, Theoretical Framework, presents the foundation theory which underlies this
dissertation. First, some basic preliminaries and portfolio optimization problem will be
introduced in this chapter, and then theory regarding the covariance matrix estimations
will be developed.
Chapter 4, Methodology, deploys the basic methodology used for answering research
questions in the dissertation.
Chapter 5, Empirical Results, withdraws the empirical results in the dissertation based on
the back – testing performance of covariance matrix estimators on out – of – sample.
Chapter 6, Conclusions and future works, make some conclusion on findings of the
research as well as discuss about future works in the next researches.
15
CHAPTER 2: LITERATURE REVIEW
The purpose of the chapter is to provide a deep-dive literature review related with
portfolio optimization as well as motivating the theoretical framework and methodology
of this dissertation.
2.1 Modern Portfolio Theory Framework
Harry Markowitz is recognized as one of the pioneers in contributing his theory to
financial economics. In 1990, Markowitz deserved to receive the Nobel Prize for his
contributions related to the portfolio selection method. The “Portfolio Selection” article
was first published in 1952 in the journal “The Journal of Finance” and then written in a
book titled “Portfolio Selection: Efficient Diversification” in 1959. Markowitz's
groundbreaking work shaped what we today call modern portfolio theory (MPT).
The MPT is a method of investment for selecting and building investment portfolios that
seeks to maximize the expected return on the portfolio for a given amount of portfolio
risk or to reduce the risk of the expected return level by carefully choosing the weights of
different assets. Although the MPT is commonly applied in the investment sector, the
basic assumptions of the MPT remain controversial in recent years.
The MPT which is an improvement on the classical quantitative models plays a pivotal
role in the mathematical modeling of finance. This framework motivates the
diversification to protect the investment portfolios from market risk as well as specific
risk of company. Sometimes, the theory is also called Portfolio Management Theory
because it supports the investors to classify, evaluate and measure both the expected risk
and return. The main idea of this theory is its quantification of relationship between risk
and return, and assuming that investors have to be compensated for taking risks.
The diversification concept of MPT is to select the investment portfolios that have lower
risk than any security in the portfolios. The diversification can lower the investment risk
no matter what the correlation between security returns is positive or negative. More
16