Some Commonly Used Models
Bạn đang xem bản rút gọn của tài liệu. Xem và tải ngay bản đầy đủ của tài liệu tại đây (1.3 MB, 34 trang )
|
!
-
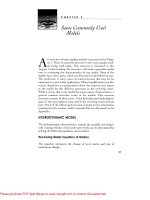
~C H A P T E R 3
Some Coninionly Used
Models
n overview of water quality models was presented in Chapter 1. There is a general structure in the water quality modk.hels
being used today. This structure is discussed in this
chapter. Understanding this structure will assist a potential model
user in evaluating the characteristics of any model. Most of the
models have three parts, which are discussed in the following text.
The model user in many cases can omit processes that may not be
important in a particular application. These simplifications are discussed. Equations are presented to show the required user inputs
to the model for the different processes in the receiving water.
While it is true that every model has some unique characteristics, a
general common structure exists in the models. This common
structure consists of three parts: 1) the hydrodynamic/hydrological
part, 2) the mass balance part, and 3) the receiving water process
part. Much of the following discussion is based on the information
contained in the various model manuals that are discussed in the
Appendix.
HYDRODYNAMIC MODEL
The hydrodynamic characteristics, namely the spatially and temporally varying velocity vectors and water levels, can be determined by
solving the following equations, shown below.
ReceivingWater Equationof Motion
The equation represents
momentum change.
the change of local inertia and rate of
Please purchase PDF Split-Merge on www.verypdf.com to remove this watermark.
37
A
MODELING
WATER
QUAULTY
a&,'
at
- -(, at
a,~ ~ + n ,
axi
(1)
velocity in the i direction
l
=
t
= time
xi
= distance in the i direction
n
where
= gravity, friction, and wind acceleration
Gra 'ity= _g aH
ax.
(2)
Frictu7/z=
H
= depth
g
where
= acceleration resulting from gravity
-g-
where
(3)
(U. U.
=
bottom friction
R
Win=Ld
n
=
hydraulic radius = wetted area/perimeter
a•W2 cos (D
(4)
R p1
where
=
pP,,.p=
surface drag coefficient
density of air and water
W = wind velocity at 10 m
0
= wind angle
Receiving Water Equation of Continuity
The continuity equation is the time-varying water mass balance relationship, including water depth.
Please purchase PDF Split-Merge on www.verypdf.com to remove this watermark.
SOMECOMMONLY
USED
MODELS
aH
1
at
B
aQ
ax,
where
(5)
B
= width
Q = flow
The unknowns are the velocities and depths at various locations
and times. To solve the equations for these values, it is necessary to use
numerical methods on a spatial grid or elements. The user is required
to define the spatial grid, the time step for the numerical solution, the
upstream and downstream boundary conditions as functions of time,
the initial conditions, element cross-sectional information, and values
for n and Cd. The values for nj and Cd are estimated; then the model is
used. The predicted depths and velocities are compared to the values
in the calibration data set. If the Hvalues are too high, n is reduced and
the procedure is repeated until the H simulated values match the calibration data set H values. Next, the velocities are adjusted to match
measured values by adjusting C). The calibration is a trial-and-error
process that can be tedious, particularly when verification data sets are
also used, requiring further adjustments to the model.
This process is simplest in one dimension, becoming progressively more difficult in two and three dimensions. Primarily, n is
adjusted in the calibration process, and sometimes depth is adjusted
to ensure that water is not accumulating or running out of the segment for the modeling period. The adjustments to Cd are normally
minor. Theoretically, both ni and Cd)are probably different for each
element in the model; however, to do this in the calibration process
would be very time-consuming. In a typical model, ti would have 5
to 10 values over the modeling grid.
There is some numerical dispersion (Enum) precision introduced
by the numerical solution (backward or central differencing or
other schemes) which is a function of the time step (At), spatial grid
size (L), and velocity ([/) (Enum =(U/2)(L-UAt)). Many manuals
provide methods for determining the numerical dispersion for the
model numerical solution used, as well as methods for applying a
factor to the advection terms which will reduce the numerical dispersion on the predictions. And because the model predictions are
for grid locations and "n" and 'Cd" are assumed constants for areas
of the model and time, the predictions can be expected only to
Please purchase PDF Split-Merge on www.verypdf.com to remove this watermark.
WATER
QUALITY
MODELING
match measured data sets approximately. The velocities and water
depths predicted from these two equations are used as inputs to the
next model part.
The only model simplification possible for the hydrodynamic part
of a model is to assume steady-state conditions and reduce the
dimensions to twvo or, if possible, one. There are a couple of tricks
that
can extend
the capabilities
of simplified
models.
Steady-state
models can be run repeatedly for different conditions to simulate
time-variable
conditions, and in some instances the model dimen-
sions can be reduced to one dimension by using streamlines as an
axis.
MASS BALANCE
DischargedSubstanceMass Balance Equation
A general mass balance equation is the time-varying conservation of
the mass of a substance dissolved or suspended in the water.
ac
at
-
a-TL•)
axta
where
+
a (E
axt,
dC)
+
(6)
a.Jx
C = concentration
l,T
velocityin directioni
= distance in direction i
=
E. = diffusion coefficient direction i
S. = sources point and non-point, boundary
loading rate, atmospheric, kinetic transforms
In the general mass balance equation above, the first term on the
right-hand side of the equation is referred to as the advection or
transport component, the second term is the dispersion component,
and the last term is the sources and sinks.
The finite difference form of the mass balance equation for the
numerical solution consists of the following.
Please purchase PDF Split-Merge on www.verypdf.com to remove this watermark.
SOMECOMMONLY
USED
MODELS
Discharged Substance TransportEquations
Transport equations
are used to represent
the movement
stance dissolved or suspended in the water.
AV=
(fYoft, + precipitation
V
where
A(v)
where
eaporatiwn)
(7)
= volume
QC +-
:
-
of a sub-
- Qp(D
(R (fDA(C
+-
,ACf
+X RAC+
(8)
n))) + XW + yVSk
C = concentration
Q = flow
Qp = pore water flow
f, ,/S = dissolved and solids fractions
W
s
= solids transport
A
= area
R
= dispersive
Rp=
7
dispersive
velocity
flow
pore water
flow
W
= sources and sinks - point, non-point
ary sources
S
= kinetic
Each parameter
introduces
bound-
transforms
another
equation
as shown
below.
Pore Water Advection
___
='
where
C*'IDC
illf = mass of chemical
Please purchase PDF Split-Merge on www.verypdf.com to remove this watermark.
(9)
U
WATER
QUALiTY MODELING
C = total chemical concentration
N = porosity
f = dissolved fraction of chemical
Q = pore water flow rate
Sediment Advection
H,
aSi = DS, - (G'R
__
where
+ "'S)
i
S$
H
sediment
= water
= depth
I
(10)
= sediment concentration
j
[s )=
deposition velocity
wR = scour velocity
s= sedimentation velocity in upper benthic
layer
The user can select any or all of the advection relationships
above. In all cases, the user must provide the segment interfacial
areas, characteristic lengths, and segmentation. In addition, for the
sediment advection, the sediment transport velocity and fraction
absorbed to sediment must be provided.
Similar mathematical relationships can be developed for the dispersion terms. In these relationships, the user must provide the dispersion coefficient as a function of time and, for the pore water, the
dissolved fractions in the water and sediment.
In the mass balance part of the model, the user can add or delete
advection or dispersion terms to suit a particular application of the
model. However, the addition of each term requires that the user
define the appropriate coefficient for the model application. The next
model part is the receiving water processes.
Please purchase PDF Split-Merge on www.verypdf.com to remove this watermark.
SOME COMMONLY USEDMODELS ]3
RECEIVING WATER
PROCESSES
Dissolved
Oxygen
The receiving water DO processes are shown in Figure
processes can be expressed in an equation as follows:
dt= K2(0
(t-
where
0)+ (a 3f
-
0, 0°
a 4p)Gn -K 1 L -K
=
DO and
(mg/L)
DO
rate of oxygen
photosynthesis
a13
=
a4
4
/H- a
5
saturation
uptake
(mgO/mgGn)
a5
= rate of oxygen uptake
nitrogen (mgO/mgA\)
a6
r
concentration
per unit of ammonia
per unit
rate (temperature
= algal respiration
ent) (1/day)
G/l = algal bio-mass
a6 8N 2 (11)
per unit of algal
= rate of oxygen uptake
nitrogen (mgO/mgN)
mn = algal growth
(1/day)
-
production
per unit of algal
(mgO/mgGn)
= rate of oxygen
respired
N
3.1. These
of nitrite
dependent)
rate (temperature
concentration
depend-
(mg/L)
depth (m)
H
=
L
= concentration
K,
= BOD
of ultimate
deoxygenation
dependent)
(1/day)
K 2 = re-aeration
(1/day)
K 4 = SOD
rate
BOD
rate
(temperature
(mg/L)
(temperature
dependent)
(g/m 2 day)
Please purchase PDF Split-Merge on www.verypdf.com to remove this watermark.
Cl
WATER
QUALITY
MODELING
=
ammonia oxidation rate coefficient
ature dependent)
(I/day)
,2
= nitrite oxidation
ture dependent)
N1
= ammonia
A'9
= nitrite
rate coefficient
(1/day)
nitrogen
nitrogen
(temper(tempera-
(mg/L)
(mg/L)
Equation 11 states that the dissolved oxygen concentration
is the
sum of the sources (re-aeration
and net algal production)
and the
sinks (BOD, SOD, and nitrogen oxidation).
NMost models include
algal growth equation options based on the available light and photosynthetic rates, which the user can select. If algal production
is not
a factor in the oxygen balance (e.g., if receiving water turbidity is
high or is fast-running
water or is nutrient-depleted
or chlorophyll
a
<10 ug/L), the algal oxygen production
term can be omitted. Some
dissolved oxygen measurements
over a 30-hour period during the
growth period for aquatic plants can be used to determine whether
algal bio-mass is a factor in the dissolved oxygen balance. Similarly,
other terms in the equation can be omitted if these are not considered
a factor. The terms can also be extended if necessary. For example,
macrophytes
may be the largest source of oxygen production.
In this
case, an area measurement
term would have to be added for the
macrophytes,
that is like the SOD term, not a volume measurement
like the algal bio-mass term.
As discussed previously, the model prediction precision is generally improved if the model is simplified. Re-aeration
and SOD are
difficult to measure in the field. Re-aeration
is normally computed
from empirical relationships
for the type of receiving water (lake,
river, and ocean). These empirical
relationships
are available as
options in many models. Some DO depth profile measurements
near
the bottom will clearly show whether SOD is a factor. If it is, the DO
concentrations
will be lower just above the bottom sediments. These
profiles should be measured when the receiving water is at its highest temperature.
In general, if the total organic carbon in the sediments measured by the loss on ignition is less than 3 percent, SOD
is probably not significant. If SOD is a factor, some in situ measurements should be made. It is also possible to quantify the SOD by a
method of difference. In other words, provide all the other sources
Please purchase PDF Split-Merge on www.verypdf.com to remove this watermark.
SOMECOMMONLY
USED
MODELS
and sink information to the DO balance, then assign the difference
to SOD; however, because the re-aeration as quantified by empirical
equations can be imprecise, SOD should be measured if it is a factor
in the oxygen demand balance.
Some models allow the user to specify the level of complexity to
be used in the model. In the case of the DO balance, these levels may
be as follows:
1. BOD and SOD
2. BOD (carbonaceous+ nitrogenous) and SOD
3. Full equation.
Using the model at a lower level of complexity is a useful
approach when the amount of' site-specific data is limited. It is normally possible to determine whether a more complex level of modeling is required for a particular application by testing the simplified
model on separate verification data sets. If the predictions from the
simplified model differ from the verification data sets, more
advanced forms of the model should be tried. In this way, the appropriate level of the model will be identified.
Nutrients
The nutrient processes are presented in Figures 2.2 and 2.3. The
nitrogen can be considered to exist in four components: phytoplankton nitrogen, organic nitrogen, ammonia, and nitrate. Although some
models lump some of these components together, the four will be discussed separately here. Nitrogen processes in the receiving water are
complex, and considering the four nitrogen components separately
simplifies the modeling process.
Ammonia (Cl)
aCl = (mineralization)- (growth) - (nitrification) + (death)
(12)
at
Mineralization = conversion of organic nitrogen to the inorganic form
Please purchase PDF Split-Merge on www.verypdf.com to remove this watermark.
l
M
WATER
QUALITY
MODELING
Growth
= take-up
Nitrification
Death
Nitrate
of nitrogen
= conversion
by the phytoplankton.
to nitrate.
= recycling of organic
mortality
nitrogen
from phytoplankton
(C2)
aC9 - (nitrification)
- (growth)
Denitrification
= nitrate
- (denitrification)
(13)
to nitrogen
Phytoplankton
Nitrogen
(C.)
aC 3 = (growth)
- (death)
- (settling)
(14)
at
Organic
aC4
=
Nitrogen
(death)
(C 4 )
- (mineralization)
- (settling)
(15)
at
There are obviously many coefficients,
rate terms, and fraction
partitioning
required
for the components
of the nitrogen process.
Manuals do provide a range of values for the required inputs and the
default options that the model will use if the user does not provide
values to the model.
Similarly, phosphorus
kinetics can be considered
as three components: phytoplankton
phosphorus,
organic phosphorus,
and inorganic
phosphorus
(orthophosphate).
The kinetics
of these
components
can be represented
by the following equations:
Phvtoplankton
C 5 (P/C>)
at
=
phosphorus
(growth)
(C.)
- (death)
- (settling)
Please purchase PDF Split-Merge on www.verypdf.com to remove this watermark.
(16)
SOMECOMMONLY
USED
MODELS
where
P/C = phosphorus to carbon ratio in phytoplankton
Organic phosphorus (C6 )
aC6 = (death) - (mineralization) - (settling)
at
(17)
Inorganic phosphorus (C7)
a_7 = (mineralization) - (growth) - (settling)
(18)
Like the nitrogen component equations, coefficients, rate parameters, and partitioning are required for the phosphorus processes.
The range of values for these required inputs is provided in the manuals, as well as the default options.
Some models allow the user to select the level of complexity for
the phytoplankton-nutrient kinetics similar to the DO balance. If the
data available for the site are limited, simpler models once again are
more appropriate, at least initially.
Heavy Metals
Heavy metal kinetics in a receiving water is complex because the
metals can exist as soluble organic or inorganic complexes, sorbed
onto organic or inorganic particles, and precipitate or dissolve. All
the soluble components can be lumped into the dissolved term.
WASP4 provides a modeling framework at four levels of complexity.
Because the partitioning coefficients depend on the sorbent character of the suspended solids, there are no consistent partitioning coefficients. Site-specific measurements are required for heavy metal
predictions. The transport kinetics of suspended solids is included in
the mass balance part of the model (see equation 10); however, the
partitioning coefficients in this equation are for the liquid or solid
stage. The partitioning of a substance between dissolved and sorbed
for equation 10 is predicted in this model component. If site-specific
data are limited at the site, simpler model configurations should be
Please purchase PDF Split-Merge on www.verypdf.com to remove this watermark.
U
i
WATER
QUALITY
MODELING
used. For example, in the WASP4 model, the user can select from
the following levels of complexity for the metal predictions:
1. Specilf average concentration field by setting the initial conditions.
The solids concentrations will then influence the chemical partitioning.
2. Specify average concentration
sedimentation velocities.
field and settling, deposition, scour, and
3. Simulate total solids by specifving loads, boundary concentrations, and
initial conditions, settling, deposition, scour, and sedimentation velocities.
4. Simulate three sediment types as in Level 3.
primarily with the cohesive sediHeavy metals are associated
ments, or organic flocs. In general, cohesive sediments will not settle
if the velocity is greater than about 12 cm/sec, and resuspension
occurs when the velocity is greater than 20 cm/sec. Knowing the critical velocities and the velocities in the receiving water, it may be possible to simplify the sediment
dynamics
model.
Temperature
Many of the coefficients,
rate parameters,
DO saturation
concentration,
and unionized
portion
of ammonia
are temperaturedependent;
therefore,
temperature
must be predicted
for the
equation is
receiving water. The generalized
form of a temperature
as follows:
a
at
(A,aEi)
A axD
where
QH(
a(A,UJT)
A ax
pcH
T
= temperature
A
= cross-sectional
E
= dispersion
U
=
p
= density
area
coefficient
mean velocity
Please purchase PDF Split-Merge on www.verypdf.com to remove this watermark.
SOMECOMMONLY
USED ODELS
M
c = heat capacity
H = depth
OHN = rate of heat input
= net short wave + net long wave - outgoing
long wave back radiation flux ± conductive
flux - evaporation heat loss
This particular form of the temperature prediction may be simplified for a particular application. Statistical methods may determine some simple relationships between the air temperature and
water temperature in a receiving water. Another approach to simplify the modeling process is to use the maximum and minimum
recorded temperatures in the receiving water to determine the range
of values for the various coefficients. However, the complete temperature prediction equations are required for reservoirs or large
thermal discharges to the receiving water.
Oils, Grease, and PAHs
These substances are buoyant and do not mix well with the
receiving water; consequently, they remain on or near the water
surface, where they spread outward as a thin surface film. Special
models have been developed to predict the behavior of these surface films, which are referred to as oil slick models. Oil slick models are Lagrangian models that follow the path of the oil slick
dispersing and diluting the oil slick in the receiving water. Like
other water quality models, oil slick models require a velocity
vector field. The hydrodynamic equation (equation 1) includes
wind-generated currents (equation 4) and can be used to determine the surface current vectors, although these currents are
depth-averaged in the model formulation. If the hydrodynamic
predictions are not available, the surface current vectors can be
estimated from wind data (3 ± 2 percent wind speed at 7 ± 6
degree deflection) (Huang and Mlonastero, 1982; Venkatesh,
1990). In the receiving water, the processes operating on the oil
parcels are as follows:
* surface tension spreadingnormallyearly in the oil parcel release;
Please purchase PDF Split-Merge on www.verypdf.com to remove this watermark.
WATER
QUALITYMODELING
* dispersion - turbulence
* weathering
dissolution,
and physical spreading; and
- includes evaporation,
and biodegradation.
depth dispersion,
emulsification,
For periods of a few days, the slicks can be predicted
well
using only the time and spatial variable velocity field and dispersion data. The models consist of releasing
individual
parcels of
oil and tracking
the movement
of the parcel of oil through
the
velocity field as it is moved by the currents
and dispersion.
The
location of the parcel on the two-dimensional
grid is determined
at selected times after its release. Typically, 200 to 300 parcels of
oil are released
to obtain a representative
statistical
sample for
the oil slick. The oil patch is then represented
by a plot of the
individual
parcels.
Statistical
analysis of the parcels defines the
mean concentration
and variance
at different
times after release
and for different distances
from the start of the spill. The MIKE
programs
discussed
in the appendix
have an oil spill model.
Summary
Most mechanistic models consist of a hydrodynamic
part, a mass balance part, and a receiving water process part. The hydrodynamic
part
predicts water levels and currents. The hydrodynamic
equations must
be solved numerically, which requires that the user provide boundary
and initial conditions, bathymetry, time and/or spatial elements, wind
data, bottom friction, and wind surface drag.
Hydrodynamic
calibration
is a trial-and-error
procedure
that
may be tedious. The simplest form of the hydrodynamic
model is the
one-dimensional
steady-state
model (QUAL2).
In some instances,
this model can be used repeatedly to simulate different conditions at
different times, and can be applied along streamlines
in two- or
three-dimensional
flow fields.
The mass balance and process parts of the model use the outputs
from the hydrodynamics
part. The mass balance part transports
and
disperses substances
and balances the discharges,
input flows, and
outflows. Besides providing the point and non-point discharges and
other loadings as well as the initial conditions, the user must provide
Please purchase PDF Split-Merge on www.verypdf.com to remove this watermark.
SOMECOMMONLY
USED
MODELS
the dispersion coefficients and, for suspended solids, partitioning
coefficients. The dispersion coefficients for the model are normally
quantified in the calibration process. The receiving water process
parts can be complex, requiring many different coefficients, rate
parameters, and partitioning coefficients. Every effort should be
made to simplify these processes for a particular model application.
Discharged substances that are both buoyant and that do not mix
well with the receiving water (e.g., oils and PAHs) require a surface
spill type of model.
SELECTED
MODELS
In preceding text, the different processes were discussed to develop
an understanding of the independent variables in the model prediction equations. It is not necessary that all these processes be included
in a model for a particular application; nevertheless, the model user
should know what processes have been omitted in the model and the
rationale for not considering them. One of the reasons for omitting
processes may be the lack of site-specific data and the reluctance to
use literature or default values instead of the site-specific data. Or,
the user may want to develop a better understanding of the receiving water responses by using a simplified version of the model to predict water quality, then compare the model predictions from
different model formulations. For example, a user may use the same
model to predict receiving water quality for two different loadings
from an outfall or compare the receiving water quality predictions
for an outfall at two different locations.
In many instances, it may be more efficient to use more than one
model for a project or to combine parts of several models. If the
receiving water processes and discharges are very complex, it is
always easier for the user to understand the receiving water quality
kinetics if the models are simplified. Some of the models can be used
as a black box with little site-specific data inputs to the model (see
Appendix). Because the processes discussed above have many sitespecific user data input requirements, using the model as a black box
should be avoided if possible. If it is necessary to use a black box
model, it is important that the model user quantify the prediction
precision if the model is used comparatively and both precision and
Please purchase PDF Split-Merge on www.verypdf.com to remove this watermark.
U
WATER
QUALITYMODELING
accuracy if the model predictions are compared to receiving water
quality objectives.
Some specific models are discussed in the Appendix. These models may not necessarily be the best models for any particular application. They do include some of the models that have been used for
NVorldBank projects and some other well-used models that are readily available at no cost.
The VWor[d Pollutuin Preventi7nand Abatenien/Handbook, 1998 disBank
cusses four representative models: OUAL2E, WASP, CE-QUALRIVI, and HEC-50. In this section, the models C-OUALRIV1 and
HEC-50 are not discussed, although these models are similar to other
models that are discussed. As discussed previously, there is a generic
structure common to most of the models so that the individual models
can be viewed as different ways of packaging the three parts of the
model generally for a specific application. The Vllorld
Bank Pollutu71n
and
AhatenzentRandbivk,
1998 uses a table to show the model characteristics,
which includes the type of receiving water, time characteristics, and
water quality parameters predicted. This model classification system is
presented in Table 3.1 with some additions.
The models presented in the Appendix are either specialist models or general models. The general models can all be used as steadystate models or in one or two dimensions; therefore, these models can
be used for river or lake or ocean receiving waters. The general models are also designed so that parts of the model can be used in other
models; therefore, the user can create a hybrid model. Summaries of
the important features and limitations of each model are presented
here. As discussed previously, the water quality parameters of interest in this manual are temperature, turbidity, suspended solids, dissolved oxygen, nutrients (including ammonia), indicator bacteria,
oils, grease, PAHs, and heavy metals. The water quality parameters
that a model cannot predict are identified as a limitation in the model
description.
Ouffall Models - CORMIX (USEPA)
Most outfalls end in some kind of diffuser, which can be a single port
or multiport diffuser.Diffusers increase the local dilution (commonly
called the initial dilution) of the discharged effluent by jetting, buoying, and spreading the effluent; consequently, the diffusers reduce
Please purchase PDF Split-Merge on www.verypdf.com to remove this watermark.
Table 3.1 Properties of Some Models
Model
OUAL2EJManagement
UNCAS
Analy.sid
Receiving Water
X
Rivers
Reservoirs & lakes
Estuaries, coastal areas
Attributes
Dynamic
X
Stochastic
Stormwater flow
Sewer system
Water Quality
X
Dissolved oxygen
X
Nitrogens
X
Phosphoruses
X
Indicator bacteria
Suspended Solids
Heavy metals
X
Dissolved Substances
Acidity
X
Temperature
Oils, grease, PAHs
WASP4
HSPF
X
X
X
X
X
X
MIKE.XYFLOW3D:
CEXXPLUMTI-TRISULAQUALDELWAODIJVAST
3D
SWMIM WTQRRS W2
X
X
X
X
X
X
X
X
X
X
X
X
X
X
X
X
X
X
0
X
X
X
X
X
X
X
X
X
X
X
0
X
X
X
X
X
X
X
X
X
X
X
X
X
X
X
X
X
X
X
X
X
X
X
X
X
X
X
X
X
X
X
X
X
X
Please purchase PDF Split-Merge on www.verypdf.com to remove this watermark.
0
z
X
X
0
O
fl
WATER
QUALITY
MODELING
the effect of the effluent on the receiving water. The diffuser design
is important in any outfall (World Health, 1988) and the options
available for the diffuser design are numerous. For example, a welldesigned multiport diffuser located in water depths of 50 m can easily achieve initial dilutions of 80:1 and will be equally effective as a
secondary treatment for biodegradable components in the wastewater in terms of receiving water concentrations.
Initial dilution is not normally included in the water quality prediction models; therefore, the initial dilution for an outfall must be
predicted using models, then the prediction used as an input for the
water quality models. The initial dilution is affected by the jetting
velocity, direction of jets, depth of the diffuser, port diameter, number of ports and port spacing, buoyancy of the effluent, receiving
water velocities (speed and direction), and stratification. Initial dilution is a complex hvdrodynamic process. There are many discussions
on the initial dilution hydrodynamics in the technical literature; one
of the most useful is by Muellenhoff et at. (1985).
The U.S. Environmental Protection Agency (USEPA) has developed expert system models for the multiport diffuser outfalls, called
CORMIX (1990 & 1993). These are available at no cost, and the
user manual is particularly good in showing graphically the effects of
the different variables on the initial dilution. Some model users have
found that the diffuser models overpredict the initial dilution by a
significant amount when the model predictions are compared to
tracer studies (Sharp & Moore, 1987 & 1989). Users of the diffuser
models may want to reduce the CORMIX model predictions by a
factor of two to be conservative, or carry out site-specific tracer studies to quantify the initial dilution predictions of the models. It is
advisable that some site-specific tracer study data be collected for
any initial dilution prediction model, because initial dilution is so
important in determining receiving water quality concentrations. In
some instances, an existing outfall in the area can be used for the
tracer studies. The data from the tracer studies can then be compared to the model predictions to determine whether a factor should
be used for the model predictions. For most outfalls, and particularly
for the ocean and lake outfalls, the initial dilution varies over a wide
range, and it is important that the outfall prediction models be used
to define this range. For some receiving water quality parameters
like CBOD or indicator bacteria, mean dilutions are required,
Please purchase PDF Split-Merge on www.verypdf.com to remove this watermark.
SOMECOMMONLY
USED ODELS
M
whereas other parameters like ammonia, chlorine, and metals
require minimum dilutions. The initial dilution predictions have to
be consistent with the objectives for the water quality parameter
being modeled.
QUAL2Eand QUAL2E-UNCAS(USEPA)
This one-dimensional model, designed for rivers, is a steady-state
model (assumes instantaneous equilibrium). A good user's manual
explains the theoretical background of the model and provides all the
information necessary to run the model. The DO and nutrient kinetics in the model are complete and have been used directly in other
models. The UNCAS portion of the model allows uncertainty in the
input data to be incorporated directly in the model predictions. It is
one of the few models that includes uncertainty in the water quality
predictions and has frequently been used to identify the most important input data for the prediction and the level of precision required
in these measurements. The model has been used for time-varying
discharges by carrying out separate runs for a range of discharge
conditions or by incorporating the variability of the discharge as an
uncertainty factor in the UNCAS model. The model can be used in
two-dimensional flow situations, but must be applied along the
streamlines. The model temperature prediction is based on heat
fluxes and is useful.
The model does not predict heavy metals, oils, grease, or PAHs.
While the model can predict indicator bacteria, these predictions
may not be very accurate if many of the bacterial cells are associated
with organic flocs. QUAL2 does not have sub-routines for the suspended sediment dynamics; consequently, if the suspended solids
concentrations are high in the receiving water, QUAL2 will have difficulty predicting some water quality parameters.
WASP4(USEPA)
WASP was designed as a comprehensive receiving water quality
model that can be used for all types of receiving waters (rivers,
lakes, marine). It is a flexible model that allows users to develop
their own numerical segment system and use various parts of the
model. The hydrodynamics in this model are one-dimensional and
Please purchase PDF Split-Merge on www.verypdf.com to remove this watermark.
WATER
QUALITYMODELING
time-varying; therefore, the direction of the currents must be
known. The model cannot generate a two- or three-dimensional
flow field, and its use is limited if the flow field is characterized by
localized eddies. In other words, the model will have difficulty when
applied to a receiving water with unusual topography and bathymetry, e.g., receiving waters characterized by embayments, offshore
shoals and reefs, breakwaters, or headlands. The user can use
another hydrodynamic model to generate the circulation pattern,
then feed the output from this model into the water quality parts of
WAS P.
Predicting the DO, nutrient, sediment, and heavy metal kinetics
is one of the great strengths of the model. The receiving water
processes in the water quality parameter kinetics have been developed thoroughly in the model. (The model can also be used to predict the receiving water processes for organic substances like
pesticides.) The receiving water kinetics is discussed in detail in the
user's manual.
WASP is limited in its hydrodynamic capabilities, the large input
data requirements to use the model, and the difficulty of quantiflying
the precision and accuracy of the model, which is a common problem with all complex models. Setting up the model, calibrating the
model, and applying the model require extensive time for technical
staff.
SWMM (USEPA),HSPF(USEPA,
and MIKE 1 (Danish
Hydraulic Institute)
These models all predict storm wvater runoff and water quality in
rivers. Unlike QUAL2, these models are dynamic and predict river
flow. SWMM is a sophisticated model for urban areas with a storm
water sewer system capability. HSPF and MIKE I are similar models for rural areas and do not include sewer networks. For water
quality, the SWMNiMmodel uses the WASP model for the water quality predictions, while the other models predict water quality using
similar equations. These models can include the impact of point discharges other than storm wvater. Although the SWMM and HSPF
models are sophisticated, they can be used as black box models with
very limited input data. This may be a useful feature for predicting
storm water runoff quantity and quality.
Please purchase PDF Split-Merge on www.verypdf.com to remove this watermark.
SOMECOMMONLY
USED
MODELS
Except for SWMM, which uses the water quality capabilities of
WASP, the models do not consider the receiving water processes in
an integrated manner. The water quality aspects of the models are
primarily transport, dispersion, and first-order kinetics. The models
are particularly limited in the dynamics of suspended solids in terms
of associated bacterial and heavy metal contaminants.
WQRRS(U.S. Army Corps of Engineers)
This is a hybrid model that meshes a river model and a reservoir
(lake, estuary) model. WASP has the same capability but is deficient
in the reservoir hydrodynamics.
CE-QUAL-W2 (U.S. Army Corps of Engineers)
This is a dynamic, two-dimensional version of QUAL2 specifically
formulated for reservoirs, lakes, or narrow estuaries. The two dimensions are downstream and depth. This model considers all the complex
processes with depth in a deep reservoir that has density stratification.
MIKE XX, TIDEFLOW-3D,XXFLOW-3D, and XXPLUM-3D
(Danish Hydraulic Institute)
These models can be dynamically used in one, two, or three dimensions or as a Lagrangian spill-type model. The modeling system
dynamically predicts water elevations and currents as well as the
suspended solids dynamics, interactive water quality parameters
that are similar to the processes in WASP. Wave-generated
processes are not included explicitly in the model, but their mean
impact can be simulated by adjusting the surface drag coefficients.
This is one of the few models that addresses implications of wave
dynamics in coastal water quality. These models satisfy all the
water quality and receiving water requirements in this guide. It is
not known whether model precision is available for the modeling
system, or whether some of the models can be run in a stochastic
manner, other than the XXPLUM-3D
models, which are random
walk models.
Like all complex models, the model setup is labor-intensive, as is
the calibration process, which requires large data sets. Because the
Please purchase PDF Split-Merge on www.verypdf.com to remove this watermark.
U
C
WATER
QUAULITY
MODELING
system consists of sub-models
for the various components,
the individual components
can be set up and calibrated independently
from
the other sub-models. This makes it easier for the user to understand
and calibrate the model.
TRISULA DELWAQ(Delft Hydraulics)
&
residual (tidal and windThese models predict the two-dimensional
averaged)
currents and suspended
solids dynamics and all the water
quality parameters
of interest except for oils, grease, and PAHs as
surface plumes. The water quality processes in the model are similar in structure
to those of WASP, and the sediment dynamics
in
DELWAO are more extensive than in WASP. The primary productivity model predicts diatom and green algal bio-masses.
Predicting
and using the residual currents
simplifies the calibration
process
and is adequate for predicting
algal bio-mass but not dissolved oxygen, ammonia, indicator bacteria, and metal concentrations,
which
have instantaneous
concentration
objectives or geometric averages
over a number of samples. It is not known whether the models can
be run in a stochastic manner or whether the models compute the
prediction
precision, and it may be necessary for the user to evolve
a method for quantifying
prediction
precision.
of
These models can predict all the water quality parameters
interest except for the oils, greases, and PAHs as surface slicks. The
setup and calibration
of complex models require extensive technical
staff time as well as calibration data. Predicting and using the residual currents simplify the calibration
process and are adequate for
predicting
algal bio-mass but not dissolved oxygen, ammonia, indicator bacteria, or metal concentrations
which have instantaneous
of
or geometric averages
over a number
concentration
objectives
samples.
DIVAST(Binnie & Partners)
This model predicts the dynamic two-dimensional
currents,
water
elevations,
and transport
of a dissolved substance.
The dissolved
substance transport
process includes first-order
time kinetics. Continuously
recorded
currents,
winds, and water levels can be fed
directly into the model.
Please purchase PDF Split-Merge on www.verypdf.com to remove this watermark.
SOME COMMONLY USED
MODELS
The model does not predict dissolved oxygen, nutrients, suspended sediments, heavy metals, temperature, oils and grease, or
PAHs.
MODELDATA
REQUIREMENTS PREDICTION
AND
ISSUES
A list of the site-specific data requirements for all prediction models
is presented. Because many projects lack some of the data requirements on the list, water quality prediction models can still be applied.
The modeling strategies for limited site-specific data, suspect sitespecific data, and non-point source loadings are discussed. The sitespecific data required for a model application are discussed. Then
the use of spill models is discussed.
To develop and use a water resource requires that the development be carried out in a manner that sustains the water resource for
a diversity wateruses.Waterresourcesmanagement
of
requiresthe
development waterresources
of
projectsand/ormanagement
procedures to preserveand enhancewater quality.Waterqualityprediction is the only way that differentwater resourcesmanagement
projectscan be evaluated termsof the waterqualityaspects;conin
sequently,
water qualitymodelingis a fundamental of all
part
environmental
assessments.
Waterqualitymodels designed that theycanbe customized
are
so
to a particularapplication
usingsomesite-specific
data. In general,
thesesite-specific includephysicaland waterqualitymeasuredata
mentsas wellas somecoefficients rate constantdeterminations.
and
Ideally,the user is requiredto providesite-specific on the foldata
lowing:
1. Physical
measurementsbathymetry topography cross-secof
and
(flow
tions).
2. Boundary
conditions
(velocity,
depth, andconcentrations).
flow,
3. Initial
conditions
(depth,
velocity, concentrations).
and
4. Discharges(location,flow,and concentration).
5. Othercoefficients rateparameters,
and
depending thewater
on
quality
Please purchase PDF Split-Merge on www.verypdf.com to remove this watermark.
fl
WATER
QUALITY
MODELING
parameter being modeled.
6. Wind and rainfall (some models).
7. One set of measured data for calibration.
8. One set of measured data for verification.
model
If the site-specific data above are available, the calibrated
can be expected to have a precision a little larger than the
predictions
sum of the precision of the measurements
and measurement
combiis defined by the quality
nations. The precision of the measurements
assurance and control program.
In many water resources projects, all the site-specific
measurements required are not available and some of the available data may
be questionable.
What are the guidelines
for using water quality
models in these instances?
Limited Site-Specific Data
When there are limited site-specific
data, complete comprehensive
complex models should not in general be used for predictions
except
for developing an understanding
of the water quality processes in a
particular
receiving water or for developing
a water quality monisite-specific
data requirements
for
toring program. The extensive
comprehensive
complex models would render any determination
of
the precision of prediction meaningless based on the use of literature
values. Simpler models or simplified comprehensive
models should
be used. The following discussion is intended to assist in identifying
the appropriate
model simplifications
or the preferred
model for a
particular
application.
In this process, the difficulty in measuring
some of the site-specific data discussed previously is considered.
Some site-specific
measurements
are necessary for any model
application.
The basic requirements
are 1, 2, and 4 above. Crosssectional data are required at the upstream and downstream
boundary locations and at a minimum of three locations in between. These
measurements
should be for a common flow and/or water depth conditions. If not, these measurements
should be adjusted to the same
flow conditions using standard hydraulic techniques. Water depths,
flow, and concentration
data must be available at the upstream and
downstream
boundaries
and at some intermediate
cross-sections.
Please purchase PDF Split-Merge on www.verypdf.com to remove this watermark.
SOMECOMMONLY
USED
MODELS
Again, these measurements should be for the same conditions of flow
and/or water depth as the cross-sectional data and if photosynthesis
and respiration are factors at the same time of day.
To determine if photosynthesis and respiration are factors, dissolved oxygen and temperature (and salinity for marine waters)
measurements should be made over a 30-hour period during the
aquatic plant growth season. If this is not possible, measure DO and
temperature at several locations early in the morning and at mid-day.
If the percentage change in DO percentage saturation in these measurements is significant, photosynthesis and respiration are factors in
the DO, and nutrient kinetics in the receiving water must be considered.
The location, flow, and concentrations in the discharges must be
known or estimated. The water quality parameters of interest will be
identified in the preliminary water quality measurements or other
data. Select the simplest appropriate model from Table 2.2 (remember that dynamic models can be run as steady-state models). lMost
models have default options and/or provide a range of values for bottom roughness, eddy diffusivity, dispersion coefficients, and the
other required model coefficients and rate parameters. Because a
calibration data set is not available, it is not possible to determine the
values of the coefficients and rate constants required to apply the
model. These values will have to be selected from values provided in
the manual or some other source. To estimate the impact of this
selection on the predictions, it will be necessary to use the model several times with different values for the coefficients (sensitivity analysis). It is suggested that the model be used with the coefficients/rate
parameters in the range of (mean + (0.17 x range)) to quantify the
precision of the predictions. The model in this form may be very useful in providing guidance for designing an appropriate monitoring
program for the model.
If a partial site-specific data set is available, the missing data can
be selected from the range of values in a manner similar to that discussed above.
Another approach is to use a stochastic type model. In these
models, the range or mean value and distribution (normal, lognormal, etc.) of the user input data can be provided, and the models can
be used stochastically. The predictions from these models will
include mean value, range, and distribution; consequently, the preci-
Please purchase PDF Split-Merge on www.verypdf.com to remove this watermark.
c


![3000 commonly used english words [tvn center]](https://media.store123doc.com/images/document/2014_06/26/medium_pmq1403751021.jpg)