Genome analysis
Bạn đang xem bản rút gọn của tài liệu. Xem và tải ngay bản đầy đủ của tài liệu tại đây (469.22 KB, 36 trang )
Genome analysis
11.1 Introduction
Genome sequencing projects, whether bacterial, yeast, nematode, plant or
human, have become an everyday part of scientific life. Scientific journals
and even the science section in national newspapers regularly refer to
genome sequencing projects and their potential benefits. In medicine, for
example, there is development of rapid diagnostic tests and therapies for
disease treatment and prevention, including those based on gene therapies.
Furthermore, diseases caused by bacterial pathogens are likely to be an area
in which genomic research will have a great impact on new drug develop-
ment. Prospects for enhancing food production, through more rapid
molecular breeding of crop plants and animals, are also highlighted as areas
of potential benefit from genome research.
The first genome to be sequenced was the 5386 bp of bacteriophage
φX174 (1) and in 1995 the first bacterial genome of Haemophilus influenzae
(2) was sequenced. Almost 60 microbial genomes have now been
completely sequenced, along with more than 100 which are still in
progress, and there is intense research to identify essential genes that may
be targeted for development of new antibiotics.
The first eukaryotic genome sequence was of the yeast Saccharomyces
cerevisiae that has some 6 000 genes (3,4). Global transcript analyses to
investigate changes in patterns of gene expression when yeast cultures are
grown under different conditions are now possible. This became possible
through the use of microarrays or oligonucleotide chips representing
unique sequences of each of the yeast genes. When such microarrays (5) or
oligonucleotide chips (6; Affymetrix.com) are hybridized with fluorescently
labeled mRNA isolated from two different cultures it is possible to detect
by fluorescence which transcripts are present at increased or decreased
levels between the two samples. This provides a picture of exactly which
genes are affected by the culture conditions. DNA chip technology includ-
ing both oligonucleotide chips and DNA microarrays will be important in
measuring concerted changes in gene expression in many organisms,
tissues and cells.
The first multicellular eukaryotic genome sequence was completed for
the nematode Caenorhabditis elegans in 1998 and the even more complex
Drosophila melanogaster sequence was completed in 2000. The information
from these genomes offers many advantages for scientific study, particu-
larly as they share many common developmental features with higher
eukaryotes including humans. It is possible to access the entire C. elegans
genome through over 3000 publicly available clones and oligonucleotide
primers for over 19 000 C. elegans genes can be purchased that yield
fragments of around 1.3 kbp for use in microarray and other applications
(Research Genetics). The first plant genome sequencing project, of
11
Arabidopsis thaliana, was completed at the end of 2000, providing new
insights into plant gene functionality and providing a basis for comparative
genomics with crop plants. Many important crop plants, representing the
most central staple foods of mankind, are also being sequenced, with the
rice genome completed in 2001 whilst the wheat and maize genome are
still in progress. A major landmark in biology came in 2003 when the
sequence of the human genome was completed after 13 years.
The molecular mapping of genes and genetic traits and the diagnosis of
medical conditions that derive from inheritance and/or spontaneous
changes in the genetic material will continue to represent a major appli-
cation for PCR. It is not possible to describe every PCR-based technique
used in genome mapping so we will focus on the most common and well-
established techniques, including methods for analysis of mutations, for
example in medical diagnosis, and fingerprinting approaches for com-
parative analysis of individual organisms in forensic applications and to
provide molecular markers for gene cloning and agricultural breeding
strategies.
11.2 Why map genomes?
The best way to understand protein functionality in any biological system
is to examine the phenotypic trait caused by a ‘gain-of-function’ or ‘loss-
of-function’ mutation to address the question ‘what is the biological effect
of altering the expression of one or several genes?’ Mutations, poly-
morphisms, and sequence variants (MPSV) have a causal involvement in
almost all diseases with genetic components and advances in genome
mapping as part of disease diagnosis is therefore extremely important. The
mapping of genomes serves several purposes:
● by using the expanding number of genome-specific markers, genetic
traits can be more accurately followed through generations;
● genes that cause a genetic defect can be mapped and cloned;
● the mapping of genes allows the design of rapid diagnostic screens for
genetic disease traits as well as more informative genetic counseling.
While DNA sequencing provides the highest-resolution genetic analysis
data it remains relatively expensive and time-consuming, particularly for
the investigation of several markers. In order to generate the DNA for
sequencing it is necessary first to amplify the corresponding segments of
genomic DNA by PCR. However, the resolution and sensitivity of PCR
mean that this technique alone can be sufficient to answer the mapping
or diagnostic question without the need for detailed sequence analysis.
PCR-based medical diagnosis is very sensitive for mutational detection as
it is able to detect abnormal transcripts from one cell in every 10
6
cells.
There are many PCR-based mutation detection methods that can distin-
guish between the presence and absence of alleles of a target gene. As a
simple illustration, consider a known genetic locus that gives rise to disease
when a small part of the locus has been deleted from both copies of the
gene in the genome. The most rapid and reliable approach to analyze this
locus is a simple PCR assay using primers spanning the unstable region.
When this region of DNA is amplified from an individual it would
258 PCR
immediately be informative of the presence or absence of a deletion in one
or both copies of the gene (Figure 11.1). Thus, if parents were concerned
about the possibility that they may have an affected child they could be
tested and counseled about the probabilities associated with conceiving an
affected child. Often genetic analysis is much more complex, with many
potential lesions, predominantly point mutations, existing in a gene.
Nonetheless this example illustrates why PCR is used extensively in genome
analysis programs. It is also possible to analyze multiple regions of a target
gene, or multiple genes, by multiplex PCR in which several different primer
pairs amplify different target regions simultaneously in a single PCR tube.
Provided the products differ in size, or are differentially labeled, they can
be distinguished by subsequent analysis to reveal polymorphisms
associated with absence or change in size of a product.
It is equally important to understand what features may limit the utility
of PCR in genome analysis and medical diagnostics. First, PCR relies on the
availability of good genetic markers within the genome that act as inform-
ative ‘landmarks’. One potential problem is that different markers ‘present
themselves’ at different stages of the disease, sometimes preventing early
disease detection. For example mutations in the ras oncogene occur at an
early stage during tumorigenesis, whilst mutations in the p53 tumor
suppressor gene usually occur in invasive tumors. A second limitation can
be the lack of mutational hot-spots in the affected gene, which limits the
use of PCR for detection of molecular alterations as part of disease progres-
sion and requires the use of DNA sequencing to identify sequence changes.
For example, mutations in the APC gene, which occur in more than 70%
of colon adenomas, show a totally random distribution in this 8.5 kbp
transcript. Third, although PCR-based medical diagnosis is designed to
increase sensitivity of mutational detection, occasionally such analysis may
identify changes in single cells or in cell clusters that are not yet clonal or
will never progress into cancer.
11.3 Single-strand conformation polymorphism analysis
(SSCP)
The nucleotide sequence of the genome of different individuals of the same
species is not identical. Nucleotide substitutions in the human genome
Genome analysis 259
AB C
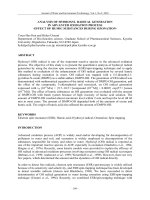
Figure 11.1
PCR-based analysis of a genetic locus carrying a small deletion allows one to
distinguish between a wild-type homozygote (A); a deletion-carrying homozygote
(B); or a heterozygote carrying one wild-type and one deleted copy of the gene
(C).
have been estimated to occur every few hundred base pairs. The traditional
way to analyze these polymorphisms was by restriction fragment length
polymorphism (RFLP) analysis. RFLP analysis has been used very success-
fully to create a genetic linkage map of the human genome (7) and has
given insight into the chromosomal locations of genetic elements that
cause hereditary diseases. While RFLP analysis is useful when distinguish-
ing two alleles at a specific chromosomal locus, it has some disadvantages.
First, RFLPs can only be detected if the polymorphisms are present within
the recognition site of a restriction endonuclease or where deletions or
insertions are present in the region detected by the locus-specific probe.
Second, it relies upon restriction of total genomic DNA, Southern blotting
and detection of the polymorphism by hybridization with a radiolabelled
probe, followed by autoradiography. These methods are time-consuming
and expensive.
To make polymorphism detection more efficient, Maniatis and coworkers
showed that denaturing polyacrylamide gels can resolve single base-pair
substitutions from total genomic DNA due to mobility shifts caused by
conformational changes of single-stranded fragments (8). It was subse-
quently shown that nucleotide sequence polymorphisms can be detected by
analysis of mobility shifts of single-stranded DNA caused by single base-pair
substitutions (9), known as single-strand conformation polymorphism
(SSCP) analysis. With the increased demand for high-throughput mutation
analysis, PCR was quickly incorporated as a tool for generating fragments of
suitable size for SSCP analysis. The following Sections describe how PCR has
simplified SSCP analysis allowing rapid detection of unknown mutations,
polymorphisms and sequence variants.
The principle
PCR-SSCP analysis is based on two steps. First, the DNA sequence of
interest is PCR-amplified and second, the amplified DNA is heat-denatured
and size-fractionated by native polyacrylamide gel electrophoresis (native
PAGE). After heat denaturation the mobility of single-stranded DNA
fragments is size- and sequence-dependent, with single-stranded DNA
molecules adopting secondary structure conformations by intramolecular
base pairing (Figure 11.2). For a given double-stranded fragment there will
be two bands identified following SSCP, one corresponding to each of the
two original DNA strands. If two fragments differ by as little as a single
base pair, the denatured strands are likely to adopt different conforma-
tions and therefore to be distinguishable following native PAGE. The
difference is identified by a shift in mobility of one or both of the mutant
bands relative to the wild-type control strands (Figure 11.2). [α
32
P]
nucleotides are often incorporated into the products during the PCR to
label the DNA for PCR-SSCP analysis. Alternatively, a sensitive dye, such as
SYBR® Green II (Chapter 9) could be used for ‘cold’ PCR-SSCP analysis.
The migration of single-stranded DNA and the conformational changes are
influenced by the percentage of acrylamide, the electrophoresis tempera-
ture and the ionic strength of the electrophoresis buffer (see below) and it
is recommended that appropriately reproducible conditions are deter-
mined for a given fragment.
260 PCR
The PCR reaction
One advantage of PCR-SSCP is the small quantity of template DNA needed
compared with traditional SSCP analysis. Routinely only 5–10 ng of DNA
is required for each reaction, compared with SSCP analysis which normally
requires between 5 and 10 µg of DNA. An example illustrating this point is
the PCR-SSCP based approach to fingerprint sequence variations in ribo-
somal DNA of ascaridoid nematodes (10). In this example nematode eggs
were collected from the uteri of gravid females by dissection and the
isolated genomic DNA was sufficient to perform PCR amplification for
PCR-SSCP analysis. Two primers were designed to regions of the 5.8S and
the 28S rRNA genes of C. elegans and labeled with [γ
33
P]ATP. Following
PCR it is advisable to check a small aliquot of the reaction products (1/25)
on a standard 2.5% agarose gel to ensure that the amplification reaction
was successful. As discussed below, a dilution series of the amplification
reaction should be diluted in SSCP loading buffer (10 mM NaOH, 95%
formamide, 0.05% bromophenol blue and 0.05% xylene blue) and
denatured at 95°C for 5 min, followed by snap-cooling before being
subjected to native PAGE.
Genome analysis 261
Sense strand
wild-type conformation
Antisense strand
wild-type conformation
Sense strand
mutant conformation
Antisense strand
mutant conformation
1234
Native PAGE
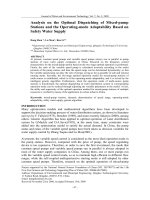
Figure 11.2
Principle of SSCP analysis showing that single base-pair mutation leads to changes
in intramolecular conformation of single-stranded DNA fragments which
ultimately leads to different electrophoretic mobilities when separated by native
PAGE. Mutants are labeled with a solid circle.
Factors affecting the quality of single-stranded DNA mobility
A number of parameters affect the quality and reproducibility of PCR-SSCP
analysis. Temperature influences the conformation of single-stranded DNA
and should therefore be kept constant. Very often SSCP analysis is
performed by running gels at room temperature at low power (~ 10 W).
This is acceptable if the room has temperature control such as air condition-
ing. If not it is better that a constant electrophoresis temperature be
maintained by running the nondenaturing gel in the cold room (4°C) at
40–50 W.
A second important factor is the percentage of acrylamide and the degree
of cross-linking by bis-acrylamide. Reduced cross-linker concentrations may
improve the fragment separation quality. However, this is not always the
case and must be tested for the individual fragments. Adding additives to
the gel matrix may also have a positive effect on the overall separation
quality. For example, addition of 2.5–10% glycerol increases purine-rich
fragment mobility compared with pyrimidine-rich strands due to polar-OH
group interactions or new intermolecular hydrogen bond formation. This
phenomenon is not limited to glycerol but is also seen when sucrose,
glucose, formamide and dimethyl sulfoxide are used. It has been proposed
that glycerol makes the folded structure of single-stranded DNA more
relaxed, acting like a weak denaturing agent. Again optimal glycerol
concentrations, to achieve the best separation quality, must be determined
empirically.
The ionic strength can affect the resolution quality of the gel. In some
cases it is advantageous to decrease the ionic strength of the electrophoresis
buffer to 0.5 × TBE (1 l 5 × stock solution: 54 g Tris base, 27.5 g boric acid,
20 ml 0.5M EDTA pH 8.0), although this also lowers the buffering capacity.
Another option is to lower the ionic strength of the stacking gel, which will
increase the sharpness of the banding pattern.
In some cases single strands anneal to form duplex DNA prior to or
during electrophoretic separation and this can affect polymorphism
detection. This is more likely to occur if several fragments are analyzed in
one lane. To overcome this potential problem the PCR samples should be
diluted and the extent of dilution will depend on the amount of PCR
product. However, a good starting point is to make dilutions of 1:200, 1:50,
1:10 and 1:2. Overloading the gel increases the possibility of abnormalities
in migration patterns.
Traditionally when performing a problematic PCR an increase in primer
concentration may be advantageous, but in PCR-SSCP this is not the case.
By increasing the primer concentration a dose-dependent decrease in SSCP
resolution is often observed due to primer–fragment reannealing. This
problem can be overcome by purifying the PCR products from the primers
(Chapter 6) prior to electrophoretic separation.
Fragment size for detection of polymorphisms
Using PCR-SSCP for the analysis of mutations in large fragments is difficult.
The best results are achieved using fragments around 150 base pairs in length
and fragments longer than 200 bp should not be used. If the use of larger
262 PCR
fragments cannot be avoided, it is possible to increase the chance of detect-
ing polymorphisms by performing a restriction endonuclease digestion on
the fragment, which should allow the simultaneous analysis of the result-
ing smaller fragments (Figure 11.3).
Genome analysis 263
PCR
product
Sau3A digestion
Sau3A Sau3A Sau3A Sau3A
Figure 11.3
Restriction endonuclease digestion of PCR-generated DNA fragment for use in
SSCP analysis. A four-base recognition site enzyme, such as Sau3A, which will
restrict the DNA on average every 256 bp, should be used.
11.4 Denaturing-high-performance liquid chromatography
(DHPLC)
The high-throughput discovery and analysis of single nucleotide poly-
morphisms (SNPs) relies heavily on automated techniques and ideally only
requires simple PCR amplification from samples. DHPLC represents such a
technique allowing the automated detection of single base pair substitu-
tions and small insertions or deletions. The technique is based on the fact
that under partial denaturing conditions DNA heteroduplexes, represent-
ing DNA with different sequences, formed after mixing, denaturation and
reannealing, will be retained less than the corresponding homoduplex on
a DNA separation matrix. The stationary phase, commercially available
from Transgenomic Inc. as DNASep™, is made of 2–3 µM alkylated non-
porous poly(styrene-divinylbenzene) particles, which allow separation of
nucleic acids by means of ion-paired reverse-phased liquid chromato-
graphy. By using a hydro-organic eluent containing an amphiphilic ion
such as triethylammonium ion and a hydrophilic counter-ion such as
acetate, the separation of DNA fragments is achieved. The retention itself
is governed by electrostatic interactions between the positive surface
potential formed by the triethylammonium ions (or similar amphiphilic
ions) at the stationary phase and the negative surface potential generated
by the dissociated and exposed phosphodiester groups of the DNA. Because
of this, double-stranded DNA is retained according to the length (11).
Retained double-stranded DNA is then eluted using an increase in concen-
tration of an organic solvent such as acetonitrile. DHPLC has been used
successfully for microsatellite analysis (Section 11.13), human identifica-
tion and parentage testing, detection of loss of heterozygosity in tumors,
DNA methylation analysis and quantification of gene expression (11).
Although DHPLC represents a high-throughput and sensitive method that
does not require special reagents or post-PCR treatment, it does require DNA
samples at the same quality as for DNA sequencing. However, by carefully
designing your PCR (Chapter 4) this should not present a problem. For
further information on DHPLC see www.transgenomic.com and for a
detailed review of DHPLC and its uses we recommend an article by Xiao and
Oefner (11) or the website />11.5 Ligase chain reaction (LCR)
Successful detection of single base pair allelic differences is often required
in genetic disease detection or forensic DNA analysis. The ligase chain
reaction (LCR) allows detection of single base pair substitutions with high
specificity and reliability. LCR is not really a PCR method since there is no
involvement of a polymerase; rather amplification of the product relies
upon the action of a ligase, ideally a thermostable ligase, to join the ends
of two adjacent primers. The underlying principle of LCR is the ability of
DNA ligase to ligate two adjacent oligonucleotides only if the junction
between the two is perfectly base-paired to the target DNA (Figure 11.4).
This means that a single base-pair substitution at the ligatable end of either
primer would prevent ligase forming a covalent linkage.
For increased specificity, the oligonucleotides should be of a sufficient
length (>20 nt) to allow hybridization to the unique genomic target region
and the ligation reaction should be performed near to the melting
temperature (T
m
) of the two oligonucleotides. The use of a thermostable
DNA ligase allows multiple cycles of LCR to be performed, allowing a linear
accumulation of ligated product. The amount of product may be further
increased by using both strands of genomic DNA as targets together with
two sets of adjacent oligonucleotides complementary to each strand. This
in effect means that the product can be increased exponentially by repeated
thermal cycling. Target-independent ligations are minimized either by
addition of salmon sperm DNA or by using oligonucleotide primers that
create single 3′-overhangs.
In contrast to PCR the LCR requires high-quality genomic DNA. The
oligonucleotides should be radiolabelled at the 5′-end and used directly in
the subsequent LCR; 40 fmol of radiolabelled primers should be added to
the genomic DNA followed by addition of thermostable DNA ligase. The
reactions should then be incubated at 94°C for 1 min followed by 65°C for
4 min for 20–30 cycles.
The specificity of T. aquaticus DNA ligase is very high, showing efficient
ligation when correctly base-paired oligonucleotides are used, with near to
zero ligation in the presence of a single mismatch. However, some
‘incorrect’ ligation events (less than 1%) do occur, which can be overcome
by reducing the input DNA amount (12).
11.6 Amplification refractory mutation system (ARMS)
The basic principle of the ARMS assay is similar to that of the LCR assay
(Section 11.5), which relies on the discrimination of the 3′-nucleotide of
primers for different alleles. ARMS is also known as allele-specific PCR (ASP),
PCR amplification of specific alleles (PASA) or allele-specific amplification
(ASA). In an ARMS assay (Figure 11.5) two PCR reactions are set up using
the same template DNA, one common primer but with different allele-
specific primers (13). In one reaction a primer is used that will amplify from
264 PCR
Genome analysis 265
*
*
*
*
*
*
(A)
PRODUCT NO PRODUCT
Anneal
oligonucleotidesWild-type
Point
mutation
Ligate
oligonucleotides
Ye s N o
Cycle 30 times
Ligase
(B)
Wild-type – ligatable oligonucleotides
Mutant – non-ligatable oligonucleotides
Oligo 1 Oligo 2 5' 3'
5' 3'
CAGGCATGATCGACCATGATTTTACGTTCATGTACC
AGGGTCCGTACTAGCTGGTACTAAAATGCAAGTACATGGCCCCTT
3' 5'
5' 3'
5' 3'
CAGGCATGATCGACCATGATTTTACGTTCATGTACC
AGGGTCCGTACTAGCTGGCACTAAAATGCAAGTACATGGCCCCTT
3' 5'
Oligo 1 Oligo 2
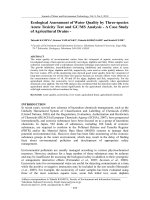
Figure 11.4
Principle of the LCR. (A) Annealing of complementary oligonucleotides to the target DNA occurs at a
temperature close to the melting temperature of the resulting duplexes. This allows ligation of
perfectly annealed oligonucleotides, but not those in which the upstream oligonucleotide has a 3′-
mismatch. Repeated cycles allows exponential accumulation of ligated product. (B) Examples of
primers for LCR showing annealing of two complementary primers to a wild-type template yielding a
substrate for ligase (✔) and to a mutant template with a single nucleotide mismatch to the 3′-end of
the upstream oligonucleotide thus preventing (✘) ligation.
✔
✘
one allele while in the second, parallel reaction a primer is used that will
amplify from the other allele. These primers are specific for only one allele
because their 3′-nucleotides are different and correspond to a position of
nucleotide variation between the alleles. It is critical that Taq or a similar
DNA polymerase that does not possess 3′→5′ proofreading activity is used
in PCR (Chapter 3). A proofreading enzyme would correct the mismatched
3′-position on the primer, destroying the discrimination of the assay. In
266 PCR
(A) Homozygote for allele 1
Allele 1
AP1 CP
Product
No product
(B) Heterozygote
AP2
(C) Homozygote for allele 2
(D)
Allele 1
CP
Allele 1
Allele 2
AP1 CP
Product
Product
AP2 CP
AP1 CP
Product
Product
AP2 CP
Allele 2
Allele 2
AP1 AP2
B
AP1 AP2
A
AP1 AP2
C
Figure 11.5
ARMS assay for discriminating between alleles. Two allele-specific primers (AP1
and AP2) are designed so that their 3′-ends are able to anneal to regions that
differ between the two alleles. In combination with a common primer (CP) these
allele-specific primers can amplify a product only if the allele to which they can
anneal is present. Thus in (A), for an allele 1 homozygote, only AP1 can amplify
the product. The absence of allele 2 prevents AP2 from functioning. In (B), a
heterozygote in which both alleles are present, both reactions will yield a product;
while in (C), only AP2 can generate a product. (D) shows a schematic gel
indicating the pattern of products expected from these different genotypes.
addition the enzyme should not be able to initiate DNA synthesis from a
mismatch site so that there is essentially no amplification and therefore no
product. This should contrast with efficient amplification and a clear
product when the primer is perfectly matched. The products can then be
analyzed simply by agarose gel electrophoresis (Chapter 5). Since an
expected outcome of the analysis of some DNA samples is the absence of
a product, it is important to ensure that the PCR is working efficiently and
the simplest way of ensuring this is to co-amplify a different genomic region
using control primers.
Primers for an ARMS assay are designed from genomic DNA sequence
and should ideally be around 30 nucleotides in length. Discrimination may
be enhanced by introducing further mismatches close to the 3′-end of the
primer, although if these are not carefully considered, yield may be compro-
mised. The closer to the 3′-end a destabilizing mismatch is placed the more
significant the destabilizing effect. Not all mismatches are equally
destabilizing, with the following rank order: CC > CT > GG = AA = AC >
GT. The effectiveness of any combination of mismatches must be deter-
mined empirically for their utility in the ARMS assay being established. The
common primer should be of similar length, with about 50% GC content
and positioned to generate a conveniently sized ARMS PCR product. The
control primers, for checking PCR efficiency, should be designed to have
similar properties to the common primer, and these should yield a fragment
that is of a distinct size to the ARMS product to allow simple identification
by agarose gel analysis. The common and control primers should be
checked to ensure that they do not display complementarity to the 3′-ends
of either allele-specific primer. The control primers can sometimes influence
the efficiency and specificity of the ARMS assay.
ARMS analysis has been used for a large number of polymorphisms, germ-
line and somatic mutations, carrier status determination, prenatal diagnosis
of inherited disease and detection of residual disease during and after cancer
therapy.
11.7 Cleaved amplified polymorphic sequence analysis
(CAPS)
A well-established, but time-consuming method for detecting single
nucleotide polymorphisms (SNPs) is RFLP analysis. A PCR-based alternative
that has been widely used in the analysis and mapping of plant genomes
is CAPS. The method relies on the fact that regions of known genes can be
amplified and nucleotide differences between two alleles lead to a differ-
ence in a restriction site. Thus the two alleles can be distinguished by PCR
amplification followed by appropriate restriction endonuclease digestion
and analysis of the products. In one case the product will be cleaved by the
restriction enzyme while in the other it will not. This approach was
developed by Konieczny and Ausubel (14) for 18 loci in Arabidopsis thaliana
to discriminate between the ecotype Landsberg erecta and Columbia. Each
CAPS marker could be discriminated by at least one restriction enzyme
digest which allows efficient mapping of cosegregating genes by direct PCR
analysis and restriction digestion. A limitation of RFLP and CAPS analysis
is that the SNP must occur within the restriction site for an enzyme, there-
Genome analysis 267
fore the majority of SNPs will not be detectable. More recently the approach
has been modified through the use of modified primers that introduce
additional mismatches that create a restriction site only when the SNP
occurs, allowing easy discrimination between alleles (15,16). The approach
relies upon amplification of relatively short DNA fragments, as the
restriction site is being introduced within the primer and therefore in
general the size discrimination between the two alleles will only be around
20 or so base pairs. For example, the two alleles shown below can be
discriminated by the primer-directed introduction of a G in place of an A
leading to the introduction of a MboI restriction site (15).
The use of the primer to amplify from both alleles:
Primer
GGATCTCGCCGAGAACGA
Allele 1
...GGATCTCGCCGAGAACAACCGTGGAG...
Allele 2
...GGATCTCGCCGAGAACAATCGTGGAG...
leads to PCR products that differ in their ability to be cleaved by MboI that
recognizes the sequence GATC:
Allele 1
...GGATCTCGCCGAGAACGACCGTGGAG...
Allele 2
...GGATCTCGCCGAGAACGATCGTGGAG...
11.8 SNP genotyping using DOP-PCR
SNP genotyping is generally performed by PCR amplifying SNP-containing
loci individually. Although multiplexing can increase the speed of SNP geno-
typing, the difficulty of predicting and determining compatibility as the
complexity increases is challenging (Section 11.11). A method has been
developed that achieves a broader representation of possible amplifiable
sequences by applying degenerate oligonucleotide-primed (DOP)-PCR with
SNP genotyping (17). During the amplification step the partially degenerate
primers bind to many sites within the genome and amplify a product where
two sites lie close to one another in opposite directions. This results in ampli-
fication of a mixture of DNA fragments many of which contain SNPs.
Following this the SNPs can be subjected to genotyping directly from the
DOP-PCR.
DOP-PCR utilizes a partially degenerate primer where about one-third of
the positions in the center of the primer are degenerate. It has been shown
that by varying the length of the unique region from six to ten nucleotides
DOP-PCR results in a genome complexity reduction that supports effective
SNP genotyping in species such as human, mouse, and Arabidopsis thaliana
(17). When the 3′-end of such a degenerate primer consists of six unique
nucleotides, a huge proportion of any eukaryotic genome can be amplified,
most often resulting in a smear of DOP-PCR products on a denaturing
PAGE. However, by increasing the number of unique nucleotides to eight
or ten a discrete number of products is generally observed, and in terms of
the human genome such primers result in the amplification of a few
hundred unique products.
Fragment size is affected by the DOP-PCR cycling parameters and a two-
part cycling program should be used. The first five cycles should have a very
low annealing temperature followed by 35 cycles at a higher annealing
268 PCR
temperature. This ensures primer binding during the initial cycles whereas
the later cycles improve specificity and yield. By lowering the annealing
temperatures and/or shortening extension times, the size range of the
amplified products can also be shifted downward.
A critical factor for the use of a reduced-complexity genome-wide PCR
amplification for SNP genotyping is the reproducibility of the PCR. Using
the same parameters on 32 human genomic DNA samples on two different
thermocyclers, Jordan et al. (17) obtained similar banding patterns, demon-
strating the robustness and reproducibility of the technique.
DOP-PCR product complexity is the most important variable for direct
SNP genotyping. If the complexity is too low, then only a few SNP-contain-
ing fragments are amplified. However, as the complexity approaches that
of the whole genome, the efficiency and accuracy of SNP genotyping
becomes problematic. The effectiveness and accuracy of direct SNP geno-
typing on DOP-PCR products has been shown by sequencing samples of
SNPs from fragments amplified in nine DOP-PCRs from human, mouse, and
Arabidopsis.(17).
11.9 Random amplified polymorphic DNA (RAPD) PCR
RAPD-PCR is also known as arbitrarily primed PCR (AP-PCR) and is a
relatively rapid PCR-based genomic fingerprinting method. However, due
to occasional production of nonparental products it is not recommended
for use in such applications as paternity testing where unequivocal results
are demanded. It provides a very useful tool for genome analysis in
bacterial, fungal and plant identification and population studies where
individual isolates can be compared rapidly. For example they can be used
to identify pathogens or the occurrence of particular strains/pathotypes,
and RAPD markers that cosegregate with pathogenesis traits can provide an
important tool for identifying pathogenic strains of bacteria and fungi. In
plant studies RADP-PCR provides a useful tool for plant breeding programs
by providing markers associated with traits to examine trait heritability.
The approach is also used for the detection of abnormal DNA sequences in
human cancer. Commonly, AP-PCR genomic fingerprints of DNA from
normal and tumor tissue can be used to compare deleted or amplified DNA
sequences in cancer cells.
AP-PCR uses a single primer to initiate DNA synthesis from regions of a
template where the primer matches imperfectly. In order for this to work,
the initial cycles have to be performed at low stringency (37–50°C), normally
for the first five cycles, which allows hybridization to imperfect sites through-
out the genome. The stringency is then increased (55°C) as for standard PCR
amplification and the reaction allowed to proceed for an additional 30–35
cycles. In effect this means that only the best mismatches during the initial
amplification cycles are further amplified. By careful optimization it is
possible to obtain between 50 and 100 distinct DNA fragments which can
then be separated by PAGE. Since AP-PCR is based on arbitrary amplification
under low stringency conditions, various genomic regions can be amplified
simultaneously in a single PCR amplification. AP-PCR can allow visualization
of deleted or amplified DNA fragments with different intensities, which in
turn allows genomes to be differentiated in a quantitative and qualitative
Genome analysis 269
manner. However, although intensity differences may be observed they may
not represent real deletions or amplifications but may reflect genetic
polymorphisms in the human population.
A key advantage of AP-PCR is that targeted DNA fragments can be re-
amplified and cloned using the same primers as used in the initial PCR
amplification. However, there are also problems associated with AP-PCR.
First, the reproducibility of the banding patterns may vary from day to day
even when using the same conditions and the same primers. Second, it has
been demonstrated that both MgCl
2
and template concentrations can affect
the banding pattern. Third, although low stringency conditions are used
during the initial cycles, low annealing temperatures may also affect the
outcome of the analysis.
11.10 Amplified fragment length polymorphisms (AFLPs)
AFLP displays a subset of PCR products derived from restriction digestion
of genomic DNA (18). Genomic DNA is digested with a restriction enzyme
and then double-stranded oligonucleotide adapters are ligated to the ends
of the fragments. A subset of fragments is then amplified by PCR using
primers designed to include part of the adapter, the restriction site and
about three nucleotides beyond the site. Since only a proportion of the DNA
fragments will display complementarity to these three 3′-nucleotides, only
this subset of fragments will be amplified. A nonproofreading enzyme such
as Taq DNA polymerase must be used to ensure that the specificity of the
3′-end of the primer is maintained. The result is that many fragments will
be simultaneously amplified and a radiolabeled dNTP can be included to
label the products, which can be separated by electrophoresis through a
DNA sequencing gel.
The approach can be used to compare samples that display phenotypic
traits, and bands that appear in one phenotype but not the other may repre-
sent markers linked to the phenotypic marker. The use of AFLP markers can
provide powerful tools for molecular breeding strategies in both plants
and animals. The AFLP approach has also been used for comparative
analysis of cDNA populations thus allowing differential analysis of expressed
genes (19). Detailed protocols for AFLP technology are available at
( under the subheading Documents.
11.11 Multiplex PCR analysis of Alu polymorphisms
Alu sequences probably represent the largest family of short interspersed
elements and were first defined as renatured repetitive DNA that was
distinctively cleaved with the restriction enzyme AluI (20). In the human
haploid genome Alus are present in excess of 500 000 copies constituting
approximately 5% of the genomic DNA by mass and having an average
length of 300 bp. Alus are ancestrally derived from the 7SL RNA gene and
move throughout the genome by retrotransposition (21). As genetic
markers Alus have several exceptional features including: (i) stability of
insertion; (ii) unknown mechanism for removal from their chromosomal
location; and (iii) some Alus have not yet reached a stable chromosomal
fixation. The low rate of Alu loci that reach polymorphic levels dictates that
270 PCR