DESCRIPTIVE ANALYSIS ON HOUSEHOLD SURVEY
Bạn đang xem bản rút gọn của tài liệu. Xem và tải ngay bản đầy đủ của tài liệu tại đây (355.33 KB, 11 trang )
26
4.3 DESCRIPTIVE ANALYSIS ON HOUSEHOLD SURVEY
4.3.1 The role of cashew nut in household’s income
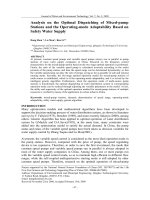
The survey indicates 57% of farmer’s income comes from cashew plantation on average; 68% in Binh
Phuoc and 39% in DaK Nong. 22% of surveyed households have 90% of income from cashew. This
proves a crucial role of cashew in household’s living condition (see Figure 01).
DaKR'Lap Dong P hu Phuoc Long Bu Dan g
Stu dy site s
40.00
50.00
60.00
70.00
C
as
h
ew
n
u
t
i
n
co
m
e
i
n
t
o
t
a
l
i
n
c
o
m
e
(
%
)
$
$
$
$
39.21
38.38%
n=38
67.38
19.19%
n=19
59.11
19.19%
n=19
76.26
23.23 %
n=23
Figure 01. Role of c ashew nut in t otal household's income
Source: Survey data in 2006
Binh P huo c DaKNong
Stu dy sites
40.00
50.00
60.00
C
a
s
h
e
w
n
u
t
i
n
c
o
m
e
i
n
t
o
t
a
l
i
n
c
o
m
e
(
%
)
$
$
68.15
61.62 %
n=61
39.21
38.38 %
n=38
Figure 01. Role of cashew nut in total household's income
Source: Survey data in 2006
4.3.2 Characteristics of households and cashew nut sale-decisive person
Figure 03. Farmgate price by educational grade of sale decisive persons
Source: Survey data in 2006
Grade 01 Grade 02 Grad e 03
Educational grade of the sale decisive person
8000.00
8100.00
8200.00
8300.00
8400.00
8500.00
F
a
r
m
g
a
t
e
p
r
i
c
e
(
V
N
D
/
k
g
)
$
$
$
7965. 33
52.49%
n=137
8302. 15
35.63%
n=93
8551. 61
11.88%
n=31
Figure 02. Cashe w nut's farmgate pr ic e by ethnic gr oups
Source: Survey data in 2006
Ethnic Kinh Ethnic minorities
Ethnic grou ps (Ethnic m inorities=1)
8200.00
8300.00
8400.00
F
a
r
m
g
a
t
e
p
r
i
c
e
(
V
N
D
/
k
g
)
$
$
8450.00
32.09%
n=86
8200.00
67.91%
n=182
The sample includes both Kinh and ethnic minorities that are mostly Stieng and M’Nong. Half of them
have over 12-year in cashew cultivation (Appendix 4.2 and 4.3). Sale-decisive persons are commonly
males at portion of 75.76. They have not obtained high education levels indicated mostly at the first and
second grade. Their jobs are all under farm occupation, posting rate of 96.97%. Thus, job concerning is
totally similar in the sample. Educational grade of the sale-decisive person positively relates to his/her
cashew nut’s farmgate price (see Figure 03). Considering ethnicity, the average cashew nut’s farmgate
price is found discriminatory between Kinh and minorities. While Kinh households has reached higher
price, ethnic minority ones have experienced at 250 VND per kg lower (Figure 02).
27
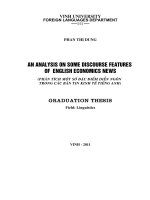
4.3.3 Seasonal impacts on cashew nut’s farmgate price
Cashew is annually harvested in January to May. Accordingly, cashew nut transactions start in
January, lightly decrease in February and March, and then drop in April and May. During harvest, cashew
nut is all in fresh. After May, dried cashew nut possibly appears for trading in market. The survey
appears only one household having transaction after May. The number of this variable is too small
and thus is omitted in the sample. The farmgate prices are all at-harvest prices in this study. Their
temporal variation is observed under inter-seasonal impact in Jan. to May. Cashew nut transaction
has mostly been taken place in Feb. to May, amounting to 89% of total transactions (see Figure
04). Cashew nut’s farmgate prices obviously find great temporal variation though it is only affected
by inter-seasonal impacts. Its highest is in January, and then gradually reduces during remaining
period.
Figure 04. Cashew nut's farmgate price by sale months
Source: Survey data in 2006
Ja nuary February Marc h April May
Sale m onths in 2006
7000.00
7500.00
8000.00
8500.00
9000.00
F
a
r
m
g
a
t
e
p
r
i
c
e
(
V
N
D
/
k
g
)
$
$
$
$
$
9127.27
4.10%
n=11
8785.25
22.76%
n=61
8477.53
33.21%
n=89
7596.95
30.60%
n=82
6620.00
9.33%
n=25
Households’ harvesting cashew nut
4.3.4 Product
Figur e 05. Cashe w nut's farmgat e pr ic e by qua lity
Source: Survey data in 2006
12345
Cashew nut's quality
6500.00
7000.00
7500.00
8000.00
8500.00
F
ar
m
g
at
e
p
r
i
ce
(
V
N
D
/
k
g
)
$
$
$
$
$
6462.50
3.01%
n=8
7272.73
12.41%
n=33
8020. 41
18.42 %
n=49
8242.27
41.35%
n=110
8657.58
24.81%
n=66
Figure 07. Farmga te price by r ationa le of se lling time
Source: Survey data in 2006
No need of drying Indebtedness High price
Rationale of selling time
8000.00
8100.00
8200.00
8300.00
8400.00
8500.00
F
ar
m
g
at
e
p
r
i
ce
(
V
N
D
/
kg
)
$
$
$
8400.00
45.15%
n=121
8000.00
42.16%
n=113
8500.00
12.69%
n=34
As mentioned, there has been too few dried cashew nut transactions, ranking observations so as to
separately observe in the sample. None of package deal and selling short
8
has appeared in the
8
Package deal is the case that farmer sells their cashew nut farm as a whole without any measurement;
selling short is the case of package deal before the harvest point of time.
28
survey. All transactions have conducted under careful measurement and qualitative evaluation. As
a result, the impacts on farmgate price induced by type of product and ranking have been omitted
under empirical consideration.
Cashew nut quality evaluation is practically conducted through its color, size and solid. To observe
its impact on price, questionnaire is designed to mark quality from 5 at the best quality to 1 at the
worst. Cashew nut quality obviously induced a positive impact on farmgate price as indicated in
Figure 05. None of farmers stated that they have sold their cashew nut short. However, there have
appeared circumstances of non-competitive relations owing to buyer’s previous financial support,
which is described in the next debate on household’s bargaining position.
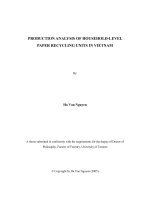
4.3.5 Household’s bargaining position
A practical research of household’s bargaining position is viewed from 03 aspects namely, rationale
of selling time; type of buyers, rationale of choosing buyer. Concerning rationale of selling time, the
fact that farmers decide when to sell their cashew nut indicates their temporary inducements and
thus reveals their bargaining position. The survey indicated that over 45% of transactions have taken
place at harvest because households have been unavailable to fulfill storage and drying cashew nut.
42% of transactions have occurred since farmers are in debt/or in need of money for their production,
consumption and investment. Only 13% of transactions have been operated at favorable selling time
of high price. Figure 07 demonstrates that farmers receive the lowest farmgate price due to their
indebtedness circumstance. As for transactions occurring under high price condition, mean statistic
of farmgate price demonstrates the highest. Under reluctance of storage and drying of cashew nut,
farmgate price on average is between the former worst and the later highest.
Figure 06. Far mgate pr ice by type of buye rs
Source: Survey data in 2006
Deal er Purc has i ng s tati on P roc es si ng u nit
Type of buyers
85 00.00
90 00.00
95 00.00
F
ar
m
g
a
t
e
p
r
i
c
e
(
V
N
D
/
kg
)
$
$
$
8200. 00
38.43 %
n=103
8300. 00
61.19 %
n=164
9500.00
0.37%
n=1
Figure 08. Farmgate price by rationale behind choice of buyers
Source: Survey data in 2006
Competi tive pri c e Clos e re lati onsh ip Previou s fun din g
Rationale behind choice of bu yers
8000.00
8100.00
8200.00
F
a
r
m
g
a
t
e
p
r
i
c
e
(
V
N
D
/
k
g
)
$
$
$
8256.60
19.78%
n=53
8148.36
56.72%
n=152
7985.71
23.51%
n=63
Cashew nut traders are classified into 3 types namely, dealer (collector), purchasing station and
processing factory. The farmer’s buyer seeking also reflects their bargaining position. In search of
the rationale of choosing buyer, the survey has empirically found 3 main groups of reasons
including close relationship, buyer’s previous funding and competitive price. Farmers have
popularly made transactions with dealers and purchasing station, posting 38% and 61% of
transactions (see Figure 06). Farmgate price has in reality changed according to whom farmers
have dealt with. Only one case has directly taken place between farmer and processing
manufactory at the highest price among three types of buyers. Because dealers have collected
cashew nut from farmers to resell to purchasing station, their price has been the lowest. This
margin between two price levels is attributed to dealer’s collection, transportation and his earnings.
29
In search of rationale behind farmer’s choice of buyer, the empirical study has pointed that 23.5%
of farmers seem to have no or little choice of buyer under their indebtedness for their buyers’
previous funding and 56.7% for close relationship (see Figure 08). These high portions
demonstrate that there have still remained so many transactions under non-competitive
relationship. Thus, competitive price has obviously become unattainable in those transactions.
While transactions derived from close relationship have reached little lower farmgate prices than
price in those dealt in competitive way, those occurring as settlement of previous funding have
experienced 2 and 3 percent lower than two other cases, respectively. Some obscure expressions
have empirically revealed. Farmers themselves feel compelled to deal with the buyers who have
previously funded their necessities or working capital in production such as fertilizer, pesticide and
gasoline. In contrast, to the buyers who have maintained close relationship and acceptable price,
farmers willingly sell their cashew nut without strong enforcement.
4.3.6 Market price information
As for market price information, frequencies of each source that farmers have accessed to obtain
information and farmer’s assessment on each information source are investigated. The survey
shows the most popular sources of price information have currently been informal namely, dealers,
farmer’s relatives and neighbors with the highest mean values. There has somewhat appeared a
bias unfavorable to households, higher power of buyer and disadvantage to farmers as price
information has only derived from buyers. Some officially formal sources like television, radio, and
newspapers are effective, cheap and more importantly fair to both buyer and seller in transactions.
Unfortunately, farmer’s access to these sources is limited at low mean value and so many farmers
marking 1 and 2.
Table 08. Market price information source
Information source
Mean of hhlds’ assessment on quality
Mean of access frequency
Television 3.259542 2.6824
Radio 2.94.860 2.3041
Newspapers 2.361702 1.3614
Agricultural extension staff 2.433962 1.3865
Farming association 2.758621 1.5404
Price at purchasing station 2.783784 2.6747
Dealer 2.902778 3.4012
Relatives, neighbor
3.903226
3.8363
Source: Survey data in 2004
As for purchasing station, staff at purchasing station has practically provided cashew nut price to
farmer by face to face or telephone without any official price list. Complained by farmers and
extension staffs, prices from purchasing station have even been changeable within a day. Such a
source of price information thus turns unreliable and risky to farmers’ production and investment. A
great lack of price information from local agricultural extension staff and farming association proves the
shortage of price information of local officers, their incompetence to perform market consultation and
the government’s in-coincidence in supportive policies regarding both technical and marketable
consultation.
In summary, the above descriptive analysis has provided some features of some affecting factors on
farmgate price. The next presentation will focus the proposed hedonic regression.
30
4.4 MODEL RESULT
4.4.1 Analytical framework and model specification
Under hedonic pricing approach, the literature has put forward six groups of explanatory variables
namely, infrastructure, buyer, product, household characteristics, seasonal effects and information.
These are each conformed to practical transaction condition in Binh Phuoc and Dak Nong
provinces so as to reveal the most significant set of variables for estimation model (see Appendix
4.1 for detail description). Using the hedonic pricing model, a linear regression is applied in this
study. Dependent variable is cashew nut’s farmgate price received by household during the studied
year 2006. In short, explanatory variables utilized in hedonic pricing regression are summarized in
Table 09.
Table 09. Explanatory variables and expected signs in estimation model
Variable
Expected sign
Variable
Expected sign
Dependent Variable: farmgate price
(VND/kg)
Independent Variable
Seasonal effects
Distance
February (+)
Distance to nearest purchasing station
(-)
April (-)
Bargaining position
May (-)
Market accessibility
(+)
Household’s characteristics
Bargaining position (Indebtedness=1)
Minority Ethnics (Yes=1) (-)
Product
Year of cashew cultivation (+)
Cashew nut ‘s quality
(+)
Sale decisive person
Production scale (ha)
(+)
Year of education (+)
Information
Sex (Male=1) (-) Follow-up market price before transaction (+)
Note: A positive sign (+) indicates an expected positive impact while a negative sign (-) does an expected
negative one.
4.4.2 Regression result of cashew nut’s farmgate price in Binh Phuoc and DakNong
provinces in 2006
The regression is overally significant with the very small probability of F statistic (0.000) and
acceptable R-squared at 0.599 (see Table 10). The farmgate price variation is well explained by
explanatory variables through the hedonic model. Except for sex and production scale variables,
either t-ratio statistic or probability value proves that the remaining explanatory variables are all
significant at 1% to 10% level. The remaining variables have expected coefficient’s sign.
Table 10. Regression result
Variable Coefficients t-ratio
(**)
Prob.
(*)
Dependent Variable: farmgate price
(VND/kg)
Independent Variable
(Constant) 6,917.1146 26.0701 0.0000
Seasonal effects
February 269.3355 2.1381 0.0335
April (833.9544) (7.0587) 0.0000
May (1,724.9809) (9.3554) 0.0000
Household’s characteristics
Minority Ethnics (Yes=1) (506.9322) 4.5690 0.0000