Advances in Image and Graphics Technologies
Bạn đang xem bản rút gọn của tài liệu. Xem và tải ngay bản đầy đủ của tài liệu tại đây (43.88 MB, 283 trang )
Yongtian Wang · Shengjin Wang
Yue Liu · Jian Yang
Xiaoru Yuan · Ran He
Henry Been-Lirn Duh (Eds.)
Communications in Computer and Information Science
757
Advances
in Image and Graphics
Technologies
12th Chinese conference, IGTA 2017
Beijing, China, June 30 – July 1, 2017
Revised Selected Papers
123
Communications
in Computer and Information Science
Commenced Publication in 2007
Founding and Former Series Editors:
Alfredo Cuzzocrea, Xiaoyong Du, Orhun Kara, Ting Liu, Dominik Ślęzak,
and Xiaokang Yang
Editorial Board
Simone Diniz Junqueira Barbosa
Pontifical Catholic University of Rio de Janeiro (PUC-Rio),
Rio de Janeiro, Brazil
Phoebe Chen
La Trobe University, Melbourne, Australia
Joaquim Filipe
Polytechnic Institute of Setúbal, Setúbal, Portugal
Igor Kotenko
St. Petersburg Institute for Informatics and Automation of the Russian
Academy of Sciences, St. Petersburg, Russia
Krishna M. Sivalingam
Indian Institute of Technology Madras, Chennai, India
Takashi Washio
Osaka University, Osaka, Japan
Junsong Yuan
Nanyang Technological University, Singapore, Singapore
Lizhu Zhou
Tsinghua University, Beijing, China
757
More information about this series at />
Yongtian Wang Shengjin Wang
Yue Liu Jian Yang
Xiaoru Yuan Ran He
Henry Been-Lirn Duh (Eds.)
•
•
•
Advances
in Image and Graphics
Technologies
12th Chinese conference, IGTA 2017
Beijing, China, June 30 – July 1, 2017
Revised Selected Papers
123
Editors
Yongtian Wang
Beijing Institute of Technology
Beijing
China
Shengjin Wang
Tsinghua University
Beijing
China
Yue Liu
Beijing Institute of Technology
Beijing
China
Jian Yang
Beijing Institute of Technology
Beijing
China
Xiaoru Yuan
School of EECS, Center for Information
Science
Peking University
Beijing
China
Ran He
Institute of Automation
Chinese Academy of Sciences
Beijing
China
Henry Been-Lirn Duh
La Trobe University
Melbourne, VIC
Australia
ISSN 1865-0929
ISSN 1865-0937 (electronic)
Communications in Computer and Information Science
ISBN 978-981-10-7388-5
ISBN 978-981-10-7389-2 (eBook)
/>Library of Congress Control Number: 2017960861
© Springer Nature Singapore Pte Ltd. 2018
This work is subject to copyright. All rights are reserved by the Publisher, whether the whole or part of the
material is concerned, specifically the rights of translation, reprinting, reuse of illustrations, recitation,
broadcasting, reproduction on microfilms or in any other physical way, and transmission or information
storage and retrieval, electronic adaptation, computer software, or by similar or dissimilar methodology now
known or hereafter developed.
The use of general descriptive names, registered names, trademarks, service marks, etc. in this publication
does not imply, even in the absence of a specific statement, that such names are exempt from the relevant
protective laws and regulations and therefore free for general use.
The publisher, the authors and the editors are safe to assume that the advice and information in this book are
believed to be true and accurate at the date of publication. Neither the publisher nor the authors or the editors
give a warranty, express or implied, with respect to the material contained herein or for any errors or
omissions that may have been made. The publisher remains neutral with regard to jurisdictional claims in
published maps and institutional affiliations.
Printed on acid-free paper
This Springer imprint is published by Springer Nature
The registered company is Springer Nature Singapore Pte Ltd.
The registered company address is: 152 Beach Road, #21-01/04 Gateway East, Singapore 189721, Singapore
Preface
It was a pleasure and an honor to have organized the 12th Conference on Image and
Graphics Technologies and Applications. The conference was held from June 30 to
July 1, 2017 in Beijing, China. The conference series is the premier forum for presenting research in image processing and graphics and their related topics. The conference provides a rich forum for sharing the progress in the areas of image processing
technology, image analysis and understanding, computer vision and pattern recognition, big data mining, computer graphics and VR, image technology application, with
the generation of new ideas, new approaches, new techniques, new applications, and
new evaluations. The conference was organized under the auspices of Beijing Society
of Image and Graphics, at Beijing Institute of Technology, Beijing, China.
The conference program included keynotes, oral papers, posters, demos, and
exhibitions. For the conference, we received 78 papers for review. Each of these was
assessed by at least two reviewers, with some of papers being assessed by three
reviewers, in all, 26 submissions were selected for oral and poster presentation.
We are grateful for the efforts of everyone who helped to make this conference a
reality. We are grateful to the reviewers who completed the reviewing process on time.
The local host, Beijing Institute of Technology, took care of the local arrangements for
the conference, and welcomed all of the delegates.
The conference continues to provide a leading forum for cutting-edge research and
case studies in image and graphics. We hope you enjoy the proceedings of this
conference.
June 2017
Yongtian Wang
Organization
General Conference Chair
Yongtian Wang
Beijing Institute of Technology, China
Executive and Coordination Committee
Guoping Wang
Chaowu Chen
Mingquan Zhou
Zhiguo Jiang
Shengjin Wang
Chenglin Liu
Yao Zhao
Qingming Huang
Peking University, China
The First Research Institute of the Ministry of Public Security
of P.R.C.
Beijing Normal University, China
Beihang University, China
Tsinghua University, China
Institute of Automation, Chinese Academy of Sciences, China
Beijing Jiaotong University, China
University of Chinese Academy of Sciences, China
Program Committee Chairs
Xiaoru Yuan
Ran He
Jian Yang
Peking University, China
Institute of Automation, Chinese Academy of Sciences, China
Beijing Institute of Technology, China
Organizing Chairs
Xiangyang Ji
Yue Liu
Tsinghua University, China
Beijing Institute of Technology, China
Organizing Committee
Lei Yang
Fengjun Zhang
Xiaohui Liang
Communication University of China, China
Institute of Software, Chinese Academy of Sciences, China
Beijing University of Aeronautics and Astronautics, China
Program Committee
Xiaochun Cao
Weiqun Cao
Mingzhi Cheng
Jing Dong
Institute of Information Engineering, Chinese Academy
of Sciences, China
Beijing Forestry University, China
Beijing Institute of Graphic Communication, China
Institute of Automation, Chinese Academy of Sciences, China
VIII
Organization
Kaihang Di
Fuping Gan
Henry Been-Lirn
Duh
Yan Jiang
Hua Li
Qingyuan Li
Jianbo Liu
Hua Lin
Li Zhuo
Liang Liu
Xiaozhu Lin
Xueqiang Lu
Huimin Ma
Siwei Ma
Nobuchika Sakata
Seokhee Jeon
Yankui Sun
Takafumi Taketomi
Yahui Wang
Yiding Wang
Zhongke Wu
Shihong Xia
Guoqiang Yao
Jun Yan
Cheng Yang
Youngho Lee
Yiping Huang
Xucheng Yin
Jiazheng Yuan
Aiwu Zhang
Danpei Zhao
Huijie Zhao
Institute of Remote Sensing and Digital Earth, Chinese
Academy of Sciences, China
Ministry of Land and Resources of the People’s Republic
of China, China
La Trobe University, Australia
Beijing Institute of Fashion Technology, China
Institute of Computing Technology, Chinese Academy
of Sciences, China
Chinese Academy of Surveying & Mapping, China
Communication University of China, China
Tsinghua University, China
Beijing University of Technology, China
Beijing University of Posts and Telecommunications Sciences,
China
Beijing Institute of Petrochemical Technology, China
Beijing Information Science & Technology University, China
Tsinghua University, China
Peking University, China
Osaka University, Japan
Kyunghee University, Korea
Tsinghua University, China
NAIST, Japan
Beijing University of Civil Engineering and Architecture,
China
North China University of Technology, China
Beijing Normal University, China
Institute of Computing Technology, Chinese Academy
of Sciences, China
Beijing Film Academy, China
Journal of Image and Graphics, China
Communication University of China, China
Mokpo National University, Korea
Taiwan University, China
University of Science and Technology Beijing, China
Beijing Union University, China
Capital Normal University, China
Beijing University of Aeronautics and Astronautics, China
Beijing University of Aeronautics and Astronautics, China
Contents
SAR Image Registration Using Cluster Analysis and Anisotropic
Diffusion-Based SIFT . . . . . . . . . . . . . . . . . . . . . . . . . . . . . . . . . . . . . . .
Yanzhao Wang, Zhiqiang Ge, Juan Su, and Wei Wu
1
Palmprint Recognition with Deep Convolutional Features. . . . . . . . . . . . . . .
Qiule Sun, Jianxin Zhang, Aoqi Yang, and Qiang Zhang
12
Isosurface Algorithm Based on Generalized Three Prism Voxel . . . . . . . . . .
Qing Li, Qingyuan Li, Xiaolu Liu, Zhubin Wei,
and Qianlin Dong
20
A Novel Classifier Using Subspace Analysis for Face Recognition . . . . . . . .
Aihua Yu, Gang Li, Beiping Hou, and Hongan Wang
32
Multiplicative Noise Removal Based on Total Generalized Variation . . . . . . .
Xinli Xu, Huizhu Pan, Weibo Wei, Guodong Wang,
and Wanquan Liu
43
An Improved Superpixel Method for Color Image Segmentation
Based on SEEDS . . . . . . . . . . . . . . . . . . . . . . . . . . . . . . . . . . . . . . . . . .
Rongguo Zhang, Gaoyang Pei, Lifang Wang, Xiaojun Liu,
and Xiaoming Li
55
Global Perception Feedback Convolutional Neural Networks . . . . . . . . . . . .
Chaoyou Fu, Xiang Wu, Jing Dong, and Ran He
65
Single Image Defogging Based on Step Estimation of Transmissivity . . . . . .
Jialin Tang, Zebin Chen, Binghua Su, and Jiefeng Zheng
74
The Method of Crowd Density Alarm for Video Sequence. . . . . . . . . . . . . .
Mengnan Hu, Chong Li, and Rong Wang
85
A Novel Three-Dimensional Asymmetric Reconstruction Method
of Plasma. . . . . . . . . . . . . . . . . . . . . . . . . . . . . . . . . . . . . . . . . . . . . . . .
Junbing Wang, Songhua He, and Hui Jia
Pose Measurement of Drogue via Monocular Vision for Autonomous
Aerial Refueling . . . . . . . . . . . . . . . . . . . . . . . . . . . . . . . . . . . . . . . . . . .
Yun Ye, Yingjie Yin, Wenqi Wu, Xingang Wang, Zhaohui Zhang,
and Chaochao Qian
96
104
X
Contents
Recognition of Group Activities Based on M-DTCWT and Elliptic
Mahalanobis Metrics . . . . . . . . . . . . . . . . . . . . . . . . . . . . . . . . . . . . . . . .
Gensheng Hu, Min Li, Dong Liang, and Wenxia Bao
113
HKS-Based Feature Extraction for 3D Shape Partial Registration . . . . . . . . .
Congli Yin, Mingquan Zhou, Guoguang Du, and Yachun Fan
123
U3D File Format Analyzing and 3DPDF Generating Method . . . . . . . . . . . .
Nan Zhang, Qingyuan Li, Huiling Jia, Minghui Zhang,
and Jie Liu
136
Estimating Cumulus Cloud Shape from a Single Image . . . . . . . . . . . . . . . .
Yiming Zhang, Zili Zhang, Jiayue Hou,
and Xiaohui Liang
147
Design of a Computer-Aided-Design System for Museum Exhibition Based
on Virtual Reality . . . . . . . . . . . . . . . . . . . . . . . . . . . . . . . . . . . . . . . . . .
Xue Gao, Xinyue Wang, Benzhi Yang, and Yue Liu
157
Research on Waves Simulation of the Virtual Sea Battled-Field . . . . . . . . . .
Shanlai Jin, Yaowu Wu, and Peng Jia
168
Deep-Patch Orientation Network for Aircraft Detection in Aerial Images . . . .
Ali Maher, Jiaxin Gu, and Baochang Zhang
178
Real-Time Salient Object Detection Based on Fully Convolutional
Networks . . . . . . . . . . . . . . . . . . . . . . . . . . . . . . . . . . . . . . . . . . . . . . . .
Guangyu Nie, Yinan Guo, Yue Liu, and Yongtian Wang
189
Boosting Multi-view Convolutional Neural Networks for 3D Object
Recognition via View Saliency . . . . . . . . . . . . . . . . . . . . . . . . . . . . . . . . .
Yanxin Ma, Bin Zheng, Yulan Guo, Yinjie Lei, and Jun Zhang
199
Spacecraft Component Detection in Point Clouds . . . . . . . . . . . . . . . . . . . .
Quanmao Wei, Zhiguo Jiang, Haopeng Zhang,
and Shanlan Nie
210
Research on 3D Modeling of Geological Interface Surface . . . . . . . . . . . . . .
Qianlin Dong, Qing-yuan Li, Zhu-bin Wei, Jie Liu,
and Minghui Zhang
219
Image Segmentation via the Continuous Max-Flow Method
Based on Chan-Vese Model . . . . . . . . . . . . . . . . . . . . . . . . . . . . . . . . . . .
Guojia Hou, Huizhu Pan, Ruixue Zhao, Zhonghua Hao,
and Wanquan Liu
232
Contents
Deep-Stacked Auto Encoder for Liver Segmentation . . . . . . . . . . . . . . . . . .
Mubashir Ahmad, Jian Yang, Danni Ai, Syed Furqan Qadri,
and Yongtian Wang
XI
243
A Flattened Maximally Stable Extremal Region Method for Scene Text
Detection . . . . . . . . . . . . . . . . . . . . . . . . . . . . . . . . . . . . . . . . . . . . . . . .
Quan Qiu, Yuan Feng, Fei Yin, and Cheng-Lin Liu
252
A Combinational De-Noising Algorithm for Low-Dose Computed
Tomography . . . . . . . . . . . . . . . . . . . . . . . . . . . . . . . . . . . . . . . . . . . . . .
Wei Zhang and Yan Kang
263
Author Index . . . . . . . . . . . . . . . . . . . . . . . . . . . . . . . . . . . . . . . . . . . .
271
SAR Image Registration Using Cluster Analysis
and Anisotropic Diffusion-Based SIFT
Yanzhao Wang1,2 ✉ , Zhiqiang Ge2, Juan Su1, and Wei Wu1
(
1
2
)
Xi’an High-Tech Institution, No. 2, Tongxin Road, Baqiao District, Xi’an 710025, China
Beijing Institute of Remote Sensing Equipment, Yongding Road, Beijing 100854, China
Abstract. The scale-invariant feature transform (SIFT) algorithm has been
widely used in remote sensing image registration. However, it may be difficult to
obtain satisfactory registration precision for SAR image pairs that contain much
speckle noise. In this letter, an anisotropic scale space constructed with speckle
reducing anisotropic diffusion (SRAD) is introduced to reduce the influence of
noise on feature extraction. Then, dual-matching strategy is utilized to obtain
initial feature matches, and feature cluster analysis is introduced to refine the
matches in relative distance domain, which increases the probability of correct
matching. Finally, the affine transformation parameters for image registration are
obtained by RANSAC algorithm. The experimental results demonstrate that the
proposed method can enhance the stability of feature extraction, and provide
better registration performance compared with the standard SIFT algorithm in
terms of number of correct matches and aligning accuracy.
Keywords: SAR image registration · Scale-invariant feature transform (SIFT)
Speckle reducing anisotropic diffusion (SRAD) · Cluster analysis
1
Introduction
Synthetic aperture radar (SAR) image registration is one of many key procedures in
applications such as matching guidance, information fusion, change detection, and threedimensional reconstruction [1]. Due to complex geometric deformations and grayscale
differences between SAR image pairs, it’s difficult for traditional approaches that may
suffer from poor robustness to obtain a satisfactory registration precision [2].
The feature-based methods are the mainstream methods for SAR image registration.
These methods extract and match significant features from two images and the correla‐
tion between those features is used to determine the alignment. Generally, features
extracted include point, edge, and the centroid of a specific area [3]. Among featurebased methods, scale-invariant feature transform (SIFT) [4] is a representative algo‐
rithm. It has been widely used in image registration for its invariance to image rotation
and scaling and partial invariance to changes in camera viewpoint and illumination [5].
Chen et al. [6] proposed a new definition of gradient computation with ROEWA operator
and reduced the dimension of feature descriptors, which improved the computational
efficiency. Schwind et al. [7] proposed SIFT-OCT, in which the performance of feature
© Springer Nature Singapore Pte Ltd. 2018
Y. Wang et al. (Eds.): IGTA 2017, CCIS 757, pp. 1–11, 2018.
/>
2
Y. Wang et al.
detectors is analyzed to improve the robustness of the algorithm. Many false keypoints
may be detected when traditional SIFT is directly adopted in SAR image registration as
a result of complex imaging conditions of SAR, especially the existence of speckle noise
in the image. These points are randomly distributed with a poor repeatability rate, which
will lead to fewer feature matches and more mismatches.
In order to reduce the negative effect of speckle noise, some improved SIFT algo‐
rithms based on anisotropic scale space (ASS-SIFT) were proposed. Wang et al. [5]
proposed BFSIFT by analyzing the similarity between the bilateral filter and the thermal
diffusion equation, which increased the number of correct matches. According to local
structural characteristics of the image, an anisotropic Gaussian scale space was estab‐
lished [8], improving the robustness of features. Fan et al. [9] adopted Perona-Malik
(PM) equation to establish a nonlinear diffusion scale space and proposed a new defi‐
nition of gradient computation with ROEWA operator, which increased the probability
of correct matching. Compared with traditional SIFT, ASS-SIFT algorithms effectively
preserve fine details and suppress the speckle noise in SAR images, and the local infor‐
mation of the images is described more comprehensively. As a result, the number of
keypoints is increased and the positioning accuracy of control points is improved.
However, they cannot effectively reduce the unstable keypoints caused by the speckle
noise from SAR images. The reason for this is that in the existing ASS-SIFT approaches,
the anisotropic diffusion filters adaptively smooth the noises and preserve the edges due
to their different image gradient magnitudes [10]. If the images contain strong multi‐
plicative noises such as speckles, then the image edges are difficult to distinguish from
the speckled homogeneous region, since both the image boundaries and the multiplica‐
tive noises lead to high image gradient magnitudes. As a result, the speckle noises from
the SAR images will be preserved instead of being smoothed by the anisotropic diffusion
filters and then identified as unstable keypoints in the ASS.
In this paper, we proposed a speckle reducing SIFT match method to obtain stable
keypoints and precise matches for the SAR image registration. The contributions of this
paper are as follows. First, a speckle reducing anisotropic scale space is constructed
based on the speckle reducing anisotropic diffusion (SRAD). Due to the gradient magni‐
tude operator and the Laplacian operator of SRAD, speckle noises are greatly reduced
and the edges of the images are preserved, then the stable keypoints can be obtained.
Second, we utilize dual-matching strategy to obtain initial matches and cluster analysis
in relative distance domain is introduced to eliminate false matches caused by speckle
noise and geometric deformations. With cluster analysis, the keypoint correct match rate
is significantly enhanced. Finally, the affine transformation parameters for image regis‐
tration are obtained by random sample consensus (RANSAC) algorithm with removing
the false matches simultaneously. We validate our method on simulated images and real
SAR images and the experimental results demonstrate the effectiveness of our method.
2
Traditional SIFT Algorithm
SIFT is a famous matching algorithm which was proposed by David Lowe in 1999 and
consummated in 2004. It was created based on local invariant feature of the image, with
SAR Image Registration Using Cluster Analysis
3
good rotation, scale, local affine and gray invariance [6]. Traditional SIFT algorithm
consists of three major stages: multiscale space construction, feature detection and
description, and feature matching.
Firstly, Gaussian scale space is constructed by convolving the original image with
Gaussian kernel at different scales
L(x, y;𝜎) = I(x, y) ∗ G(x, y;𝜎)
L(x, y;k𝜎) = I(x, y) ∗ G(x, y;k𝜎)
}
(1)
Where I(x, y) is the original image and L(x, y;𝜎) is the Gaussian scale space. G(x, y;𝜎) is
the Gaussian function with standard deviation 𝜎 and k is the scale parameter. A series
of difference of Gaussian (DoG) images are achieved by subtracting adjacent Gaussian
images, and extrema of the DoG images are detected as the candidate features.
D(x, y;𝜎) = L(x, y, k𝜎) − L(x, y, 𝜎)
= (k − 1)𝜎 2 ∇2 G ∗ I(x, y)
(2)
Where D(x, y;𝜎) is the Gaussian differential scale space.
Secondly, dominant orientation of each keypoint is calculated for each keypoint, and
a 128-element feature descriptor is constructed based on the gradients in the local image
patches aligned by its dominant orientation.
Finally, feature points are matched using the nearest neighbor distance ratio
(NNDR), and the matching result is optimized by RANSAC algorithm. More details
about SIFT can be found in [4].
3
Description of the Proposed Method
Traditional SIFT has been successfully employed to the registration of optical remote
sensing images. However, it usually fails to provide favorable results when directly used
to SAR images. As is known, SAR images are obtained by coherent processing of the
target scattered signal. The coherent superposition of the scattered electromagnetic
waves usually forms a large number of multiplicative speckle noises, which causes many
false keypoints while real features are buried in the noise. Speckle noises may also blur
the adjacent area of features, which reduces the robustness and distinctiveness of feature
descriptors that are expected to be correctly matched. Therefore, it’s necessary to effec‐
tively reduce the negative effect of speckle noises when using SIFT for SAR image
registration.
3.1 Speckle Reducing Anisotropic Scale Space
Gaussian blurring is one instance of isotropic diffusion filtering which is sensitive to
speckle noise and does not respect the natural boundaries of the object. As a conse‐
quence, many unstable keypoints are brought from the Gaussian scale space of SIFT
and then the matching performance is degraded. The existing ASS-SIFT methods
4
Y. Wang et al.
overcome the shortcomings of the conventional SIFT algorithm based on anisotropic
diffusion filtering. However, they suffer from unstable keypoints caused by speckle
noises in SAR images, since the anisotropic diffusion filters detect edges depending upon
image gradient magnitude and would not smooth the speckled homogeneous regions.
SRAD [11] is an edge-sensitive partial differential equation version of the conven‐
tional speckle reducing filters, which has better properties of speckle reduction and edge
preserving. To enhance the stability of the keypoint detection, we construct an aniso‐
tropic scale space with SRAD. Then the keypoints are detected in the space.
3.1.1 SRAD
Anisotropic diffusion based on partial differential equation is widely used in image
denoising and edge detection [12]. The main idea is heterogeneous diffusion and iterative
smoothing. The partial differential equation of SRAD can be expressed as:
{
𝜕I(x, y;t)∕𝜕t = div[c(q) ⋅ ∇I(x, y;t)]
I(x, y;0) = I0 (x, y)
(4)
where I0 (x, y) is the origin image and I(x, y;t) is the filtered image.div and ∇ are diver‐
gence and gradient operators, and the time t is the scale parameter. In Eq. (4), c(q) refers
to the conductivity coefficient defined as
c(q) =
1
{
}
1 + [q2 (x, y;t) − q20 (t)]∕ q20 (t)[1 + q20 (t)]
(5)
Where q(x, y;t) severs as an edge detector for SRAD determined by
√
q(x, y;t) =
(1∕2)(|∇|∕I)2 − (1∕16)(∇2 I∕I)2
[1 + (1∕4)(∇2 I∕I)]2
(6)
In Eq. (5), q0 (t) is the diffusion threshold which determines the total amount of
diffusion. It can be approximately calculated by Eq. (7).
q0 (t) ≈ q0 exp[−𝜌t]
(7)
In practical applications, 𝜌 generally takes 1/6. c(q) controls the process of diffusion
according to the relationship between the edge intensity and the diffusion threshold. At
the center of an edge, the Laplacian term undergoes zero crossing and the gradient term
dominates, leading to a relatively large q(x, y;t). Then the conductivity coefficient
approaches 0 and the edge is preserved. While in the speckled homogeneous regions,
the normalized image divergence is approximately equal to the normalized gradient
magnitude, resulting in a relatively small q(x, y;t). Thus the conductivity coefficient
closes to 1 and the speckle noise is smoothed.
The edge detector q(x, y;t) contains a normalized gradient magnitude operator and a
normalized Laplacian operator. The second derivative properties of Laplacian operator
SAR Image Registration Using Cluster Analysis
5
can distinguish whether the local grayscale of the image is caused by noise or by the
edge. It is a constant false alarm for speckle noises, thus edges can be detected more
accurately from the speckle noise regions.
3.1.2 Anisotropic Scale Space Construction
The process of image filtering can be transformed into a continuous evolution with time
scale ti. The solution (filtered image) solved by numerical method can correspond to the
image of the discrete scale in the scale space. Thus the anisotropic scale space of the
image can be constructed by obtaining all successive scale images with numerical iter‐
ations.
By means of the semi-implicit schema [13], Eq. (4) can be discretized and recon‐
structed as an iterative form
[
I
i+1
= E − (ti+1 − ti )
m
∑
l=1
]−1
i
Al (I )
Ii
(8)
where I i and I i+1 are the image vector representations at time ti and ti+1, E is the identity
matrix, and Al (I i ) is a coefficient matrix.m represents the dimension of the image. The
two-dimensional diffusion filtering can be decomposed into two independent onedimensional diffusion processes by additive operator splitting (AOS), and the corre‐
sponding linear equations are solved in both x and y directions. Let I i and I i+1 be the
images of x and y directions at time ti+1, then the image at time ti+1 can be determined by
the images from two directions:
/
I i+1 = (Ixi+1 + Iyi+1 ) 2
(9)
Since the anisotropic diffusion filtering is defined in time terms, the discrete scale 𝜎i
is required to be converted into time units using the equation [9]:
ti = 𝜎i2 ∕2
(10)
Thus, the anisotropic scale space L can be formed by a stack of smoothed images
generated by Eqs. (9) and (10)
{
}
L = I 0 (t0 ), I 1 (t1 ), … , I W−1 (tW−1 )
(11)
{
}
where t0 , t1 , ⋅ ⋅ ⋅, tW−1 is a series of discrete evolution times, and W is the total
number of images in the scale space. We take the same approach as done in SIFT,
discretizing the scale space into a series of O octaves and S sublevels
s
S
, o ∈ [0, O − 1], s ∈ [0, S + 2], i ∈ [0, W − 1]
𝜎i (o, s) = 𝜎0 2
0+
(12)
6
Y. Wang et al.
where 𝜎0 is the basic scale, O and S are the number of octaves and sublevels in the
space, while o and s are the index of octave O and interval S. It is noteworthy that, when
we reach the last sublevel in each octave, we downsample the image, as described in
SIFT, and use the downsample image as the initial image for next octave.
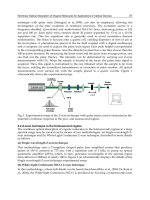
As Fig. 1 shows, we use a RadarSat image and an ALOS-PALSAR image as the
reference images. The Gaussian scale space and SRAD anisotropic scale space of the
two images are constructed. O and S are set to 4 and 3. Fig. 1(b)–(c) in the first row are
the images at the second sublevel within the second octave, and Fig. 1(b)–(c) in the
second row are the images at the third sublevel within the second octave. As it can be
observed, due to the influence of linear filtering, Gaussian scale space images are blurred
with increasing scale values and fine details such as contours and edges are seriously
destroyed. In contrast, strong speckle noises are smoothed and prominent structures are
preserved in the SRAD anisotropic scale space. Thus more stable keypoints can be
extracted.
Fig. 1. Scale space comparison
After the SRAD anisotropic scale space has been constructed, the difference between
adjacent smoothed images in the SRASS is performed. Then the keypoints are detected
as done in the SIFT algorithm.
3.2 Feature Matching and Outlier Removal
Due to the existence of multiplicative speckle noises in SAR images, a large number of
unreliable keypoints will inevitably appear within the initial keypoints, which will lead
to inaccurate correspondence and further affect the correct calculation of the transfor‐
mation parameters. So it is necessary to eliminate the false matches within the initial
keypoints effectively.
SAR Image Registration Using Cluster Analysis
7
3.2.1 Dual-Matching Strategy
When there are repeated patterns in the image, many keypoints in the sensed image are
matched to the same one in the reference image using the SIFT matching strategy
(distance ratio). Therefore, we use dual-matching strategy (use the distance ratio twice)
[5], namely, keypoint A in the sensed image and keypoint B in the reference image are
accepted as a correspondence only when A and B are matched to each other by the
distance ratio, which improves the possibility of correct matches.
3.2.2 False Matches Removal Using Cluster Analysis
A lot of false matches still exist in the initial matching results directly obtained by dualmatching strategy. Due to the strong randomness in the distribution of speckle noises,
most of false matches are random while correct matches often have some consistent
inner connections. In addition, geometric differences between images cause a difference
in the position of the feature matches, but the relative distances of correct matches should
maintain a high consistency.
We first calculate the relative distances Δx and Δy between feature matches in both
horizontal and vertical directions. Then the relative distance domain is established and
distance relations of the feature matches are mapped into the domain. (Δx, Δy) is used
as the cluster feature to make K-means cluster analysis of the relative distances. False
matches are randomly distributed in the domain and scatter in smaller classes for their
poor consistency in distance. In contrast, the correct matches are more concentrated in
distribution, so they can be selected by maintaining the largest class in the domain. In
this paper, the relationship between the number of classes and the number of correct
matches is observed in all experiments. It can be observed that with the increase of the
number of classes, the number of correct matches increases, but does not satisfy a
monotonically increase.
3.2.3 Matching Result Optimized by RANSAC
After above steps, correct matches have accounted for the vast majority in the matching
result. The result can be further optimized by random sample consensus (RANSAC)
algorithm [14]. The commonly used affine transformation is chosen as the transforma‐
tion model, and the registration parameters are obtained with the least squares method.
4
Experimental Results and Analysis
4.1 Stability Analysis of Feature Extraction
To verify the improvement on feature extraction stability, A SAR image with a size of
450 × 287 is tested. A comparison of the performance in feature extraction between our
approach and Ref. [9] is made under the conditions of noise changes, scale changes and
rotation transformation. The Gaussian noise model with mean 1 and variance 0.1 × i
(i = 1, … , 10) is utilized to add multiplicative noise to the reference image. Figure 2(a)
shows the reference image. Figure 2(b) and (c) shows the simulated noise image with
variances 0.2 and 0.5.
8
Y. Wang et al.
Fig. 2. Partial simulated images
The repeatability rate refers to the proportion of the number of keypoints that are
repeatedly extracted from two images to the total number of the keypoints within the
range of a positioning error (1.2 is taken in our paper). The higher the repeatability rate
is, the stronger the stability of feature extraction will be.
Figure 3(a) shows the changes of the repeatability rates between the reference images
and the simulated images with different noise variances. It can be seen that the repeat‐
ability rates obtained by our method are always higher than those of Ref. [9]. Meanwhile,
with the increase of the variance, the repeatability rates decrease sharply in Ref. [9],
while those obtained by our method keep a stable decrease. The reason is that speckle
noises are effectively smoothed by SRAD, thus the probability that noises are errone‐
ously extracted as keypoints is reduced and the positioning accuracy of the keypoints is
improved.
Fig. 3. Repeatability rates comparison
In addition, let Fig. 2(b) be the reference image, and Fig. 2(c) is rotated and scaled
as the transformed images. Figure 3(b) and (c) show the changes of the repeatability
rates between the reference images and the images transformed. Compared with Ref. [9],
the repeatability rates obtained by our method are higher and keep a more stable change.
The results show that the keypoints extracted by our method still keep a greater stability
for images with different rotation and scale differences.
4.2 Comparisons with Other Registration Algorithms
To evaluate the registration performance of the proposed method, we experimentally
validate it on three SAR image pairs with different time, different bands and different
polarization modes. Registration comparisons between the proposed method and the
SAR Image Registration Using Cluster Analysis
9
traditional SIFT and Ref. [9] are implemented to demonstrate the superiority of our
method in registration performance.
The first pair is two ALOS-PALSAR images from the same region. These two images
were taken at different time and the resolution of them is 10 m. To increase the difficulty
of the test, the sensed image is simulated with a rotation of 30◦. The second pair is two
multi-band images from the same region. One image with a size of 500 × 500 form
C-band taken by Radarsat-2 is selected as the reference image, and the other one with
a size of 450 × 450 from X-band taken by TerraSAR is selected as the sensed image.
The third pair is two 512 × 512 multi-polarization images with the reference image
obtained from the HV mode, and the sensed image of the same scene obtained from the
VV mode. All of the three image pairs are contaminated by speckle noises.
The quantitative evaluation results for each method are listed in Table 1 and Fig. 4
is the registration result of our method. Compared with traditional SIFT, the number of
keypoints detected and correct matches obtained by our method is larger and the regis‐
tration accuracy has been greatly improved. Although the number of feature points
extracted by the Ref. [9] is more than that of ours, the correct matches are relatively
fewer and the registration accuracy is not satisfactory.
Table 1. Quantitative comparison of different algorithms
Data sets
Method
1
SIFT
Ref. [9]
Our approach
SIFT
Ref. [9]
Our approach
SIFT
Ref. [9]
Our approach
2
3
Number of keypoints
Reference image Sensed image
342
326
448
412
427
395
1397
631
1693
801
1642
763
1105
1090
1549
1467
1454
1325
Match
RMSE/pixel
5
10
14
8
21
29
8
17
24
6.81
2.13
1.26
4.06
2.07
1.19
5.67
2.31
0.94
It is found that SRAD has a better filtering performance than the Gaussian function,
and it can preserve edges of the image while smoothing speckle noise. Thus the number
of false feature matches is reduced and the real keypoints contained in the important
targets such as edges, contours and textures are preserved, which increases the number
of keypoints detected and the probability of correct matching. Traditional SIFT is seri‐
ously affected by speckle noise. Many false keypoints are detected while a large amount
of real points are lost as the edges are blurred, which greatly reduces the number of
keypoints. Due to the use of nonlinear diffusion filtering in Ref. [9], the keypoints
extracted is even more than that of our method. But it can’t be ignored that many speckle
noises are mixed with the real ones, which reduces the stability of feature extraction.
In the stage of feature matching, due to the existence of false keypoints as well as
complex geometric changes and texture differences between the three image pairs, the
registration accuracy is difficult to be ensured if only European distance is chosen as the
10
Y. Wang et al.
Fig. 4. Matches found by the method proposed
similarity measure to make a feature matching. In Ref. [9], false points are eliminated
with phase congruency of the points before matching, but the threshold of phase congru‐
ency is difficult to select. It is unreliable to remove the false keypoints from the real ones
relying on the empirical threshold as a result of the randomness of speckle noises. By
contrast, dual-matching strategy used in our approach overcomes the limitation of
unidirectional ratio method. The relative position information between features is
analyzed and the cluster analysis is utilized to effectively remove the mismatches,
improving the registration accuracy. In addition, our approach can obtain better regis‐
tration performance even rotation, scale and grayscale changes exist between the images,
which inherits the superiority of SIFT.
5
Conclusions
In this paper, a SAR image registration approach based on improved SIFT is proposed.
An anisotropic scale space of the image is constructed by SRAD with good properties
of noise reduction and edge preserving, which improves the number and the stability of
the keypoints and weakens the negative effect of speckle noises. Dual-matching strategy
and cluster analysis in relative distance domain are introduced to refine the matches,
which eliminates the false matches caused by speckle noises. The number of correct
matches is increased and the registration precision is improved. Experimental results
show that the method proposed has strong robustness to speckle noises and good adapt‐
ability to grayscale, rotation and scale differences of the images.
SAR Image Registration Using Cluster Analysis
11
References
1. Zitova, B., Flusser, J.: Image registration methods: a survey. Image Vis. Comput. 21(11),
977–1000 (2003)
2. Zhu, H., Ma, W.P., Hou, B., et al.: SAR image registration based on multifeature detection
and arborescence network matching. J. IEEE Geosci. Remote Sens. Lett. 13(5), 706–710
(2016)
3. Su, J., Li, B., Wang, Y.Z.: A SAR image registration algorithm based on closed uniform
regions. J. Electron. Inform. Technol. 38(12), 3282–3288 (2016)
4. Lowe, D.G.: Distinctive image features from scale-invariant keypoints. Int. J. Comput. Vis.
60(2), 91–110 (2004)
5. Wang, S.H., You, H.J., Fu, K.: BFSIFT: a novel method to find feature matches for SAR
image registration. IEEE Geosci. Remote Sens. Lett. 9(4), 649–653 (2012)
6. Chen, Y., Zhao, H.C., Chen, S., Zhang, S.N.: Image matching algorithm based on SIFT for
missile-borne SAR. Syst. Eng. Electron. 38(6), 1276–1280 (2016)
7. Schwind, P., Suri, S., Reinartz, P., et al.: Applicability of the SIFT operator to geometric SAR
image registration. Int. J. Remote Sens. 31(8), 1959–1980 (2010)
8. Wang, F., You, H.J., Fu, K.: Adapted anisotropic Gaussian sift matching strategy for SAR
registration. IEEE Geosci. Remote Sens. Lett. 12(1), 160–164 (2015)
9. Fan, J.W., Wu, Y., Wang, F., et al.: SAR image registration using phase congruency and
nonlinear diffusion-based SIFT. IEEE Geosci. Remote Sens. Lett. 12(3), 562–566 (2015)
10. Weickert, J.: A review of nonlinear diffusion filtering. In: Haar Romeny, B., Florack, L.,
Koenderink, J., Viergever, M. (eds.) Scale-Space 1997. LNCS, vol. 1252, pp. 1–28. Springer,
Heidelberg (1997). />11. Yu, Y., Acton, S.T.: Speckle reducing anisotropic diffusion. IEEE Trans. Image Process.
11(11), 1260–1270 (2002)
12. Perona, P., Malik, J.: Scale space and edge detection using anisotropic diffusion. IEEE Trans.
Pattern Anal. Mach. Intell. 12(7), 629–639 (1990)
13. Weickert, J., Romeny, B.M.H., Viergever, M.A.: Efficient and reliable schemes for nonlinear
diffusion filtering. IEEE Trans. Image Process. 7(3), 398–410 (1998)
14. Fischler, M.A., Bolles, R.C.: Random sample consensus: a paradigm for model fitting with
applications to image analysis and automated cartography. Commun. ACM 24(6), 381–395
(1981)
Palmprint Recognition with Deep Convolutional Features
Qiule Sun, Jianxin Zhang ✉ , Aoqi Yang, and Qiang Zhang
(
)
Key Laboratory of Advanced Design and Intelligent Computing, Ministry of Education,
Dalian University Dalian, Dalian, People’s Republic of China
Abstract. Palmprint recognition has become popular and significant in many
fields because of its high efficiency and accuracy in personal identification. In this
paper, we present a scheme for palmprint features extraction based on deep
convolutional neural network (CNN). The CNN, which naturally integrates low/
mid/high-level feature, performs excellently in processing images, video and
speech. We extract the palmprint features using the CNN-F architecture, and
exactly evaluate the convolutional features from different layers in the network
for both identification and verification tasks. The experimental results on public
PolyU palmprint database illuminate that palmprint features from the CNN-F
respectively achieve the optimal identification rate of 100% and verification accu‐
racy of EER = 0.25%, which demonstrate the effectiveness and reliability of the
proposed palmprint CNN features.
Keywords: Deep convolutional neural network · Palmprint recognition
Feature extraction
1
Introduction
As a kind of biometric identification technology, palmprint recognition has become a
research focus in the field of artificial intelligence, pattern recognition and image
processing in recent years. Existing palmprint recognition methods can be divided into
several categories including structure-based methods, texture-based methods, subspacebased methods, statistics-based methods. The structure-based methods are to extract the
relevant point features and line features [1, 2]. However, the recognition accuracy of the
structure-based methods is relatively low, and the features need more storage space.
Texture-based methods are to extract rich texture information from palmprint, for
instance, PalmCode [3], Competitive Code [4], RLOC [5], BOCV [6] and double halforientation based method [7]. These methods have stronger classification ability as well
as good recognition accuracy. However, they may be affected by the translation and
rotation of palmprint image because of the coding of palmprint features. The subspacebased methods means that the palmprint images are regarded as high dimensional vectors
or matrices. They are transformed into low dimensional vectors or matrices by mapping
or transformation, and make representations and matching for the palmprint in the low
dimensional space [8–10]. The subspace methods possess high recognition accuracy and
fast recognition speed. The statistics-based methods, Fourier Transform [11] and
© Springer Nature Singapore Pte Ltd. 2018
Y. Wang et al. (Eds.): IGTA 2017, CCIS 757, pp. 12–19, 2018.
/>
Palmprint Recognition with Deep Convolutional Features
13
Wavelet Transform [12, 13], employ the center of gravity, mean value and variance of
the palmprint image as the features. The features that the statistics-based methods extract
are relatively small. All of the above methods indicate a superiority performance in
palmprint recognition. Palmprint features extraction is the most basic and important part
of palmprint recognition, which is the key to the recognition performance.
Recently, deep neural networks, whose fundamental ingredient is the training of a
nonlinear feature extractor at each layer [14, 15], have demonstrated the excellent
performance in image representation. A variety of depth convolutional neural networks,
such as AlexNet [16], VggNet [17] and ResNet [18], achieve outstanding performance
on processing images. Learning from a large-scale ImageNet database [19], they can
extract genetic feature representations that generalize well and could be transplanted
onto other image applications [20, 21]. Since we do not have enough palmprint images
to train deep convolutional neural network from scratch, we employ the pre-trained deep
convolutional neural network, CNN-F [22], as a feature extractor for the palmprint image
in this paper. The goal is to introduce the pre-trained CNN-F for palmprint features
extraction, and extensively evaluate the CNN features for palmprint verification and
identification tasks.
The rest of paper is organized as follows. In Sect. 2, we briefly introduce the archi‐
tecture of CNN-F and palmprint convolutional features. Experimental results for veri‐
fication and identification tasks are given in Sect. 3, followed by the conclusion in Sect. 4.
2
Palmprint Recognition Based on CNN-F
2.1 Architecture of the CNN-F
The CNN-F (“F” for “fast”) network [17] is made by Chatfield et al. [22] and inspired
by the success of the CNN of Krizhevsky et al. [16]. It examined in Reference [22]. This
network is meant to be architecturally similar to the original AlexNet [16]. The CNNF configuration is given in Table 1. It has recently achieved state-of-the-art performance
on image classification on ImageNet database, and includes 8 learned layers. The first
five learned layers are said to be convolutional layers, the last three learned layers on
the top of architecture are called Fully Connected (FC). The first convolutional layer
(“layer 1”) filters the 224 × 224 × 3 size input image with 64 kernels of size 11 × 11 × 3
with a stride of 4 pixels (this is the distance between the receptive field centers of neigh‐
boring neurons in a kernel map). The second convolutional layer (“layer 5”), which takes
as input the output of the previous layer, filters it with 256 kernels of size 5 × 5 × 256.
Different from [17] and similar to [16], the first two convolutional layers include the
Local Response Normalization (LRN) [16] operator. As well, the next three convolu‐
tional layers (“layer 9”, “layer 11” and “layer 13”) each has 256 kernels of size
3 × 3 × 256. The first two FC layers (“layer 16” and “layer 17”) are regularized using
dropout [16], and output 4096 dimensional convolutional features. The output of the last
FC layer (“layer 20”) are 1000 dimensions. Please consult [22] for further details.
14
Q. Sun et al.
Table 1. The CNN-F configuration (For each convolution layer, the number of convolution
filters, receptive field size, the convolution stride and spatial padding are indicated.)
Layer
0
1
2
3
4
5
6
7
8
9
10
Type
input
conv
relu
lrn
mpool
conv
relu
lrn
mpool
conv
relu
Name
-
conv1
relu1
norm1
pool1
conv2
relu2
norm2
pool2
conv3
relu4
Filt dim -
3
-
-
-
64
-
-
-
256
-
Num
filts
-
64
-
-
-
256
-
-
-
256
-
Stride
-
4
1
1
2
1
1
1
2
1
1
Pad
-
1
0
0
1
1
0
0
1
1
0
Layer
11
12
13
14
15
16
17
18
19
20
21
Type
conv
relu
conv
relu
mpool
conv
relu
conv
relu
conv
softmax
Name
conv4
relu4
conv5
relu5
pool5
fc6
relu6
fc7
relu7
fc8
prob
Filt dim 256
-
256
-
-
256
-
4096
-
4096
-
Num
filts
256
-
256
-
-
4096
-
4096
-
1000
-
Stride
1
1
1
1
2
1
1
1
1
1
1
Pad
1
0
1
0
1
1
0
1
0
1
0
2.2 Palmprint Convolutional Features
The CNN-F is suitable to images of 224 × 224 pixels size, which must be colorful. Our
image size is 128 × 128 and gray. So we have made a little pre-processing, which palm‐
print images are first resized to 224 × 224 and transferred to be colorful. Each layer has
a plurality of feature maps, one of which is extracted by a convolution filter. For example,
the input image is convoluted with 64 kernels of size 11 × 11 × 3 to obtain 64 feature
maps, which is the extracted convolution feature of the first convolutional layer. The
feature maps, as input data, are then processed by the next layers to obtain other different
feature maps according to the number of convolution filters and the filter size. Similar
processing is done in other layers. Finally, we can capture the features of each layer and
extract features of different layers from the network. We measure the recognition rate
of the palmprint images according to the features. Then, we use cosine distance to
calculate the difference of the inter-class and intra-class palmprint images, according to
the cosine distance calculate the value of False Acceptance Rate (FAR), False Reject
Rate (FRR), Equal Error Rate (EER) and recognition rate.
3
Experiments and Analysis
The experiments extract the palmprint images features using various layers of the
network, and evaluate them on the PolyU palmprint database [23] for both recognition
and verification tasks. All of our experiments are carried out on a PC machine with
3.30 GHz CPU, 4G memory and Matlab R2015b.