LabVIEW Demonstration Guide
Bạn đang xem bản rút gọn của tài liệu. Xem và tải ngay bản đầy đủ của tài liệu tại đây (735.25 KB, 122 trang )
LabVIEW
®
Demonstration Guide
March 1996 Edition
Part Number 321215A-01
© Copyright 1996 National Instruments Corporation. All Rights Reserved.
GPIB:
DAQ:
VXI:
LabVIEW:
LabWindows:
HiQ:
E-mail:
FTP Site:
ftp.natinst.com
Web Address:
BBS United States: (512) 794-5422 or (800) 327-3077
BBS United Kingdom: 01635 551422
BBS France: 1 48 65 15 59
(512) 418-1111 or (800) 329-7177
Tel: (512) 795-8248
Fax: (512) 794-5678 or (800) 328-2203
Australia 03 9 879 9422, Austria 0662 45 79 90 0, Belgium 02 757 00 20,
Canada (Ontario) 519 622 9310, Canada (Québec) 514 694 8521, Denmark 45 76 26 00,
Finland 90 527 2321, France 1 48 14 24 24, Germany 089 741 31 30, Hong Kong 2645 3186,
Italy 02 48301892, Japan 03 5472 2970, Korea 02 596 7456, Mexico 95 800 010 0793,
Netherlands 0348 433466, Norway 32 84 84 00, Singapore 2265886, Spain 91 640 0085,
Sweden 08 730 49 70, Switzerland 056 200 51 51, Taiwan 02 377 1200, U.K. 01635 523545
National Instruments Corporate Headquarters
6504 Bridge Point Parkway Austin, TX 78730-5039 Tel: (512) 794-0100
Internet Support
Bulletin Board Support
FaxBack Support
Telephone Support (U.S.)
International Offices
Important Information
Warranty
The media on which you receive National Instruments software are warranted not to fail to execute programming
instructions, due to defects in materials and workmanship, for a period of 90 days from date of shipment, as evidenced
by receipts or other documentation. National Instruments will, at its option, repair or replace software media that do
not execute programming instructions if National Instruments receives notice of such defects during the warranty
period. National Instruments does not warrant that the operation of the software shall be uninterrupted or error free.
A Return Material Authorization (RMA) number must be obtained from the factory and clearly marked on the outside
of the package before any equipment will be accepted for warranty work. National Instruments will pay the shipping
costs of returning to the owner parts which are covered by warranty.
National Instruments believes that the information in this manual is accurate. The document has been carefully
reviewed for technical accuracy. In the event that technical or typographical errors exist, National Instruments
reserves the right to make changes to subsequent editions of this document without prior notice to holders of this
edition. The reader should consult National Instruments if errors are suspected. In no event shall National
Instruments be liable for any damages arising out of or related to this document or the information contained in it.
E
XCEPT
AS
SPECIFIED
HEREIN
, N
ATIONAL
I
NSTRUMENTS
MAKES
NO
WARRANTIES
,
EXPRESS
OR
IMPLIED
,
AND
SPECIFICALLY
DISCLAIMS
ANY
WARRANTY
OF
MERCHANTABILITY
OR
FITNESS
FOR
A
PARTICULAR
PURPOSE
.
C
USTOMER
’
S
RIGHT
TO
RECOVER
DAMAGES
CAUSED
BY
FAULT
OR
NEGLIGENCE
ON
THE
PART
OF
N
ATIONAL
I
NSTRUMENTS
SHALL
BE
LIMITED
TO
THE
AMOUNT
THERETOFORE
PAID
BY
THE
CUSTOMER
. N
ATIONAL
I
NSTRUMENTS
WILL
NOT
BE
LIABLE
FOR
DAMAGES
RESULTING
FROM
LOSS
OF
DATA
,
PROFITS
,
USE
OF
PRODUCTS
,
OR
INCIDENTAL
OR
CONSEQUENTIAL
DAMAGES
,
EVEN
IF
ADVISED
OF
THE
POSSIBILITY
THEREOF
. This limitation of the liability of National
Instruments will apply regardless of the form of action, whether in contract or tort, including negligence. Any action
against National Instruments must be brought within one year after the cause of action accrues. National Instruments
shall not be liable for any delay in performance due to causes beyond its reasonable control. The warranty provided
herein does not cover damages, defects, malfunctions, or service failures caused by owner’s failure to follow the
National Instruments installation, operation, or maintenance instructions; owner’s modification of the product;
owner’s abuse, misuse, or negligent acts; and power failure or surges, fire, flood, accident, actions of third parties, or
other events outside reasonable control.
Copyright
Under the copyright laws, this publication may not be reproduced or transmitted in any form, electronic or
mechanical, including photocopying, recording, storing in an information retrieval system, or translating, in whole or
in part, without the prior written consent of National Instruments Corporation.
Trademarks
LabVIEW
®
and NI-488M
™
are trademarks of National Instruments Corporation.
Product and company names listed are trademarks or trade names of their respective companies.
WARNING REGARDING MEDICAL AND CLINICAL USE OF NATIONAL INSTRUMENTS PRODUCTS
National Instruments products are not designed with components and testing intended to ensure a level of reliability
suitable for use in treatment and diagnosis of humans. Applications of National Instruments products involving
medical or clinical treatment can create a potential for accidental injury caused by product failure, or by errors on the
part of the user or application designer. Any use or application of National Instruments products for or involving
medical or clinical treatment must be performed by properly trained and qualified medical personnel, and all
traditional medical safeguards, equipment, and procedures that are appropriate in the particular situation to prevent
serious injury or death should always continue to be used when National Instruments products are being used.
National Instruments products are NOT intended to be a substitute for any form of established process, procedure, or
equipment used to monitor or safeguard human health and safety in medical or clinical treatment.
©
National Instruments Corporation v LabVIEW Demonstration Guide
About
This
Manual
The
LabVIEW Demonstration Guide
contains the information you need
to get started with the Laboratory Virtual Instrument Engineering
Workbench (LabVIEW) software package. LabVIEW simplifies
scientific computation, process control, and test and measurement
applications, and you can also use it for a wide variety of other
programming applications.
This demonstration guide gives you a brief introduction to LabVIEW,
touching on its basic fundamental concepts.
Organization of This Manual
This manual is organized as follows:
• The Preface,
Getting Started with the LabVIEW Demonstration
, tells
you how to get started with the
LabVIEW Demonstration Package
and explains the different demonstrations you can view in the
package.
• Chapter 1,
Introduction to LabVIEW,
describes what LabVIEW is,
what a Virtual Instrument (VI) is, how to use the LabVIEW
environment (windows, menus, palettes, and tools), how to
operate VIs, how to edit VIs, and how to create VIs.
• Chapter 2,
Creating a SubVI
, describes what a subVI is, teaches you
how to create the icon and connector, and teaches you how to use a
VI as a subVI.
• Chapter 3,
Loops and Charts
, introduces While Loops, teaches you
how to display data in a chart, teaches you about shift registers and
how to use them, and teaches you how to use For Loops.
• Chapter 4,
Arrays, Clusters, and Graphs
, discusses how to create
arrays, use basic array functions, clusters, and graphs. You also learn
what polymorphism is, and how to use graphs to display data.
• Chapter 5,
Case and Sequence Structures and the Formula Node
,
describes how to use the Case structure and Sequence structure,
sequence locals and Formula Nodes.
About This Manual
LabVIEW Demonstration Guide vi
©
National Instruments Corporation
• Chapter 6,
Strings and File I/O
, teaches you how to create string
controls and indicators and teaches you how to use string functions,
file input and output operations, save data to files in spreadsheets, and
write data to and read data from text files.
• Chapter 7,
Data Acquisition
(for Windows, Macintosh, and Sun)
and
Instrument Control
, discusses how to acquire data from a plug-in data
acquisition board, teaches you about VISA, teaches you about GPIB,
shows you how to control a serial port interface from LabVIEW,
discusses VXI (for Windows, Macintosh, and Sun), teaches you about
instrument drivers and how to use them, and teaches you about using
a Frequency Response Test VI.
Conventions Used in This Manual
The following conventions are used in this manual:
bold
Bold text denotes menus, menu items, or dialog box buttons or options. In
addition, bold text denotes VI input and output parameters.
italic
Italic text denotes emphasis, a cross reference, or an introduction to a key
concept.
bold italic
Bold italic text denotes a note, caution, or warning.
monospace
Monospace font denotes text or characters that you enter using the
keyboard. Sections of code, programming examples, syntax examples,
and messages and responses that the computer automatically prints to the
screen also appear in this font.
italic
Italic text in this font denotes that you must supply the appropriate words
monospace
or values in the place of these items.
<> Angle brackets enclose the name of a key on the keyboard—for example,
<
Shift
>.
- A hyphen between two or more key names enclosed in angle brackets
denotes that you should simultaneously press the named keys–for
example, <
Shift-Delete
> .
»
The
» symbol leads you through nested menu items and dialog box
options to a final action. The sequence
File»Page Setup»Options»Substitute Fonts
About This Manual
©
National Instruments Corporation vii LabVIEW Demonstration Guide
directs you to pull down the File menu, select the Page Setup item, select
Options, and finally select the Substitute Fonts option from the last
dialog box.
paths Paths in this manual are denoted using backslashes (\) to separate drive
names, directories, and files, as in drivename\dir1name\
dir2name\myfile.
IEEE 488.1 and IEEE 488.1 and IEEE 488.2 refer to the ANSI/IEEE Standard 488.1-1987
IEEE 488.2 and the ANSI/IEEE Standard 488.2-1987, respectively, which define
the GPIB.
Note: This icon to the left of bold italicized text denotes a note, which alerts you
to important information.
Customer Education
National Instruments offers hands-on LabVIEW Basics and Advanced
courses to help you quickly master LabVIEW and develop successful
applications. The comprehensive Basics course not only teaches you
LabVIEW fundamentals, but also gives you hands-on experience
developing data acquisition and instrument control applications. The
follow-up Advanced course teaches you how to maximize the
performance and efficiency of LabVIEW applications. Contact
National Instruments for a detailed course catalog and for course fees
and dates.
©
National Instruments Corporation ix LabVIEW Demonstration Guide
Getting Started with the
LabVIEW Demonstration
Preface
This preface tells you how to get started with the LabVIEW
Demonstration Package and explains the different demonstrations you
can view in the package.
Open your LabVIEW Demonstration Package application by clicking
on the LabVIEW icon in your LabVIEW Demonstration folder. When
you open the LabVIEW Demonstration Package, the LabVIEW Demo
VI appears on your screen automatically.
This Demonstration VI provides a quick glimpse into the many ways
that LabVIEW can be used to solve your software needs. Clicking on a
category button takes you to a specific demonstration of a program
running in LabVIEW. The program puts a check mark beside every
category that you’ve accessed, so you can keep track of what you have
viewed already.
Preface Getting Started with the LabVIEW Demonstration
LabVIEW Demonstration Guide x
©
National Instruments Corporation
Clicking on the category will bring up an example application written
entirely in LabVIEW. You can look into each of these demonstration
applications and see how they work. For more information about the
demonstration you are viewing, click on the blue, More Info... button
at the bottom of the application, or press the <F5> key. To return to the
main demonstration menu, click on the red, Return button, which is
also at the bottom of each application, or press the <F4> key.
The following list describes each category in the Demonstration VI.
Look at a LabVIEW Test and Measurement application.
Demonstrates the LabVIEW Test Executive, which is an application
developed in LabVIEW that you can use to control testing for
production and manufacturing test applications.
Look at a LabVIEW Factory Automation application.
Simulates a process monitoring and control application created in
LabVIEW.
Preface Getting Started with the LabVIEW Demonstration
©
National Instruments Corporation xi LabVIEW Demonstration Guide
See how easy graphical programming is with LabVIEW.
Introduces you to graphical programming, and shows you the basics
behind building Virtual Instruments (VIs) in LabVIEW.
Investigate the LabVIEW Analysis Libraries.
Demonstrates LabVIEW’s analysis libraries and shows you how you
can use these libraries to create analysis systems.
Investigate resources to help build LabVIEW applications.
Shows you to the many developmental resources available with your
LabVIEW package, including toolkits, information sources, courses
available, and technical support options with LabVIEW.
Explore instrument control using LabVIEW.
Tells you how you can use LabVIEW’s flexible interface for instrument
control applications.
Examine a LabVIEW low-speed data acquisition application.
Shows how you can use LabVIEW with data acquisition devices to
monitor, collect, and analyze data.
Discover LabVIEW for real-time data acquisition applications.
Demonstrates why LabVIEW works great with high-speed data
acquisition applications by offering you maximum power and
flexibility with your DAQ devices.
Learn more about National Instruments.
Gives you a brief introduction to National Instruments, and tells you
how you can locate the National Instruments office nearest to you.
Explore LabVIEW for your own applications.
Want to know more? This option tells you how you can take a more
advanced look at LabVIEW, using the LabVIEW Demonstration Guide.
Now you are ready to take a look at all of the capabilities of the
LabVIEW package. For a more in-depth look at programming in
LabVIEW, refer to Chapter 2, Introduction to LabVIEW, in this guide.
If you would like to explore some other completed demonstrations of
LabVIEW, open the demos.llb library and choose a demonstration
VI. Then, click on the run button to see the VI executing.
©
National Instruments Corporation 1-1 LabVIEW Demonstration Guide
Introduction to LabVIEW
This chapter describes what LabVIEW is, what a Virtual
Instrument (VI) is, how to use the LabVIEW environment (windows,
menus, palettes, and tools), how to operate VIs, how to edit VIs, and
how to create VIs.
Before you start performing any of the objectives in this chapter, you
should click on the Explore LabVIEW for your own applications option
in the LabVIEW Demo VI.
Because LabVIEW is such a feature-rich program development
system, this demonstration guide cannot practically show you how to
solve every possible programming problem. Instead, this
demonstration guide explains the theory behind LabVIEW, contains
exercises to teach you to use the LabVIEW programming tools, and
briefly guides you through practical uses of LabVIEW features as
applied to actual programming tasks.
If you would like more training after using this manual, National
Instruments offers hands-on LabVIEW courses to help you quickly
master LabVIEW and develop successful applications.
The comprehensive LabVIEW Basics course not only teaches you
LabVIEW fundamentals, but also gives you hands-on experience
developing data acquisition (for Windows, Macintosh, and Sun) and
instrument control applications. The follow-up LabVIEW Advanced
course teaches you how to maximize the performance and efficiency of
LabVIEW applications in addition to teaching you the advanced
features of LabVIEW.
For a detailed course catalog and for course fees and dates, refer to the
address page on the inside front cover of this manual for information
about contacting National Instruments.
Chapter
1
Chapter 1 Introduction to LabVIEW
LabVIEW Demonstration Guide 1-2
©
National Instruments Corporation
Chapter Information
Each chapter begins with a section like the one that follows, listing the
learning objectives for that chapter.
You Will Learn:
• What LabVIEW is.
• What a Virtual Instrument (VI) is.
• How to use the LabVIEW environment (windows and palettes).
• How to operate VIs.
• How to edit VIs.
• How to create VIs.
What Is LabVIEW?
LabVIEW is a program development application, much like various
commercial C or BASIC development systems, or National
Instruments LabWindows. However, LabVIEW is different from those
applications in one important respect. Other programming systems use
text-based languages to create lines of code, while LabVIEW uses a
graphical programming language, G, to create programs in block
diagram form.
You can use LabVIEW with little programming experience. LabVIEW
uses terminology, icons, and ideas familiar to scientists and engineers
and relies on graphical symbols rather than textual language to describe
programming actions.
LabVIEW has extensive libraries of functions and subroutines for most
programming tasks. For Windows, Macintosh, and Sun, LabVIEW
contains application specific libraries for data acquisition and VXI
instrument control. LabVIEW also contains application-specific
libraries for GPIB and serial instrument control, data analysis, data
presentation, and data storage. LabVIEW includes conventional
program development tools, so you can set breakpoints, animate
program execution to see how data passes through the program, and
single-step through the program to make debugging and program
development easier.
Chapter 1 Introduction to LabVIEW
©
National Instruments Corporation 1-3 LabVIEW Demonstration Guide
How Does LabVIEW Work?
LabVIEW includes libraries of functions and development tools
designed specifically for instrument control. For Windows, Macintosh,
and Sun, LabVIEW also contains libraries of functions and
development tools for data acquisition. LabVIEW programs are called
virtual instruments (VIs) because their appearance and operation
imitate actual instruments. However, they are analogous to functions
from conventional language programs. VIs have both an interactive
user interface and a source code equivalent, and accept parameters
from higher-level VIs. The following are descriptions of these three VI
features.
• VIs contain an interactive user interface, which is called the front
panel, because it simulates the panel of a physical instrument. The
front panel can contain knobs, push buttons, graphs, and other
controls and indicators. You input data using a keyboard and
mouse, and then view the results on the computer screen.
• VIs receive instructions from a block diagram, which you
construct in G. The block diagram supplies a pictorial solution to
a programming problem. The block diagram contains the source
code for the VI.
• VIs use a hierarchical and modular structure. You can use them as
top-level programs, or as subprograms within other programs or
subprograms. A VI within another VI is called a subVI. The icon
and connector pane of a VI work like a graphical parameter list so
that other VIs can pass data to it as a subVI.
With these features, LabVIEW promotes and adheres to the concept of
modular programming. You divide an application into a series of tasks,
which you can divide again until a complicated application becomes a
series of simple subtasks. You build a VI to accomplish each subtask
and then combine those VIs on another block diagram to accomplish
the larger task. Finally, your top-level VI contains a collection of
subVIs that represent application functions.
Because you can execute each subVI by itself, apart from the rest of the
application, debugging is much easier. Furthermore, many low-level
subVIs often perform tasks common to several applications, so that you
can develop a specialized set of subVIs suited to applications you can
construct.
Chapter 1 Introduction to LabVIEW
LabVIEW Demonstration Guide 1-4
©
National Instruments Corporation
Tools Palette
LabVIEW uses a floating Tools palette, which you can use to edit and
debug VIs. You use the <Tab> key to tab through the commonly used
tools on the palette. If you have closed the Tools palette, select
Windows»Show Tools Palette to display the palette.The following
Illustration displays the Tools palette.
Operating tool Places Controls and Functions palette
items on the front panel and block
diagram
Positioning tool Positions, resizes, and selects objects
Labeling tool Edits text and creates free labels
Wiring tool Wires objects together in the block
diagram
Object pop-up menu tool Brings up on a pop-up menu for an
object
Scroll tool Scrolls through the window without
using the scrollbars
Breakpoint tool Sets breakpoints on VIs, functions,
loops, sequences, and cases
Probe tool Creates probes on wires
Chapter 1 Introduction to LabVIEW
©
National Instruments Corporation 1-5 LabVIEW Demonstration Guide
Color copy tool Copies colors for pasting with the
Color tool
Color tool Sets foreground and background
colors
Controls Palette
The Controls palette consists of a graphical, floating palette that
automatically opens when you launch LabVIEW. You use this palette
to place controls and indicators on the front panel of a VI. Each
top-level icon contains subpalettes. If the Controls palette is not
visible, you can open the palette by selecting Windows»Show Controls
Palette from the front panel menu. You can also pop up on an open area
in the front panel to access a temporary copy of the Controls palette.
The following illustration displays the top-level of the Controls
palette.
Chapter 1 Introduction to LabVIEW
LabVIEW Demonstration Guide 1-6
©
National Instruments Corporation
Controls and Indicators
Numeric Controls and Indicators
You use numeric controls to enter numeric quantities, while numeric
indicators display numeric quantities. The two most commonly used
numeric objects are the digital control and the digital indicator.
Boolean Controls and Indicators
You use Boolean controls and indicators for entering and displaying
Boolean (True/False) values. Boolean objects simulate switches,
buttons, and LEDs. The most commonly used Boolean objects are the
vertical switch and the round LED.
Configuring Controls and Indicators
You can configure nearly all the controls and indicators using options
from their pop-up menus. Popping up on individual components of
controls and indicators displays menus for customizing those
components. An easy way to access the pop-up menu is to click the
Object pop-up menu tool, shown at left, on any object that has a
Label
Increment Buttons
Digital Control
Digital Indicator
Label
Chapter 1 Introduction to LabVIEW
©
National Instruments Corporation 1-7 LabVIEW Demonstration Guide
pop-up menu. The following picture illustrates this display method for
a digital control.
Functions Palette
The Functions palette consists of a graphical, floating palette that
automatically opens when you switch to the block diagram. You use
this palette to place nodes (constants, indicators, VIs, and so on) on the
block diagram of a VI. Each top-level icon contains subpalettes. If the
Functions palette is not visible, you can select Windows»Show
Functions Palette from the block diagram menu to display it. You can
also pop up on an open area in the block diagram to access a temporary
Pop up on the label for
its pop-up menu Pop up on the digital display
for its pop-up menu
Chapter 1 Introduction to LabVIEW
LabVIEW Demonstration Guide 1-8
©
National Instruments Corporation
copy of the Functions palette. The following illustration displays the
top-level of the Functions palette.
Building a VI
OBJECTIVE To build a VI that simulates acquisition of a temperature reading.
Make sure you have clicked on the Explore LabVIEW for your own
applications option in the LabVIEW Demo VI before you start this
exercise.
You will use the Demo Voltage Read VI to measure the voltage, and
then multiply the reading by 100.0 to convert the voltage into a
temperature (in degrees F).
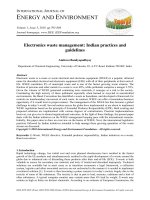
Imagine that you have a transducer or sensor that converts temperature
to voltage.
(Windows, Macintosh, and Sun)
The sensor connects to an
analog-to-digital converter (A/D) board, as shown in the following
illustration, which converts voltage to digital data.
Chapter 1 Introduction to LabVIEW
©
National Instruments Corporation 1-9 LabVIEW Demonstration Guide
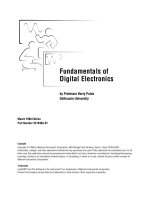
(HP-UX)
The sensor could also be connected to an analog-to-digital
converter that is connected to the computer through GPIB, as shown in
the following illustration. This also converts voltage to digital data.
PC
A/D Board
Sensor
HP Workstation
GPIB
Board
GPIB-based
ADC
Sensor
hp
Chapter 1 Introduction to LabVIEW
LabVIEW Demonstration Guide 1-10
©
National Instruments Corporation
Front Panel
1. Open a new front panel by selecting File»New or choosing the
New VI button in the dialog box. For Windows and UNIX, if you
have closed all VIs, select New VI from the LabVIEW dialog box.
Note: If the Controls palette is not visible, select Windows»Show Controls
Palette to display the palette. You can also access the Controls palette by
popping up in an open area of the front panel. To pop up, right-click on
your mouse (<command>-click on Macintosh).
2. Select a Thermometer indicator from Controls»Numeric, and
place it on the front panel by dragging the indicator on to the panel.
3. Type Temp inside the label text box and click on the enter button
on the toolbar.
Note: If you click outside the text box without entering text, the label disappears.
You can show the label again by popping up on the control and selecting
Show»Label.
4. Rescale the thermometer control to display the temperature
between 0.0 and 100.0.
a. Using the Labeling tool, double-click on 10.0 in thermometer
scale to highlight it.
b. Type 100.0 in the scale and click the mouse button anywhere
outside the display window. LabVIEW automatically scales
the intermediary increments.The temperature control should
now look like the following illustration.
Chapter 1 Introduction to LabVIEW
©
National Instruments Corporation 1-11 LabVIEW Demonstration Guide
Block Diagram
1. Open the block diagram by choosing Windows»Show Diagram.
Select the block diagram objects discussed below from the
Functions palette. For each object that you want to insert, select
the icon and then the object from the top-level of the palette, or
choose the object from the appropriate subpalette. When you
position the mouse on the block diagram, LabVIEW displays an
outline of the object.
Note: If the Functions palette is not visible, select Windows»Show Functions
Palette to display the palette. You can also access the Functions palette by
popping up in an open area of the block diagram.
Place each of the following objects on the block diagram.
The Demo Voltage Read VI (Functions»Tutorial) simulates reading a
voltage from a plug-in data acquisition board.
Multiply function (Functions»Numeric). In this exercise, the function
multiplies the voltage returned by the Demo Voltage Read VI by 100.0.
Numeric Constant (Functions»Numeric). You need two numeric
constants: one for the scaling factor of 100 and one for the device
constant. For the first numeric constant, type 100.0 when the constant
first appears on the block diagram.
2. Create the second numeric constant using a shortcut to
automatically create and wire the constant to the Demo Voltage
Read VI.
a. Using the Wiring tool, pop up on the input marked Board ID
on the Demo Voltage Read VI and select Create Constant
from the pop-up menu. This option automatically creates a
numeric constant and wires it to the Demo Voltage Read VI.
b. Type 1 when the constant first appears on the block diagram.
This changes the default value of zero to one.
Note: You do not have to change to the Labeling tool to insert the value when
using this feature, because the cursor is already in place.
c. Pop up on the constant and choose Show»Label. Using the
Labeling tool, change the default label (Board ID) to
Device.
Chapter 1 Introduction to LabVIEW
LabVIEW Demonstration Guide 1-12
©
National Instruments Corporation
In this example, the two numerics represent the constant 100.0 and the
device for the multiply function.
3. Place a String Constant (Functions»String) on your block
diagram.
4. Using the Wiring tool, pop up on the input marked Channel, at
the bottom left of the Demo Voltage Read VI and select Create
Constant from the pop-up menu. This option automatically creates
a string constant and wires it to the Demo Voltage Read VI.
5. Type 0 when the constant first appears on the block diagram. Pop
up on the constant and choose Show»Label. Notice that in this
instance, Channel appears in the default label so you do not have
to change the label.
In this example, you use the string constant to represent the channel
number.
Note: You can create and wire controls, constants and indicators with most
functions. If these options are not available for a particular function, the
Create Control, Create Constant and Create Indicator options are
disabled on the pop-up menu. For more information on this feature, see
the Create & Wire Controls, Constants, and Indicators section later in this
chapter.
You should have pulled down all of the objects shown in the following
illustration on to your block diagram.
6. Using the Wiring tool, wire the remaining objects together as
explained in the Wiring Techniques section later in this chapter.
Chapter 1 Introduction to LabVIEW
©
National Instruments Corporation 1-13 LabVIEW Demonstration Guide
Note: To move objects around on the block diagram, click on the Positioning
tool in the Tools palette.
LabVIEW color keys wires to the kind of data each wire carries. Blue
wires carry integers, orange wires carry floating-point numbers, green
wires carry Booleans, and pink wires carry strings.
You can activate the Help window by choosing Help»Show Help.
Placing any of the editing tools on a node displays the inputs and
outputs of that function in the Help window. As you pass an editing
tool over the VI icon, LabVIEW highlights the wiring terminals in both
the block diagram and the Help window. When you begin to wire your
own diagrams, this flashing highlight can help you to connect your
inputs and outputs to the proper terminals.
The Demo Voltage Read VI simulates reading the voltage at Channel
0 of a plug-in board providing artificial data to the Measured Voltage
output. This data represents the real temperature divided by 100. The
VI then multiplies the voltage by 100.0 to convert it to a temperature
in °F.
Blue wire (integer)
Orange wire (floating-point numbers)
Pink wire (string)