BUILDING A TOOL TO SIMULATE SOLAR CELLS AND PHOTOVOLTAICS ARRAY WITHIN SINGLE-DIODE MODEL
Bạn đang xem bản rút gọn của tài liệu. Xem và tải ngay bản đầy đủ của tài liệu tại đây (1.43 MB, 8 trang )
<span class='text_page_counter'>(1)</span><div class='page_container' data-page=1>
<b>BUILDING A TOOL TO SIMULATE SOLAR CELLS </b>
<b>AND PHOTOVOLTAICS ARRAY WITHIN SINGLE-DIODE MODEL </b>
BUILDING A TOOL TO SIMULATE SOLAR CELLS AND PHOTOVOLTAICS ARRAY
WITHIN SINGLE-DIODE MODEL
<b>Pham Anh Tuan</b>
Electric Power University
Ngày nhận bài: 28/8/2018, Ngày chấp nhận đăng: 20/12/2018, Phản biện: TS. Nguyễn Quang Ninh
<b>Abstract: </b>
In this research, we study and develop a tool for simulation of a Solar Cell (SC) and a Photovoltaics
array (PV-Array) under MATLAB/GUI. The SC and PV-Array are modeled as a single-diode model at
different values of ideality factor. The characteristic of the current equations of SC and PV-Array are
solved by the iterative Newton-Rapson algorithms. This algorithm is used to build a simulation tool
under MATLAB/GUI environment. Some basic simulation characteristic curves of the SC and PV-Array
such as current-voltage (I-V) and power-voltage (P-V) obtained were in good agreement with the
corresponding experimental data of solar cells reported in some previous works. The simulation tool
was also used to investigate some kind of SC and PV-Array at different factors of temperature,
solar-irradiation, series resistance (Rs) or shunt resistance (Rsh).
<b>Keywords: </b>
Solar Cell, PV Array, Solar cell and PV Array modeling, Solar cell and PV Array simulation.
<b>Tóm tắt: </b>
Trong bài báo này, chúng tôi nghiên cứu và phát triển công cụ phần mềm để mơ phỏng đặc tính của
pin mặt trời (tế bào pin và dàn pin) trong môi trường MATLAB/GUI. Pin mặt trời được mơ hình hố
theo sơ đồ thay thế 1-diode với các thông số đầu vào khác nhau. Phương trình đặc tính mơ tả quan
hệ dịng và áp của pin mặt trời được giải bằng phương pháp lặp Newton-Rapson. Thuật toán lặp
được phát triển thành công cụ mô phỏng trên nền MATLAB/GUI. Công cụ này được dùng để mơ
phỏng lại một số đặc tính cơ bản của pin mặt trời đã được công bố như đặc tính dịng điện - điện áp
(I-V) và đặc tính cơng suất-điện áp (P-V) và cho kết quả phù hợp. Các đường đặc tính khác khi thay
đổi nhiệt độ, cường độ bức xạ, điện trở nối tiếp (Rs) và điện trở song song (Rsh). cũng được mô
phỏng.
<b>Từ khóa: </b>
Tế bào pin mặt trời, dàn pin mặt trời, mơ hình pin mặt trời, mơ phỏng pin mặt trời, MATLAB/GUI.
<b>1. INTRODUCTION </b>
Electric energy is required for the large
number of things from home to cars to
companies. The traditional electric energy
got from coal, natural gas, nuclear energy,
</div>
<span class='text_page_counter'>(2)</span><div class='page_container' data-page=2>
throughout the year. The electricity output
from solar cell is greatly depending on the
weather conditions and fluctuating in
nature.
In order to exploit this energy efficiently,
it is necessary to study the operation of
solar cells under the influence of the
environment. There are some tools, which
are used to simulate SC and P- array such
as: the solar cell block and the PV array
block in the library of MATLAB [1,2].
There also are some studies on the
Maximum Power Point Tracking for SC
or PV-Array system to optimize their
operations [3-5].
In this study, we have modeled a solar
cell and programmed to building a tool
within this model to simulate the
characteristics of SC and PV-Array. After
that, this tool is used to investigating the
effect of temperature, intensity of solar
radiation on performance of the solar cell
and comparing the simulated results with
the measured results in practice.
<b>2. SINGLE-DIODE MODEL OF SOLAR </b>
<b>CELL AND THE SOLVING ALGORITHM </b>
<i><b>Single-diode model of solar cell </b></i>
A formal solar cell consists of
semiconductor
junctions that formelectron–hole pairs when bombarded by
photons. This structure creates an energy
source liked a diode that generates, rather
than consumes, power. The steady-state
characteristics of the SC can be modeled
<i>as a current source (IL), diode, and shunt </i>
<i>resistance (Rsh) when operated under even </i>
distribution of light. The equivalent
circuit of a formal SC can then be
expressed by Figure 1 [4-7].
<b>Fig. 1. The equivalent circuit of solar cell </b>
The relationship between the current (I)
<i>and the voltage (V) as follows: </i>
𝐼 = 𝐼<sub>𝑝ℎ</sub> − 𝐼<sub>0</sub>. [𝑒𝑉+𝐼.𝑅𝑠𝑉𝑇 <sub>− 1 ] −</sub>𝑉+𝐼.𝑅𝑠
𝑅𝑠ℎ (1)
<i>where: Iph is Photon current; I</i>0 is the cell
<i>saturation of dark current [A]; V is the cell </i>
<i>output voltage [V]; Rs</i> is series resistance;
<i>Rsh</i> is parallel resistance.
<i>The thermal voltage VT can be calculated </i>
by equation:
𝑉<sub>𝑇</sub> = 𝐴.𝑘.𝑇<sub>𝑞</sub> (2)
<i>Where: q=1.610</i>-19C is the electron
<i>charge, k=1.3810</i>-23 J/K is the Boltzmann
<i>constant, A is the ideal factor of the p-n </i>
junction, <i>T </i> is the cell operating
temperature [K], which can be calculated
as shown in following equation:
𝑇 = 𝑇𝑎+𝑇𝑛𝑜𝑐𝑡<sub>800</sub>−20. 𝐺 (3)
<i>where Tnoct</i> is nominal operating cell
temperature [K] given by the PV module
<i>manufacturer, G is solar irradiance [W/m</i>2],
<i>and Ta</i> is ambient temperature [K].
<i><b>Newton-Rapson’s algorithm </b></i>
</div>
<span class='text_page_counter'>(3)</span><div class='page_container' data-page=3>
Newton-Rapson’s method:
𝐼𝑘 = 𝐼𝑘−1−<sub>𝑓</sub>𝑓(𝐼′<sub>(𝐼</sub>𝑘−1)
𝑘−1) (4)
<i>where: Ik is the current value at after k </i>
<i>time iterations step; Ik-1 </i> is the current
<i>value current value at after (k-1) time </i>
<i>iterations step. f’ is derivative of f, which </i>
is derived from below expressions.
The solving equations for 1 cell as
<i>following (in which Iph</i> is replaced by
<i>short circuit current (Isc</i>):
𝑓(𝐼) =
𝐼 (1 + 𝑅𝑠
𝑅𝑠ℎ) − 𝐼𝑠𝑐+ 𝐼0. (𝑒
𝑞.(𝑉+𝐼.𝑅𝑠)
𝐴.𝑘.𝑇 − 1) +
𝑉
𝑅𝑠ℎ
(5)
𝑓′<sub>(𝐼) =</sub>𝜕𝑓(𝐼)
𝜕𝐼
(6.a)
𝑓′<sub>(𝐼) = (1 +</sub> 𝑅𝑠
𝑅𝑠ℎ) +
𝑞.𝑅𝑠
𝐴.𝑘.𝑇. 𝐼0. 𝑒
𝑞.(𝑉+𝐼.𝑅𝑠)
𝐴.𝑘.𝑇
<sub> </sub>
(6.b)
<b>Fig. 2. The equivalent circuit of PV-array </b>
<i>When a PV-array consists of Ns</i> solar cell
<i>are connected in series (a string) and Np</i>
string are connected in parallel, the
equivalent model of PV-Array is shown in
Figure 2.
The parameters of equivalent circuit of
PV-Array such as photon current, diode
current, series resistance, parallel
resistance, should be:
𝐼<sub>𝑝ℎ,𝑝𝑣</sub> = 𝑁<sub>𝑝</sub>. 𝐼<sub>𝑝ℎ</sub><i> </i>
𝐼<sub>𝑑,𝑝𝑣</sub>= 𝑁<sub>𝑝</sub>. 𝐼<sub>𝑑</sub>
𝐼<sub>𝑜,𝑝𝑣</sub>= 𝑁<sub>𝑝</sub>. 𝐼<sub>𝑜</sub>
𝑉𝑝𝑣 = 𝑁𝑠<i>. 𝑉 </i>
𝑅𝑠,𝑝𝑣= <sub>𝑁</sub>𝑁𝑠
𝑝. 𝑅𝑠<i> </i>
𝑅<sub>𝑠ℎ,𝑝𝑣</sub> = 𝑁𝑠
𝑁𝑝. 𝑅𝑠ℎ <i> (7) </i>
The solving equation for PV-Array as
following:
𝑓(𝐼) = 𝐼 (1 + 𝑅𝑠,𝑝𝑣
𝑅𝑠ℎ,𝑝𝑣) − 𝐼𝑠𝑐,𝑝𝑣+
𝐼<sub>0,𝑝𝑣</sub>. (𝑒𝑞.(𝑉𝑝𝑣+𝐼.𝑅𝑠,𝑝𝑣)𝐴.𝑘.𝑇 − 1) + 𝑉𝑝𝑣
𝑅𝑠ℎ,𝑝𝑣
(8)
𝑓′<sub>(𝐼) =</sub>𝜕𝑓(𝐼)
𝜕𝐼
(9.a)
𝑓′<sub>(𝐼) =</sub>
(1 + 𝑅𝑠,𝑝𝑣
𝑅𝑠ℎ,𝑝𝑣) +
𝑞.𝑅𝑠,𝑝𝑣
𝐴.𝑘.𝑇 . 𝐼0,𝑝𝑣. 𝑒
𝑞.(𝑉𝑝𝑣+𝐼.𝑅𝑠,𝑝𝑣)
𝐴.𝑘.𝑇
<sub> </sub>
(9.b)
The function of current can be expressed
<i>as when V=0, I=Isc</i>; so that the initial
<i>value should be I= Isc</i>.
When the voltage and current values are
obtained through equation (1), the power
of the solar cell is calculated by following
equation:
𝑃 = 𝑉. 𝐼 (10)
<b>3. BUIDING SC AND PV-ARRAY </b>
<b>SIMULATION TOOL UNDER MATLAB/ </b>
<b>GUI </b>
</div>
<span class='text_page_counter'>(4)</span><div class='page_container' data-page=4>
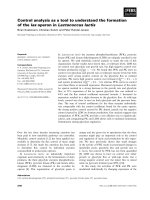
<b>Fig. 3. Flowchart of the proposed iteration </b>
<b>Newton-Rapson’s algorithm for I-V curve </b>
Figure 3 shows the flowchart of the
iteration algorithm to solve I-V
characteristic of SC and PV-Array by
Newton-Rapson’s method. After
calculating I-V characteristics, the P-V
characteristic can be obtained by equation
(10). The MATLAB/GUI framework has
been used to program for building a SC and
<i><b>PV-Array simulation tool in this model. </b></i>
Figure 4 shows the main windows of SC
and PV-Array simulation tool. The left
window shows the input data of SC and
PV-Array. The user could input data of
simulated SC and PV-Array in both ways
of manually-input via edit-box or
prepared-input via list-box which
included some SCs or PV-Arrays. The
data of SCs and PV-Arrays in the list-box
were prepared in an excel file, which was
attached in the simulation package and the
user can also modify. To confirm the
achieve characteristics of simulation tool
similar to real experimental curves of SC
and PV-Array, some extra input data
should be considered: the cell temperature
coefficient, environment temperature,
solar radiation, etc. The right window
shows I-V and P-V curves of SC and
PV-Array, which is plotted by simulation tool.
The output data of simulation tool also
can be exported to excel file to plot by
others scientific software such as Igor or
Origin, etc.
</div>
<span class='text_page_counter'>(5)</span><div class='page_container' data-page=5>
<b>4. RESULTS </b>
In order to test the calculation ability and
reliability of the proposed tool, the results
have been compared with some published
actual measured results with the same
parameters. The results show that the
simulation results and actual results
match. Here are comparing characteristics
of the simulation tool and the experiment
characteristics.
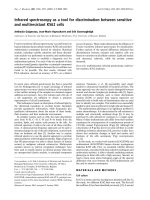
<b>Fig. 5. Compare I-V characteristic of SC from the simulation tool (A) to experiment data (B) [8] </b>
Figure 5 shows the results about I-V
characteristics of the proposed tool (Fig.
5A) comparing to the experiment
characteristics of the CZTS solar cell
(which have conversation efficiency of
12.6%) published by W. Wang et al (Fig.
5B) [8]. The figure shows that the
simulation curve has been in good
agreement with the experiment curve.
Figure 6 shows the result of I-V
characteristics of the simulation (Fig. 6A)
comparing to the experiment
characteristics of the CIGS solar cell
(which have conversation efficiency of
20.1% and 20.3%) published by P.
Jackson, et al. (Fig. 6B) [9]. The deviation
between these curves is negligible.
</div>
<span class='text_page_counter'>(6)</span><div class='page_container' data-page=6>
<b>Fig. 7. Compare I-V characteristics of PV module uder difference radiation of the simulation tool (A) </b>
<b> to experiment data (B) [10] </b>
Figure 7 shows the result of I-V
characteristics of the simulation (Fig. 7A)
at various radiations of 200, 400, 600, 800
and 1000 W/m2 comparing to the testing
characteristics of the silicon solar cell
reported by published by KYOCERA
International Incorporated for module
KC170GT (Fig. 7B) [10]. These
characteristics have been in good
agreement.
Figure 8 shows the simulation result of
1Soltech 1STH-230-P module [11] under
difference environment temperature of
25C, 45C, 65C.
<b>Fig. 8. P-V and I-V characteristics of PV module under difference environment temperature </b>
<b>of 25</b><b>C, 45</b><b>C, 65</b><b>C </b>
<b>5. CONCLUSIONS </b>
Studying the characteristics of solar cells
requires a lot of time and money from
</div>
<span class='text_page_counter'>(7)</span><div class='page_container' data-page=7>
simulate I-V and P-V characteristics of
SC and PV-Array under different input
conditions. The results of the simulation
have been verified by comparison with
the published results of some types of
solar cell such as Silic, CIGS, CZTS. This
tool not only allows to perform the
described functions but also is the basis
for further studies such as: simulating the
PV with diffent kind of configuration,
tracking the maximum power point of the
solar cell and PV array, and optimizing
PV array configuration, etc.
<b>REFERENCES</b>
[1]
www.mathworks.com/examples/simpower/mw/sps_product-power_PVArray_PartialShading-partial-shading-of-a-pv-module, 2018.
[2] www.mathworks.com/help/physmod/elec/ref/solarcell.html, 2018.
[3] C. Liu, J. Chen, Y. Liu, Z. Yang, and I. Technology, “An Asymmetrical Fuzzy-Logic-Control-Based
MPPT Algorithm for Photovoltaic Systems”, Energies, pp. 2177–2193, 2014.
[4] J.A. Jaleel, A. Nasar, and A.R. Omega, “Simulation on Maximum Power Point Tracking of the
Photovoltaic Module / Array Using Lab View”, International Journal of Advanced Research in
Electrical, Electronics and Instrumentation Engineering, pp. 16–17, 2012.
[5] S. Sumathi, L. Ashok Kumar, and P. Surekha, Solar PV and Wind Energy Conversion Systems. 2015.
[6] T. Ahmed, “Single Diode Model Parameters Analysis of Photovoltaic Cell”, international conferrence,
UK, P.20-23, 2016.
[7] V. Tamrakar, S.C. Gupta, and Y. Sawle, “Single - diode pv cell modeling and study of characteristics
of single and two-diode equivalent circuit” , Electrical and Electronics Engineering: An International
Journal (ELELIJ), pp. 13–24, 2015.
[8] W. Wang et al., “Device characteristics of CZTSSe thin-film solar cells with 12.6% efficiency,” Adv.
Energy Mater., vol. 4, no. 7, p. 10301465, 2014.
[9] P. Jackson et al., “New world record efficiency for Cu(In,Ga) Se2 thin-film solar cells beyond 20%”,
Prog. Photovolt: Res. Appl., pp. 894–897, 2011.
[10] “Current-Voltage characteristics of Photovoltaic Module KC170GT at various irradiance levels”,
KYOCERA data sheet, 2017.
[11]
<b>Biography: </b>
Pham Anh Tuan received his MSc in electrical engineering from Hanoi University of
Science and Technology - Vietnam (HUST) in 2006. He became a lecturer at the
Electrical Engineering Faculty of Electric Power University since 2009. He received
his PhD in materials science from HUST in 2017. He was awarded best price from
HUST for the PhD thesis of “Research and fabrication of CIGS and CZTS solar
cells”.
</div>
<span class='text_page_counter'>(8)</span><div class='page_container' data-page=8>
<b>Số 18 17 </b>
</div>
<!--links-->