Comparative analysis of the bioactive compound, pigment content and antioxidant activity in different parts of Pouzolzia zeylanica plant
Bạn đang xem bản rút gọn của tài liệu. Xem và tải ngay bản đầy đủ của tài liệu tại đây (378.7 KB, 9 trang )
<span class='text_page_counter'>(1)</span><div class='page_container' data-page=1>
<i>DOI: 10.22144/ctu.jen.2019.029 </i>
<b>Comparative analysis of the bioactive compound, pigment content and antioxidant </b>
<i><b>activity in different parts of Pouzolzia zeylanica plant </b></i>
Nguyen Duy Tan1*<sub>, Vo Thi Xuan Tuyen</sub>1<sub> and Nguyen Minh Thuy</sub>2
<i>1<sub>Faculty of Agriculture and Natural Resources, An Giang University, Vietnam </sub></i>
<i>2<sub>College of Agriculture, Can Tho University, Vietnam </sub></i>
<i>*<sub>Correspondence: Nguyen Duy Tan (email: ) </sub></i>
<b>Article info. </b> <b> ABSTRACT </b>
<i>Received 10 Nov 2018 </i>
<i>Revised 16 Mar 2019 </i>
<i>Accepted 30 Jul 2019</i>
<i><b> Plants are a rich source of therapeutically active compounds such as </b></i>
<i>anti-oxidants, antibiotics, pigments, vitamins, organic acids, glycosides, and </i>
<i>other substances of particular importance to human life. The present study </i>
<i>was to analyze and compare the content of bioactive compounds </i>
<i>(anthocy-anin, flavonoid, polyphenol and tannin); pigments (chlorophyll a, </i>
<i>chloro-phyll b, total chlorochloro-phyll and carotenoids); and antioxidant activity in </i>
<i>dif-ferent parts of Pouzolzia zeylanica plant. The antioxidant activities were </i>
<i>evaluated using three methods such as antioxidant ability index, ferrous </i>
<i>reducing ability power, and scavenging capacity </i>
<i>2,2-diphenyl-1-picrylhy-drazyl radical. The results showed that the content of anthocyanin, </i>
<i>flavo-noid, polyphenol and tannin of young shoots was significantly (P0.01) </i>
<i>higher than that of other parts. In constrast, the content of pigments such </i>
<i>as chlorophyll a, chlorophyll b, total chlorophyll and carotenoids of leaves </i>
<i>was higher than that of young shoots, whole plants and stems. Besides, the </i>
<i>antioxidant capacity of young shoots was also higher than that of leaves, </i>
<i>whole plants and stems when performed with three assay methods. It was </i>
<i>a correlation between the content of bioactive compounds and antioxidant </i>
<i>activities of different parts of Pouzolzia zeylanica plant. </i>
<i><b>Keywords </b></i>
<i>Antioxidant activity, bioactive </i>
<i>compounds, leaves, pigments, </i>
<i>stems, whole plants of </i>
<i>Pou-zolzia zeylanica, young shoots </i>
Cited as: Tan, N.D., Tuyen, V.T.X. and Thuy, N.M., 2019. Comparative analysis of the bioactive compound,
<i>pigment content and antioxidant activity in different parts of Pouzolzia zeylanica plant. Can Tho </i>
<i>University Journal of Science. 11(2): 97-105. </i>
<b>1 INTRODUCTION </b>
Plants possess various antioxidants which play an
important role in the prevention of diseases. It is
widely used in many indigenous systems of
medicine for therapeutic purposes and increasingly
becomes popular in modern society as alternatives
to synthetic medicines. Medicinal plant is generally
cheaper, accessible or available and are accepted by
many people because of the belief that they cause
less side effects than some synthetic drugs (Carlson,
2002; Dey and De, 2015).
</div>
<span class='text_page_counter'>(2)</span><div class='page_container' data-page=2>
stomach ailments, diabetes, cancer, preventive
radiation and confirmed the therapeutic value of
polyphenols contained in the leaves (Li, 2006; Yusuf
<i>et al., 2006; Purkayastha et al., 2007; Bhattacharjya </i>
and Borah, 2008; Ratnam and Raju, 2008; Mondal
<i>et al., 2013; Sandhya et al., 2013). </i>
In Vietnam, this plant is popularly cultivated in the
Mekong Delta; it can be used as fresh or dried plant,
decoction drunk to treat cough up phlegm,
pulmonary tuberculosis, sore throat, enteritis,
dysentery, diuretic, anti-inflammation, urinary
infections, galactopoietic, pulmonary disease, etc.
<i>(Vo Van Chi, 2012). In modern medicine, Pouzolzia </i>
<i>zeylanica is also combined with other herbs that </i>
could fight cancer cells, tuberculosis and are good for
lungs (Le Thanh Thuy, 2007).
The reported studies not only identified the structure
and presence of bioactive compounds but also
assessed the antimicrobial, antifungal, antioxidant
<i>properties of Pouzolzia zeylanica plant. However, </i>
the chemical components of this medicinal plant in
different parts have not been studied yet. The aim of
study was to analyze and compare the content of
bioactive compounds (anthocyanin, flavonoid,
polyphenol and tannin), pigments (chlorophyll a,
chlorophyll b, total chlorophyll and carotenoids),
and antioxidant activity (AAI – antioxidant ability
index, FRAP – ferrous reducing ability power and
DPPH – 2,2-diphenyl-1-picrylhydrazyl) of ethanol
extract from different parts (shoot, leaf, stem and
<i>whole plant) of Pouzolzia zeylanica. </i>
<b>2 MATERIALS AND METHODS </b>
<b>2.1 Equipment and chemicals </b>
Equipment used in the study included a
spectrophotometer (SPUVS, model SP-1920,
Japan), vortex lab (VELP Scientifica, Europe),
centrifugal (model EBA 20 Hettich, Germany) and
water bath (Menmert, France).
Chemicals that consisted of folin-cioalteau reagent,
folin-denis reagent, gallic acid, quercetin, tannic
acid, 2,4,6-tri (2-pyridyl)-s-triazine (TPTZ), DPPH
and ferrous sulfate were supplied by Sigma
Chemical Co. (St. Louis, Mo. USA) and Merck
(Darmatadt, Germany). Ferric chloride, aluminum
<b>chloride, sodium carbonate, sodium acetate, glacial </b>
acetic acid, hydrochloric acid and ethanol were
supplied by Analytical Reagent (Xilong Chemical
Co. Ltd., China) and Himedia (Hemidia
Laboratories Pvt. Ltd., India).
<b>2.2 Sample preparation and extraction </b>
<i>Whole plants of Pouzolzia zeylanica were collected </i>
at the stage of three months of age after being
planted from the experimental area of An Giang
University, during June, 2016. The height of plants
was about 30-35 cm. Then, the shoots, stems and
leaves of plants were separated into different parts.
Young shoots were taken from the shoot moristems
with a length of about 5 cm. The remaining plants
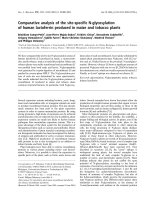
were divided into the leaves and stems (Figure 1).
<i><b>Fig. 1: Whole plants of Pouzolzia zeylanica (a), stems (b), shoots (c) and leaves (d) </b></i>
The samples were cut fine, taking about 5 g of each
plant part to extract with extraction conditions
including the ethanol concentration of 60% (v/v),
ratio of material to solvent of 1/20 (g/mL),
extraction time of 60 minutes and temperature of
60o<i><sub>C (Nguyen Trong Diep et al., 2013; Nguyen Tien </sub></i>
Toan and Nguyen Xuan Duy, 2014). The triangular
flask with cover and thermostatic tank were used in
this research. The extract was filtered using Buchner
funnel with Whatman’s No 1 filter paper. The
filtrate (crude extract) was diluted in ethanol at an
appropriate ratio using for analysis.
<b>2.3 Analytical methods </b>
</div>
<span class='text_page_counter'>(3)</span><div class='page_container' data-page=3>
<i>al., 2005; Ahmed et al., 2013); the result was </i>
expressed in milligrams of cyanidin-3-glucoside
equivalents (CE) per gram of dry weight (DW).
Sample absorbance was read against a blank cell
containing distilled water. The absorbance (A) of
the sample was then calculated according to the
following formula:
A = (A520 – A700) pH1.0 – (A520 – A700) pH4.5
Where A520 and A700 are absorbance of sample in
the two pH buffer solutions (pH1.0 and pH4.5) at the
wavelenght = 520 and 700 nm.
The total anthocyanin content (TAC) in the original
sample was calculated according to the following
formula:
TAC (mg CE/g DW) = <sub> </sub>
Where MW is cyanidin-3-glycoside molecular
weight (449.2 in g/mol); DF is the dilution factor; V
is volume of the obtained extracts (L); is molar
absorptivity (26,900 in L/mol); W is the weight of
material sample (g).
<i>2.3.2 Determination of flavonoid content </i>
Aluminum chloride colorimetric method was used
<i>for flavonoids determination (Eswari et al., 2013; </i>
<i>Mandal et al., 2013). About 1 mL of the crude </i>
extracts/standard of different concentration solution
was mixed with 3 mL of ethanol, 0.2 mL of 10%
aluminum chloride, 0.2 mL of 1 M sodium acetate
and 5.8 mL of distilled water. It remained at room
temperature for 30 minutes. The absorbance of the
reaction mixture was measured at 415 nm with
spectrophotometer against blank. The calibration
curve was prepared by diluting quercetin in ethanol
(y = 0.0054x + 0.0026 and r2<sub> = 0.9995). The total </sub>
flavonoid content (TFC), milligrams of quercetin
equivalents (QE) per gram dry weight (DW), was
calculated by the following formula:
TFC (mg QE/g DW) = .<sub>.</sub> <sub> </sub>
Where A is the absorbance of the test samples; DF
is the dilution factor; V is volume of the obtained
extracts (L); W is the weight of material sample (g).
<i>2.3.3 Determination of polyphenol content </i>
Total polyphenol content was determined by
<i>folin-ciocalteu reagent method (Hossain et al., 2013). </i>
Each crude extract (0.2 mL) was taken in a test tube
and added 10% Folin-Ciocalteu reagent (1.5 mL).
Then all test tubes were kept in a dark place for 5
minutes. Finally, 5% Na2CO3 (1.5 mL) was added to
solution and mixed well in a vortex. Again, all the
test tubes were kept in the dark for 2 hours. The
absorbance was measured for all solution by using
UV-spectrophotometer at constant wavelength of
750 nm. Total polyphenol concentrations were
quantified by calibration curve obtained from
measuring the absorbance of a known concentration
of gallic acid standard in ethanol (y = 0.0082x +
0.0595 and r2<sub> = 0.9996). The total polyphenol </sub>
content (TPC), milligrams of gallic acid equivalents
(GAE) per gram dry weight (DW), was calculated
by the following formula:
TPC (mg GAE/g DW) = .<sub>.</sub> <sub> </sub>
Where A is the absorbance of the test samples; DF
is the dilution factor; V is volume of the obtained
extracts (L); W is the weight of material sample (g).
<i>2.3.4 Determination of tannin content </i>
Tannin content was determined by folin-denis
<i>method (Laitonjam et al., 2013). Each crude extract </i>
(0.5 mL) and distilled water (0.5 mL) were taken in
a test tube. Finally, the samples were treated with
0.5 mL of freshly prepared folin-denis reagent, and
20% sodium carbonate (2 mL) was added, shaken
well, warmed on boiling water-bath for 1 minutes
and cooled to room temperature. Absorbance of the
colored complex was measured at 700 nm. Tannin
concentration was quantified basing on the
calibration curve of tannic acid in ethanol (y =
0.0098x + 0.0478 and r2<sub> = 0.9996). The tannin </sub>
content (TC), milligrams of tannic acid equivalents
(TAE) per gram dry weight (DW), was calculated
by the following formula:
TC (mg TAE/g DW) = .<sub>.</sub> <sub> </sub>
Where A is the absorbance of the test samples; DF
is the dilution factor; V is volume of the obtained
extracts (L); W is the weight of material sample (g).
<i>2.3.5 Determination of AAI </i>
AAI of samples were determined by reducing power
<i>method (Nguyen Thi Minh Tu, 2009; Saha et al., </i>
2013). Two ml of plant extract was mixed with 2.5
ml phosphate buffer (pH 7.4) and 2.5 ml of 1%
aqueous postassium ferriccyanide solution. This
mixture was kept at 50o<sub>C in water bath for 20 </sub>
minutes. After cooling, 2.5 ml of 10%
trichloroacetic acid was added and centifuged at
3,000 rpm for 5 minutes. The supernatant (2.5 ml)
was mixed with distilled water (2.5 ml) and 0.5 ml
of 0.1% freshly prepared ferric chloric solution.
Then the absorbance of solution was measured at
700 nm using a spectrophotometer against blank.
AAI calculated by the following formula:
</div>
<span class='text_page_counter'>(4)</span><div class='page_container' data-page=4>
Where Abs sample is the absorbance of extract; Abs
<b>blank is the absorbance of distilled water </b>
<i>2.3.6 Determination of FRAP </i>
FRAP assessment was performed according to the
<i>method of Adedapo et al. (2009). The stock </i>
solu-tions included 300 mM acetate buffer (pH 3.6), 10
<i>mM TPTZ (2, 4, 6-tripyridyl-s-triazine) solution in </i>
40 mM HCl, and 20 mM FeCl3ꞏ6H2O solution. The
fresh working solution was prepared by mixing 25
ml acetate buffer, 2.5 ml TPTZ, and 2.5 ml
FeCl3ꞏ6H2O. The temperature of the solution was
raised to 37°C before use. Plant extracts (150 µL)
were allowed to react with 2,850 µl of the FRAP
so-lution
for 30 minutes in the dark condition. Readings of the
colored product (ferrous tripyridyltriazine complex)
were taken at 593 nm. The standard curve of FeSO4
was established (y = 0.5177x + 0.0855 and r2<sub> = </sub>
0.9981). Results were expressed in µM FeSO4/g dry
weight (DW).
FRAP (µM FeSO4/g DW) = .<sub>.</sub> <sub> </sub>
Where Abs is the absorbance of sample; V is volume
of the obtained extracts (L); W is the weight of
ma-terial sample (g).
<i>2.3.7 Determination of DPPH radical scavenging </i>
<i>capacity </i>
The scavenging ability of extract against DPPH
<i>rad-ical was determinaed using the method of Aluko et </i>
<i>al. (2014). One millilitre of 0.135 mM of DPPH in </i>
ethanol was mixed with 1 ml of test solution. The
mixture was kept in a dark cupboard for 30 minutes.
The absorbance of the resulting solution was
meas-ured spectrophotometerically at 517 nm and the
scavenging ability of the extract was calculated as:
DPPH radical scavenging activity (%) = [(Abs
con-trol – Abs sample)/Abs concon-trol] x 100
Where Abs control is the absorbance of DPPH
radi-cals + ethanol; Abs sample is the absorbance of
<b>DPPH radical + extract </b>
<i>2.3.8 Determination of pigments content </i>
The content of chlorophyll and carotenoids of
sam-ples were performed according to the method of
<i>Singh et al. (2014). Sample extracts were measured </i>
at 663, 645 and 480 nm wavelengths, with 60%
eth-anol as the blank. The chlorophyll content was
cal-culated by the following formula:
Chlorophyll a (mg/g DW) = [(12.7x A663 – 2.69 x
A645)/(1000 x W)] x V
Chlorophyll b (mg/g DW) = [(22.9 x A645 – 4.68 x
A663)/(1000 x W)] x V
Total chlorophyll (mg/g DW) = [(20.2 x A645 – 8.02
x A663)/(1000 x W)] x V
Carotenoids (mg/g DW) = A480 + (0.114 x A663) –
(0.638 x A645)
Where A is the absorbance of the extract at
respec-tive wavelengths, V is the volume of extract (ml),
and W is the weight of the sample (g)
<b>2.4 Data analysis </b>
<b> All results were presented as means and standard </b>
deviation. A statistical analysis system (Statgraphic
software package, version 16.0) was used to
per-form all statistical analyses. Data were compared by
one-way analysis of variance; the analysis of LSD
was considered significantly different at P0.05.
<b>3 RESULTS AND DISCUSSION </b>
</div>
<span class='text_page_counter'>(5)</span><div class='page_container' data-page=5>
<i><b>Table 1: The content of bioactive compounds in different parts of Pouzolzia zeylanica </b></i>
<b>Different parts </b> <b><sub>(mgCE/g DW) </sub>Anthocyanin </b> <b><sub>(mgQE/g DW) </sub>Flavonoid </b> <b><sub>(mgGAE/g DW) </sub>Polyphenol </b> <b><sub>(mgTAE/g DW) </sub>Tannin </b>
Young shoots 3.12 ± 0.132a <sub>18.72 ± 0.487</sub>a <sub>39.32 ± 1.526</sub>a <sub>29.54 ± 0.568</sub>a
Leaves 2.65 ± 0.059b <sub>17.39 ± 0.165</sub>b <sub>32.47 ± 0.926</sub>b <sub>26.87 ± 0.508</sub>b
Stems 0.89 ± 0.039d <sub>6.68 ± 0.497</sub>d <sub>20.06 ± 0.975</sub>c <sub>20.75 ± 0.941</sub>c
Whole plants 2.06 ± 0.082c <sub>14.88 ± 0.166</sub>c <sub>30.53 ± 1.031</sub>b <sub>26.18 ± 0.722</sub>b
<i>Note: Data represent the means (n=3) and ± standard deviation. Values in each column followed by the same </i>
<i>super-script letters are not significantly different by LSD at P</i><i>0.05. </i>
Phenolic compounds are secondary metabolites and
naturally present in plants. They have great
im-portance for the food and drink products derived
from plants, since these compounds are responsible
<i>for their organoleptic properties (Dvořáková et al., </i>
2007). Anthocyanins are responsible for attractive
colors of flowers, fruits and vegetables as well as
their products (Mazza and Brouillard, 1990). In
ad-dition, anthocyanin also have multiple biological
roles, e.g. antioxidant activity, anti-inflammatory
action, inhibition of blood platelet aggregation and
antimicrobial activity, treatment of diabetic
reti-nopathy and prevention of cholesterol-induced
<i>ath-erosclerosis (Mazza and Miniati, 1993; Wang et al., </i>
<i>1997; Cliford, 2000; Espin et al., 2000). Flavonoids </i>
can have a wide range of biological activities, the
protective role of flavonoids in living systems was
mostly due to their antioxidant potential, which is
related to transfer of reactive oxygen species,
chela-tion of metal catalysts, activachela-tion of antioxidants
en-zymes and inhibition of certain type of oxidases and
<i>colon cancer (Heim et al., 2002; Chidambara </i>
<i>Murthy et al., 2012). Flavonoids also have the </i>
po-tency to stimulate the immune system, induce
pro-tective enzymes in the liver or block damage to
ge-netics materials (Zarina and Tan, 2013). Polypenols
are present in various plants and have been shown
to be good antioxidant in both in vitro and in vivo
studies. It helps reduce the risk for various life
style-related diseases including cancer and cardiovascular
diseases, which have been linked to the formation of
<i>active oxygen species (Yoshida et al., 2000). Tannin </i>
is present in varying concentrations in plants, and
plays important roles in modulating cardiac action
potential repolarization and tumor cell biology (Chu
<i>et al., 2015). </i>
The results in Table 1 showed that the content of
<i>an-thocyanin and flavonoid in whole Pouzolzia </i>
<i>zeylan-ica plant was 2.06±0.082 mg CE/g DW and </i>
14.88±0.166 mg QE/g DW, respectively, and there
was statistically significant difference between parts
of plants such as young shoots, leaves, stems and
whole plants with P0.01. In particular, young
shoots contained the highest anthocyanin and
flavo-noid content, with 3.12±0.132 mg CE/g DW and
18.72±0.487 mg QE/g DW, followed by leaves,
whole plants and stems. Similarly, the highest
con-tent of polyphenol and tannin were recorded in
young shoots, with 39.32±1.526 mg GAE/g DW and
29.54±0.568 mg TAE/g DW, followed by leaves
and whole plants, and there was no statistically
sig-nificant difference between leaves and whole plants
(P0.01). The lowest content of these compounds
<i>was observed in stems. The result of Raya et al. </i>
(2015)’s study also showed that the content of total
<i>phenolic and flavonoid in Clinacanthus nutans were </i>
significantly influenced by plant parts. The content
of these compounds was higher in leaves than that
in stems. Quantification of secondary metabolites in
<i>the root, stem and foliar tissues of Centella asiatica </i>
revealed the presence of various bioactive
com-pounds at varying concentrations. The
concentra-tions of phenols, tannin and flavonoid was higher in
<i>the leaves than that in stems and roots (Vaddadi et </i>
<i>al., 2017). The phenolics content of Moringa </i>
<i>oleif-era plant was higher in leaf than that in stems and </i>
<i>stalks (Shih et al., 2011). Each plant part has </i>
differ-ent contdiffer-ent of chemical substances, for example,
to-tal phenolic content and antioxidant composition of
<i>Urtica dioica L. vary with plant parts (Khare et al., </i>
2012).
</div>
<span class='text_page_counter'>(6)</span><div class='page_container' data-page=6>
which leads to the neutralization of the radical.
Re-ducing power was measured by direct electron
do-nation in the reduction of Fe3+<sub>(CN−)</sub>
6–Fe2+(CN−)6.
The extract was visualized by forming the intense
Prussian blue color complex and then measured at λ
700 nm (Yen and Chen, 1995). In addition, FRAP
assay measures the reducing potential of an
antioxi-dant reacting with a ferric tripyridyltriazine [Fe3+<sub></sub>
-TPTZ] complex and producing a coloured ferrous
tripyridyltriazine [Fe2+<sub>-TPTZ] (Benzie and Strain, </sub>
1996). Generally, the reducing properties are
asso-ciated with the presence of compounds which exert
their action by breaking the free radical chain by
<i>do-nating a hydrogen atom (Duh et al., 1999). FRAP </i>
assay treats the antioxidants in the sample as a
re-ductant in a redox-linked colorimetric reaction (Guo
<i>et al., 2003). The ethanol extracts of different parts </i>
<i>of Pouzolzia zeylanica plant were able to reduce the </i>
unstable radical DPPH to the yellow-colored
diphe-nylpicrylhydrazine. The results of the evaluation of
the antioxidant activity of various plant parts were
presented in Table 2.
<i><b>Table 2: Antioxidant activity and moisture in different parts of Pouzolzia zeylanica </b></i>
<b>Different parts </b> <b>AAI </b> <b>DPPH (%) FRAP (µM FeSO4/g DW) </b> <b>Moisture (%) </b>
Young shoots 5.52 ± 0.172a <sub>88.29 ± 0.942</sub>a <sub>578.10 ± 8.371</sub>a <sub>83.23 ± 0.589</sub>c
Leaves 4.84 ± 0.077b <sub>85.14 ± 1.184</sub>b <sub>529.08 ± 10.101</sub>b <sub>82.67 ± 0.406</sub>c
Stems 3.93 ± 0.111c <sub>58.56 ± 0.799</sub>d <sub>501.20 ± 6.843</sub>c <sub>86.97 ± 0.155</sub>a
Whole plants 4.71 ± 0.060b <sub>78.11 ± 1.264</sub>c <sub>546.11 ± 5.171</sub>b <sub>85.28 ± 0.094</sub>b
<i>Note: Data represent the means (n=3) and ± standard deviation. Values in each column followed by the same </i>
<i>super-script letters are not significantly different by LSD at P</i><i>0.05. </i>
Table 2 showed that ethanol extract of young shoots
had the highest antioxidant activity among the three
tested methods, followed by leaves, whole plants
and stems (AAI method), and followed by whole
plants, leaves and stems (FRAP method), and there
was no statistically significant difference between
leaves and whole plants. While there was
statisti-cally significant difference (P0.01) in various parts
such as young shoots leaves whole plants
stems (DPPH method). The lowest antioxidant
value was found in stems. For example, the young
shoots extract had AAI of 5.52; scavenging 88.29%
free radical of DPPH and 578.10 M FeSO4/g DW.
<i>The study result of Raya et al. (2015) showed that </i>
antioxidant power was higher in young plant than
that in old plant irrespective of plant parts. The
high-est DPPH was observed in young leaves followed
by young stems. The lowest DPPH was recorded
<i>with matured stems. Ethanol extracts of Centella </i>
<i>asiatica root, stem and leaf were tested for their </i>
scavenging activities. Result showed that leaf
<i>ex-tracts have shown high DPPH scavenging activities </i>
compared with those of root and stem extracts
<i>(Vaddadi et al., 2017). The methanolic extract of </i>
Moringa showed strong scavenging effect of DPPH
radicals and reducing power. The trend of
<i>antioxi-dative activity as a function of the part of Moringa </i>
<i>oleiferwas: leaf > stem > stalk for samples </i>
<i><b>investi-gated (Shih et al., 2011). </b></i>
The analysis of the moisture content of different
<i>parts of Pouzolzia zeylanica plant showed that the </i>
highest moisture content was observed in stems,
fol-lowed by whole plants, young shoots and leaves.
There was statistically significant difference
</div>
<span class='text_page_counter'>(7)</span><div class='page_container' data-page=7>
pigments, and they prevented chlorophyll and
thylakoid membrane from the damage of absorbed
<i>energy by peroxidation (Costache et al., 2012; </i>
<i>Su-manta et al., 2014). Analytical result in this study </i>
<i>showed that Pouzolzia zeylanica plant was also </i>
pre-sent chlorophylls and carotenoids pigments (Table
3).
<i><b>Table 3: The content of pigments in different parts of Pouzolzia zeylanica </b></i>
<b>Different parts </b> <b>Chlorophyll a <sub>(mg/g DW) </sub></b> <b>Chlorophyll b <sub>(mg/g DW) </sub></b> <b>Total chlorophyll <sub>(mg/g DW) </sub></b> <b>Carotenoids <sub>(mg/g DW) </sub></b>
Young shoots 2.203 ± 0.073a <sub>1.601 ± 0.066</sub>b <sub>3.802 ± 0.138</sub>b <sub>7.725 ± 0.096</sub>b
Leaves 2.292 ± 0.068a <sub>2.164 ± 0.104</sub>a <sub>4.455 ± 0.038</sub>a <sub>8.152 ± 0.020</sub>a
Stems 0.681 ± 0.015c <sub>0.690 ± 0.029</sub>d <sub>1.371 ± 0.043</sub>d <sub>3.171 ± 0.089</sub>d
Whole plants 1.375 ± 0.062b <sub>1.056 ± 0.048</sub>c <sub>2.430 ± 0.110</sub>c <sub>5.128 ± 0.167</sub>c
<i>Note: Data represent the means (n=3) and ± standard deviation. Values in each column followed by the same </i>
<i>super-script letters are not significantly different by LSD at P</i><i>0.05. </i>
Table 3 showed that the highest content of
chloro-phyll a was observed in leaves, with 2.292±0.068
mg/g DW, followed by young shoots, whole plants
and stems, and there was statistically significant
dif-ference between leaves, whole plants and stems, but
there was no statistically significant difference
be-tween leaves and young shoots. The highest content
chlorophyll b, total chlorophyll and carotenoids
were also recorded in leaves, with 2.164±0.104
mg/g DW, 4.455±0.038 mg/g DW, 8.152±0.020
mg/g DW, respectively, followed by young shoots,
whole plants and stems, there was statistically
sig-nificant difference between these different parts
(P0.01). In the tested samples a ratio between
chlo-rophyll a and chlochlo-rophyll ranged from 0.99 to 1.38,
meaning that chlorophyll a was the main form of
chlorophyll in young shoots, and chlorophyll b was
the main form of chlorophyll in stems. Other
scien-tists also reported that changes in the color and the
content of chlorophylls were related to the genotype
<i>but not to the growing conditions (Bekhradi et al., </i>
2015). The result of the present study was in line
<i>with the reported result of Straumite et al. (2015), in </i>
the stems chlorophyll content was significantly
lower than in leaves. The highest chlorophyll
con-tent was observed in young leaves which contained
72% higher chlorophyll than matured leaves. The
lowest chlorophyll content was found in matured
<i>stems (Raya et al., 2015). The basic pigments of </i>
green plants are chlorophylls, always accompanied
by carotenoids. In part of samples, significantly
higher concentration of carotenoids in stems was
<i>observed (Mentha suaveolens) and significantly </i>
<i>higher content of carotenoids in leaves only in </i>
<i>Men-tha piperita was determined. For other samples, </i>
dif-ferences between the leaves and the stems were not
<i><b>significant (Straumite et al., 2015). </b></i>
<b>4 CONCLUSIONS </b>
The content of bioactive compounds, pigments and
<i>the antioxidant activity of Pouzolzia zeylanica plant </i>
were differently present in various parts of plant.
The quality characteristics of young shoots were
higher than those of leaves, whole plants and stems.
The content of anthocyanin, flavonoid, polyphenol,
tannin, chlorophyll a, chlorophyll b, total
chloro-phyll and carotenoids in young shoots was 3.12 mg
CE/g DW, 18.72 mg QE/g DW, 39.32 mg GAE/g
DW, 29.54 mg TAE/g DW, 2.203 mg/g DW, 1.601
mg/g DW, 3.802 mg/g DW, 7.725 mg/g DW,
re-spectively. This result showed that young shoots of
<i>Pouzolzia zeylanica plants can be used to process </i>
tea. It can be considered as good sources of natural
products that may be employed in the treatment of
the different diseases associated to the oxidative
<b>stress. </b>
<b>REFERENCES </b>
Adedapo, A.A., Jimoh, F.O., Afolayan, A.J. and Masika,
P.J., 2009. Antioxudant properties of the methanol
<i>extracts of the leaves and stems of Celtis africana. </i>
Records of Natural Products, 3(1): 23-31.
Adhikari, B.S. and Babu, M.M., 2008. Floral diversity of
Banganga Wetland, Uttarakhand, India. Check list
4(3): 279-290.
Ahmed, J.K., Salih, H.A.M. and Hadi, A.G., 2013.
Anthocyanin in red beet juice act as scavenger for
heavy metals ions such as lead and cadmium.
International Jouranl of Science and Technology,
2(3): 269-273.
Aluko, B.T., Alli, S.Y.R. and Omoyeni, O.A., 2014.
Phy-tochemical analysis and antioxidant activities of
<i>etha-nolic leaf extract of Brillantaisia patula. World </i>
Jour-nal of Pharmaceutical Research, 3(3): 4914-4924.
Benzie, I.F. and Strain, J.J., 1996. The ferric reducing
ability of plasma (FRAP) as a measure of
‘‘antioxi-dant power’’: the FRAP assay. Analytical
Biochem-istry, 239(1): 70-76.
Bhattacharjya, D.K. and Borah, P.C., 2008. Medicinal
weeds of crop fields and role of women in rural
health and hygiene in Nalbari district, Assam. Indian
Journal of Traditional Knowledge, 7(3): 501-504.
Carlson, T.J.S., 2002. Medical ethnobotanical research
</div>
<span class='text_page_counter'>(8)</span><div class='page_container' data-page=8>
Chen, B.H. and Chen, Y.Y., 1993. Stability of
choloro-phylls and carotenoids in sweet potato leaves during
microwave cooking. Journal of Agricultural and
Food Chemistry, 41(8): 1315-1320.
Chidambara-Murthy, K.N., Kim, J., Vikram, A. and
Patil, B.S., 2012. Differential inhibition of human
colon
cancer cells by structurally similar flavonoids of
cit-rus. Food Chemistry, 132(1): 27-34.
<i>Chu, X., Guo, Y., Xu, B., et al., 2015. Effects of tannic </i>
acid, green tea and red wine on hERG channels
ex-pressed in HEK293 cells. PLoS ONE, 10(12):
e0143797. doi:10.1371/ journal.pone.0143797.
Cliflord, M.N., 2000. Chlorogenic acids and
othercin-namatesnat-nature, occurrence, dietary burden,
absorption and metabolism. Journal of Agricultural
<i>and Food Chemistry, 80(7): 1033-1043. </i>
Costache, M. A., Campeanu, G. and Neata, G., 2012.
Studies concerning the extraction of chlorophyll and
total carotenoids from vegetables. Romanian
<i>Bio-technology Letters, 17(5): 7702-7708. </i>
Deighton, N., Brennan, R., Finn, C. and Davies, H.V.,
2000. Antioxidant properties of domesticated and
wild Rubus species. Journal of the Science of Food
and Agriculture, 80(9): 1307-1313.
Dey, A. and De, J.N., 2015. Neuroprotective therapeutics
from botanicals and phytochemicals against
Hun-tington's disease and related neurodegenerative
dis-orders. Journal of Herbal Medicine, 5(1): 1-19.
Duh, P., Du, P. and Yen, G., 1999. Action of methanolic
extract of mung bean hull as inhibitors of lipid
pe-roxidation and non-lipid oxidative damage. Food and
Chemistry Toxicology, 37(11): 1055-1061.
Dumbrava, D.G., Moldovan, C., Raba, D.N. and Popa,
M.V., 2012. Vitamin C, chlorophylls, carotenoids
<i>and xanthophylls content in some basil (Ocimum </i>
<i>ba-silicum L.) and rosemary (Rosmarinus officinalis L.) </i>
leaves extracts. Journal of Agroalimentary Processes
and Technologies, 18(3): 253-258.
Dvořáková, M., Hulín, P., Karabín, M. and Dostálek, P.,
2007. Determination of polyphenols in beer by
an effective method based on solid-phase extraction
and high performance liquid chromatography
with diode-array detection. Czech Journal of Food
Science, 25(4): 182-188.
Espin, J.C., Soler-Rivas, C., Wichers, H. and
Garcia-Vi-guera, C., 2000. Anthocyanin-based natural
color-ants: a new source of antiradical activity for food
<i>stuff. Journal of Agricultural and Food Chemistry, </i>
48(5): 1588-1592.
Eswari, M.L., Bharathi, R.V. and Jayshree, N., 2013.
Preliminary phytochemical screening and heavy
<i>metal analysis of leaf extracts of Ziziphusoenoplia </i>
(L) Mill. Gard. International Journal of
Pharmaceuti-cal Sciences and Drug Research, 5(1): 38-40.
Ghani, 2003. Medicinal plants of Bangladesh: Chemical
constituents and uses, 2nd<sub> Ed. pp. 104, The Asiatic </sub>
Society of Bangladesh, Dhaka.
Guo, C., Yang, J., Wei, J., Li, Y., Xu, J. and Jiang, Y.,
2003. Antioxidant activities of peel, pulp and seed
fractions as determined by FRAP assay. Nutrition
Research, 23(12): 1719-1726.
Heim, K.E, Tagliaferro and Bobilya, D.J., 2002.
Flavo-noid antioxidants: chemistry, metabolism and
struc-tureactivity relationship. Journal Nutritional
Bio-chemistry, 13(10): 572-584.
Hossain, M.A., Raqmi, K.A.S., Mijizy, Z.H., Weli, A.M.
and Riyami, Q., 2013. Study of total phenol,
flavonoids contents and phytochemical sreening of
various leaves crude extracts of locally grown
<i>Thymus vularis. Asian Pacific Journal of Tropical </i>
Biomedicine, 3(9): 705-710.
Khare, V., Kushwaha, P., Verma, S., Gupta, A.,
Sri-vastava, S. and Rawat, A.K.S., 2012.
<i>Pharmacognos-tic evaluation and antioxidant activity of UrPharmacognos-tica </i>
<i>dio-ica L. Chinese Medicine, 3: 128-135. http:// </i>
dx.doi.org/10.4236/cm.2012.33021.
Laitonjam, W.S., Yumnam, R., Asem, S.D. and
Wangkheirakpam, S.D., 2013. Evaluative and
com-parative study of biochemical, trace elements and
<i>an-tioxidant activity of Phlogacanthus pubinervius T. </i>
<i>Anderson and Phlocanthus jenkincii C.B. Clarke </i>
leaves. Indian Journal of Natural Products and
Re-sources, 4(1): 67-72.
Le Thanh Thuy, 2007. Preliminary test of chemical
<i>components for Pouzolzia zeylanica L. Benn. </i>
Chemical Master Thesis, University of Natural
Science, HCM city (in Vietnamese).
Lee, J., Durst, R.W. and Wrolstad, R.E., 2005.
Determination of total monomeric anthocyanin
pigment content of fruit juices, beverages, natural
colorants, and wines by the pH differential method:
Collaborative study.Journal of AOAC International,
88(5): 1269-1278.
Li, T.S.C., 2006. Taiwanese Native Medicinal Plants,
Phytopharmacology and Therapeutic Values. CRC
Taylor & Francis Group, LLC.
<i>Mandal, S., Patra, A., Samanta, A., et al., 2013. Analysis </i>
<i>of phytochemical profile of Terminalia arjuna bark </i>
extract with antioxidative and antimicrobial
properties. Asian Pacific Journal of Tropical
Biomedicine, 3(12): 960-966.
Mazza, G. and Brouillard, R., 1990. The mechanism of
copigmentation of anthocyanins in aqueous
<i>solu-tions. Phytochemisty, 29(4): 1097-1102. </i>
Mazza, G. and Miniati, E., 1993. Anthocyanins in fruits,
vegetables and grains. Boca Raton, CRC Press.
Mondal, P., Bhuyan, N., Das, S., Kumar, M., Barah, S.
and Mahato, K., 2013. Herbal medicines useful for
the treatment of diabetes in North-East India: A
re-view. International Journal of Pharmacy and
Biologi-cal Sciences, 3(1): 575-589.
</div>
<span class='text_page_counter'>(9)</span><div class='page_container' data-page=9>
Nguyen Tien Toan and Nguyen Xuan Duy, 2014. Effect
of Extracting Conditions on Polyphenol Content and
<i>Antioxidant Activity of Diep Ha Chau (Phyllanthus </i>
<i>amarus) Cultivated in Phu Yen. Journal Science and </i>
Develpment, 12(3): 412-421 (in Vietnamese).
Nguyen Trong Diep, Nguyen Minh Chinh, Nguyen Tung
Linh and Nguyen Thanh Hai, 2013. Study on the
ex-traction of total flavonoids from Flos Chrysanthemi
Indici. Journal Military Medicine, 9: 38-46 (in
Viet-namese).
Pandurangan, P., Sahadeven, M., Sunkar, S. and Dhana,
S.K.N.M., 2018. Comparative analysis of
<i>biochemi-cal compounds of leaf, flower and fruit of couroupita </i>
<i><b>guianensis and synthesis of silver nanoparticles. </b></i>
Pharmacognosy Journal, 10(2): 315-323.
Purkayastha, J., Dutta, M. and Nath, S.C., 2007.
Ethno-medicinal plant from Dibru-Saikhowa biosphere
re-serve, Assam. Indian Journal of Traditional
Knowledge, 6(3): 477-480.
Ratnam, K.V. and Raju, R.R., 2008. Traditional
medi-cine used by the adivasis of Eantern Ghats, andhra
pradesh – for bone fractures. Ethnobotanical leaflets,
12: 19-22.
Raya, K.B., Ahmad, S.H., Farhana, S.F., Mohammad,
M., Tajidin, N.E. and Parvez, A., 2015. Changes in
<i>phytochemical contents in different parts of </i>
<i>Clina-canthus nutans (Burm. f.) lindau due to storage </i>
dura-tion. Bragantia Campinas, 74(4): 445-452.
Saha, A.K., Rahman, M.R., Shahriar, M., Saha, S.K.,
Azad, N.S. and Das, S., 2013. Screening of six
Ayurvedic Medicinal Plant Extracts for Antioxidant
and Cytotoxic Activity. Journal of Pharmacognosy
and Phytochemistry, 2(2): 181-188.
<i>Saha, D. and Paul, S., 2012. Studies on Pouzolzia </i>
<i>zeylanica (L.) Benn. (Family: Urticaceae). Lap </i>
Lambert Academic Publishing, Germany.
Sandhya, S., Venkata, R.K., Vinod, K.R., Swapna, R.
and Asia, B., 2013. Scope of medicinal flora as
ef-fective anti ulcer agents. African Journal of Plant
Science, 7(11): 504-512.
Shih, M.C., Chang, C.M., Kang, S.M. and Tsai, M.L.,
2011. Effect of different parts (leaf, stem and stalk)
and seasons (summer and winter) on the chemical
<i>compositions and antioxidant activity of Moringa </i>
<i>oleifera. International Journal of Molecular Sciences, </i>
12(9): 6077-6088, doi:10.3390/ijms12096077.
Singh, A., Lawrence, K., Prandit, S. and Lawrence, R.S.,
<i>2014. Response of leaves, stems and roots of </i>
<i>With-ania somnifera to copper stress. International Journal </i>
of Plant, Animal, and Environmental Sciences, 4(3):
<b>60-67. </b>
Straumite, E., Kruma, Z. and Galoburda, R., 2015.
Pig-ments in mint leaves and stems. Agronomy
Re-search, 13(4): 1104-1111.
Sumanta, N., Haque, C.I., Nishika, J. and Suprakash, R.,
2014. Spectrophotometric Analysis of Chlorophylls
and Carotenoids from Commonly Grown Fern
Spe-cies by Using Various Extracting Solvents. Research
<i>Journal of Chemical Sciences, 4(9): 63-69. </i>
Vaddadi, S., Agrawal, P., Das, A., Kotagiri, D. and
Kol-luru, V.C., 2017. Antimicrobial and Antioxidant
<i>Ac-tivities in the Root, Stem and Leaf Extracts of </i>
<i>Cen-tella asiatica. Advances in Biotechnology and </i>
Mi-crobiology, 3(4),
doi:10.19080/AIMB.2017.03.555618.
Vo Van Chi, 2012. Dictionary of medicinal plants in
Vi-etnam. Medicine Publishing House, Ha Noi (in
Viet-namese).
Wang, H., Cao, G. and Prior, R., 1997. Oxygen radical
absorbing capacity of anthocyanins. Journal of
<i>Agri-cultural and Food Chemistry, 45(2): 304-309. </i>
Yen, G.C. and Chen, H.Y., 1995. Antioxidant activity of
various tea extracts in relation to their
antimutagenic-ity. Journal of Agriculture and Food Chemistry,
43(1): 27-32.
Yoshida, T., Hatano, T. and Ito, H., 2000. Chemistry and
function of vegetable polyphenols with high
molecu-lar weights. Biofactors, 13(1-4): 121-125.
Yusuf, M., Wahab, M.A., Chowdhury, J.U. and Begum,
J., 2006. Ethno-medico biotanical knowledge from
kaukhali proper and betbunia of rangamati district.
Bangladesh Journal Plant Taxon, 13(1): 55-61.
Zarina, Z. and Tan S.Y., 2013. Determination of
</div>
<!--links-->

![Chemical and functional components in different parts of rough rice (oryza sativa l[1] ) beforeandaftergermination](https://media.store123doc.com/images/document/14/rc/qa/medium_qab1394872940.jpg)