Water Quality of Havsa Stream Basin Creeks (Thrace Region, Turkey)
Bạn đang xem bản rút gọn của tài liệu. Xem và tải ngay bản đầy đủ của tài liệu tại đây (514.4 KB, 11 trang )
<span class='text_page_counter'>(1)</span><div class='page_container' data-page=1>
<b>Water Quality of Havsa Stream Basin Creeks (Thrace Region, Turkey)</b>
Cem TOKATLI1*<sub>, Yasin BAŞTATLI</sub>2
<i>1<sub>Trakya University, Ipsala Vocational School, Department of Laboratory Technology, </sub></i>
<i>İpsala/Edirne, TURKEY</i>
<i>2<sub>Dumlupınar University, Faculty of Science, Department of Biology, Kütahya,</sub></i>
<i>TURKEY</i>
<i>*<sub>Corresponding author: </sub></i>
<b>Abstract</b>
Havsa Stream is located on north – west part of Marmara Region and it is one of the
most important branches of Ergene River. As many aquatic habitat Havsa Stream is also
under effect of an intensive agricultural pressure. In this study, water quality of Süloğlu,
Hasköy, Aşağıova, Havsa, Kuleli and Anadere Creeks that are the significant components of
Havsa Steam Basin were investigated. Water samples were collected in spring season of 2016
and total of 13 water quality parameters (pH, conductivity, TDS, salinity, turbidity, nitrate,
nitrite, phosphate, sulfate, biological oxygen demand, total carbon, total inorganic carbon and
total organic carbon) were investigated. Also Cluster Analysis (CA) was applied to detected
data in order to classify the creeks in terms of pollution levels. According to detected data,
pollution levels of the investigated creeks in parallel to the flow directions as follows; Süloğlu
> Hasköy > Aşağıova > Havsa > Kuleli > Anadere in general. According to the results of CA,
3 statistically significant clusters were formed, which were corresponded to Süloğlu and
Hasköy (Cluster 1) that were located on the upstream; Kuleli, Havsa and Aşağıova (Cluster 2)
that were located on the middlestream; Anadere (Cluster 3) that was located on the
downstream.
</div>
<span class='text_page_counter'>(2)</span><div class='page_container' data-page=2>
<b>1. Introduction</b>
Developments of industry and rapid growth of population cause lots of environmental
problems and they are decreasing the limited usable freshwater potential of the world and
mankind. It is known that lotic ecosystems play an important role as a receiving environment
for many pollutants. Therefore water quality monitoring of these aquatic ecosystems help to
assess the contamination sources of the systems and provide an effective management of these
significant freshwater resources [1 5].
The Meriỗ River with a length of about 500 km is the longest river ecosystem of the
Balkans. The Ergene River, which is known as the chief tributary of Meriỗ River Basin, is
subjected to strong anthropogenic impacts as it passes through plenty of settlement areas,
along industrial enterprises, farms and areas with intensive agriculture. The creeks of Havsa
Stream Basin are one of the most important branches of Ergene River. Intense agricultural
applications and settlement areas located on the basin are known as the main pollution factors
for the Havsa Stream Basin [5 – 7].
The aim of this study was to evaluate the water quality of Havsa Stream Basin creeks
by determining some limnologic parameters including pH, electrical conductivity (EC), total
dissolved solid (TDS), salinity, turbidity, Nitrate nitrogen (NO3), nitrite nitrogen (NO2),
sulphate (SO4), phosphate (PO4), total carbon (TC), total inorganic carbon (TIC), total organic
carbon (TOC) and biological oxygen demand (BOD) and classify the creeks according to
water quality statuses by using Cluster Analysis (CA).
<b>2. Materials and Methods</b>
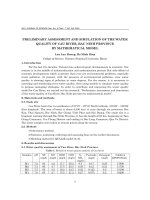
<i>2.1. Study area and collection of samples</i>
The study area and selected stations on the Havsa Stream Basin are given in Figure 1.
Coordinate information, some explanations and the localities of selected stations are given in
Table 1. Water samples (one sample per location) were collected in spring season of 2016.
<b>Table 1. Locatoon properteen ofn eelecpedn epatooe</b>
<b>Station </b>
<b>Number</b> <b>Locality</b> <b>Main Pollution Source</b>[8]
<b>Coordinates</b>
<b>Name of Creek</b>
North South
<b>1. St.</b> Süloğlu District Urban Sewage 41.781437 26.916385 Süloğlu
<b>2. St.</b> Arpaỗ Village Agricultural drainage 41.691578 26.881502 Haskửy
<b>3. St.</b> Havsa District Urban Sewage 41.548334 26.824100 Aşağıova
<b>4. St.</b> Tahal Village Agricultural drainage 41.426217 26.851837 Havsa
<b>5. St.</b> Kuştepe Village Agricultural drainage 41.368404 26.959886 Kuleli
</div>
<span class='text_page_counter'>(3)</span><div class='page_container' data-page=3>
<i>2.2. Physicochemical Analysis</i>
Measurements of pH, electrical conductivity (EC), total dissolved solid (TDS) and
salinity parameters were performed by using Hach branded (HQ40D) Portable Multi –
Parameter Measurement Device and turbidity parameter was performed by using Hach
branded (2100Q) Portable Turbidimeter Device during the field studies. Nitrate nitrogen
(NO3), nitrite nitrogen (NO2), sulphate (SO4), phosphate (PO4), total carbon (TC), total
inorganic carbon (TIC) and total organic carbon (TOC) parameters were performed by using
Hach branded (DR3900) Spectrophotometer Device and biological oxygen demand (BOD)
parameter was performed by using Hach branded (BOD Trak II) BOD Device during the
laboratory studies [9 – 15].
<i>2.3. Statistical Analysis</i>
</div>
<span class='text_page_counter'>(4)</span><div class='page_container' data-page=4>
<b>Figure 1. Havsa Stream and selected stations</b>
<b>3. Result and Discussion</b>
The detected water quality parameters in Havsa Stream Basin creeks and some
national – international limit values are given in Table 1.
Most ecosystems are sensitive to changes in pH and the monitoring of this parameter
has been incorporated into the environmental laws of many industrialized countries. Extreme
changes in pH values in surface water can be indicative of an industrial contamination [17].
Havsa Stream Basin has an alkaline water characteristics in general and pH data in water of
investigated stations were recorded between the values of 8.01 (in Kuleli Creek) – 8.29 (in
Süloğlu Creek). According to the Turkish Regulations, the basin has I. Class water quality in
terms of pH values and any investigated stations did not exceed the drinking water and fish
health limits [18 – 21].
</div>
<span class='text_page_counter'>(5)</span><div class='page_container' data-page=5>
basin has I. Class water quality in terms of EC values and any investigated stations did not
exceed the drinking water limits [18 – 21].
Total Dissolved Solids (TDS), which is defined as the quantity of dissolved material in
water, depends mainly on the solubility of rocks and soils that the water contacts. Also
salinity is defined as the total of all salts dissolved in water. It is known that settlement
sewage wastes and irrigation practices in agricultural applications could raise the levels of
TDS and salinity because of the presence of phosphate and nitrate [5, 22, 23]. The highest
TDS and salinity levels were determined in Anadere Creek as 362 mg/L and 0.36 %0.
Although all the investigated stations have I. Class water quality in terms of TDS values [24],
the recorded TDS and salinity levels in the downstream were significantly higher that detected
in the upstream. Also all the detected TDS levels in all creeks were significantly higher than
the limits reported for the fish health [20].
According to the Water Pollution Control Regulation criteria in Turkey [18], Havsa
Stream Basin creeks have I. Class water quality in terms of nitrate, sulphate and TOC
parameters and nitrate and sulphate concentrations in water of the basin did not exceed the
drinking water limits [19, 21]. But nitrite and phosphate contents in water of Havsa Stream
Basin creeks were recorded in very high levels. Upstream stations have II. – III. Class and
downstream stations have III. – IV. Class water quality in terms of nitrite parameter and the
entire basin has III. – IV. Class water quality in terms of phosphate parameter in general [18,
25]. Also the detected nitrite levels in downstream were significantly higher than the limit
values reported for the fish health [20]. Nitrite is known as an intermediate product in the
biological oxidation process reaching from ammonium to nitrate. It can reach to high
concentrations in especially organically polluted waters. Also organic and inorganic fertilizers
and settlement wastewater discharges are the most important factors on the amount of
phosphate [5, 22, 23].
</div>
<span class='text_page_counter'>(6)</span><div class='page_container' data-page=6>
<b>Table 1. Results of detected parameters and some limit values</b>
<b>Limit Values and</b>
<b>the Results of Present Study</b>
<b>Parameters</b>
<b>pH</b> <sub>(mS/cm)</sub><b>EC</b> <sub>(mg/L)</sub>a<b>TDS</b> <b>Salinity</b><sub>(%</sub>
0)
<b>Tur</b>
(NTU)
<b>NO3</b>
(mg/L)
<b>NO2</b>
(mg/L)
<b>SO4</b>
(mg/L)
b<b><sub>PO</sub></b>
<b>4</b>
(mg/L)
<b>TC</b>
(mg/L)
<b>TIC</b>
(mg/L)
<b>TOC</b>
(mg/L)
<b>BOD</b>
(mg/L)
<b>*Turkish</b>
<b>Regulations</b>
<b>Water Quality</b>
<b>Classes</b>
[18]
<b>I. Class </b>
(Very Clean) 6.5-8.5 400 500 - - 5 0.002 200 0.02 - - 5 4
<b>II. Class </b>
(Less Contaminated) 6.5-8.5 1000 1500 - - 10 0.01 200 0.16 - - 8 8
<b>III. Class </b>
(Much Contaminated) 6.0-9.0 3000 5000 - - 20 0.05 400 0.65 - - 12 20
<b>IV. Class </b>
(Extremely Contaminated)
Out of
6.0-9.0 >3000 >5000 - - >20 >0.05 >400 >0.65 - - >12 >20
<b>Drinking</b>
<b>Water</b>
<b>Standards</b>
<b>TS266 [19]</b> 6.5-9.5 2500 - - 5 50 0.5 250 - - - -
<b>-EC [21]</b> 6.5-9.5 2500 - - - 50 0.5 250 - - - -
<b>-WHO [26]</b> - - - 50 0.2 - - -
<b>-EC Fish Health </b>
<b>Standards [20]</b>
<b>EC/C (Cyprinides)</b> 6-9 25 - - - 0.03 - - - 6
<b>EC/S (Salmonides)</b> 6-9 - 25 - - - 0.01 - - - 3
<b>Havsa</b>
<b>Stream</b>
<b>Basin</b>
<b>Creeks</b>
Süloğlu (1. St.)
8.29
I.
Class
310
I. Class
148
I.
Class 0.15 4.73
0.9
I.
Class
0.004
II.
Class
19
I.
Class
<b>0.75</b>
IV.
Class 23.4 21.1
2.32
I.
Class
<b>27</b>
IV.
Class
Hasköy (2. St.) 8.28I.
Class
315
I. Class
151
I.
Class 0.16 25.8
1
I.
Class
0.006
II.
Class
22
I.
Class
0.13
II.
Class 25.3 22.6
2.72
I.
Class
4.7
II.
Class
Aşağıova (3. St.)
8.27
I.
Class I. Class339
162
I.
Class 0.16 53.5
0.4
I.
Class
0.001
I.
Class
22
I.
Class
<b>0.82</b>
IV.
Class 26.3 22.6
2.72
I.
Class
5.3
II.
Class
Havsa (4. St.) 8.03I.
Class
340
I. Class
163
I.
Class 0.16 54.8
0.8
I.
Class
<b>0.061</b>
IV.
Class
24
I.
Class
<b>0.78</b>
IV.
Class 26.2 25.4
0.763
I.
Class
<b>9.8</b>
III.
Class
Kuleli (5. St.) 8.01I.
Class
364
I. Class
175
I.
Class 0.17 44.6
1.3
I.
Class
<b>0.012</b>
III.
Class
22
I.
Class
<b>0.95</b>
IV.
Class 28.3 27.4
0.954
I.
Class
5.2
II.
Class
Anadere (6. St.)
8.24
I.
Class I. Class742
362
I.
Class 0.36 28.3
1.2
I.
Class
<b>0.042</b>
III.
Class
88
I.
Class
<b>0.3</b>
III.
Class 43 40.2
2.78
I.
Class
4.3
II.
Class
a<sub>Turkish Regulations, 2004 [24]; </sub>b<sub>Uslu and Türkman, 1987 [25]; *III. – IV. Class water qualities are given in bold</sub>
</div>
<span class='text_page_counter'>(7)</span><div class='page_container' data-page=7>
Cluster Analysis (CA) is a significant group of multivariate statistical techniques and it
is widely used in environmental pollution studies in order to classify the investigated areas.
Hierarchical agglomerative clustering that provides intuitive similarity relationships between
any one sample and the entire data set is one of the most common approaches in CA. It is
typically illustrated by a dendrogram in order to provide visual summaries of the clustering
processes [27 – 29].
CA with the paired group algorithm was used was applied to detected data to classify
the creeks according to water quality characteristics. The diagram of CA calculated by using
all the investigated psychochemical data was given in Figure 2. According to the results of
CA, three statistically significant clusters were formed: Cluster 1 (C1) corresponded to
Süloğlu and Hasköy creeks that were located on the upstream; Cluster 2 (C2) corresponded to
Kuleli, Havsa and Aşağıova creeks that were located on the middlestream; Cluster 3 (C3)
corresponded to Anadere creek that was located on the downstream. Maximum similarity was
observed between Aşağıova and Havsa creeks (98%) and minimum similarity was observed
between Süloğlu and Anadere creeks (57%) (Table 2).
<b>Figure 2. Diagram of CA</b>
</div>
<span class='text_page_counter'>(8)</span><div class='page_container' data-page=8>
* <b>Süloğlu</b> <b>Hasköy</b> <b>Aşağıova</b> <b>Havsa</b> <b>Kuleli</b> <b>Anadere</b>
<b>Süloğlu</b> 1
<b>Hasköy</b> 0.95185 1
<b>Aşağıova</b> 0.90135 0.94652 1
<b>Havsa</b> 0.8966 0.93728 <b>0.9897</b> 1
<b>Kuleli</b> 0.87409 0.91789 0.95691 0.95805 1
<b>Anadere</b> <b>0.5762</b> 0.60873 0.62771 0.63011 0.66043 1
*Highest and lowest similarities are given in bold
Havsa Stream is one of the most important branches of Ergene River that is also one of
the most important branches of Meriỗ River. Ergene River is known as a dramatically
contaminated lotic ecosystem and one of the most polluted basin of Turkey [30 34].
According to the Meriỗ Ergene Basin Conservation Action Plan made by Turkish Ministry
of Environment and Forestry, General Directorate of Environmental Management in 2008,
Havsa Stream is being adversely effected by the domestic waste sourced from especially the
settlement areas around the basin, by the industrial waste sourced from especially the
organized industrial zones located on the basin and by the agricultural activities conducted
almost all around the region. In parallel with the literature, the results of this study show that
organic contents of the system are continuous to increase and water quality of the system in
terms of especially nitrogenous and phosphorus compounds is continuous to decrease.
<b>4. Conclusion</b>
In this study, water quality of Havsa Stream Basin creeks were evaluated by
investigating some limnologic parameters. As a result of this study, it can be concluded that
Havsa Stream Basin is under effect of a significant agricultural pollution and this situation
cause to reduce the water quality of the system. In order to provide the sustainability of these
aquatic ecosystems in terms of availability by local people, organic contents including mainly
nitrite and phosphate concentrations of the creeks originated from agricultural applications
must be taken under control by especially a conscious fertilizer application.
<b>5. References</b>
1. Strobl, R. O., Robillard, P. D., 2008. Network design for water quality monitoring of
surface freshwaters: a review. Journal of Environmental Management 87, 639–648.
2. Tokatlı, C., 2013. Use of Statistical Methods in Water Quality Assessment: A Case
</div>
<span class='text_page_counter'>(9)</span><div class='page_container' data-page=9>
3. Tokatl, C., Kửse, E., ầiỗek, A., 2014. Assessment of the Effects of Large Borate
Deposits on Surface Water Quality by Multi Statistical Approaches: A Case Study of
The Seydisuyu Stream (Turkey). Polish Journal of Environmental Studies, 23 (5):
1741-1751.
4. Kửse, E., ầiỗek, A., Uysal, K., Tokatlı, C., Emiroğlu, Ö., Arslan, N., 2015. Heavy
Metal Accumulations in Water, Sediment and Some Cyprinidae Fish Species From
Porsuk Stream (Turkey). Water Environment Research, 87 (3): 195-204.
5. Tokatlı, C., 2015. Assessment of the Water Quality in the Meriỗ River: As an Element
of the Ecosystem in the Thrace Region of Turkey. Polish Journal of Environmental
Studies, 24 (5): 2205-2211.
6. Tokatlı, C., Emirolu, ệ., ầiỗek, A, Kửse, E., Bakurt, S., Aksu, S., Uğurluoğlu, A.,
Şahin, M., Baştatlı, Y., 2016. Investigation of Toxic Metal Bioaccumulations in Fishes
of Meriỗ River Delta (Edirne). Anadolu Unversty Journal of Scıence and Technology
– C Life Sciences and Biotechnology, 5 (1): 1-11.
7. Tokatlı, C., Baştatlı, Y., 2016. Trace and Toxic Element Levels in River Sediments.
Polish Journal of Environmental Studies, 25 (4): 1715-1720.
8. Anonymous, 2008. Turkish Ministry of Environment and Forestry, General
Directorate of Environmental Management, Meriỗ – Ergene Basin Conservation
Action Plan.
9. EN ISO 10304-1. Water quality ”Determination of dissolved anions by liquid
chromatography of ions”: Determination of chloride and nitrate.
10. EN ISO 10304-2. Water quality ”Determination of dissolved anions by liquid
chromatography of ions”: Determination of sulfate.
11. EN ISO 26777. Water quality ”Determination of dissolved anions by liquid
chromatography of ions”: Determination of nitrite.
12. DIN 38405-D5. German standard methods for the examination of water, waste water
and sludge; anions (group D); determination of sulfate (D5).
13. DIN 38406-E6. German standard methods for the examination of water, waste water
and sludge; anions (group E); determination of ammonium (E5).
14. DIN 38405 D9-2. German standard methods for the examination of water, waste water
and sludge; anions (group D); determination of nitrate (D9-2).
</div>
<span class='text_page_counter'>(10)</span><div class='page_container' data-page=10>
16.Kaufman, L., Rousseeuw, P. J., 2009. Finding groups in data: an introduction to
cluster analysis. Wiley Interscience Publishing Group.
17. Ugwu, A. I., Wakawa, R. J., 2012. A study of seasonal physicochemical parameters in
River Usma, American Journal of Environmental Science, 2012, 8 (5): 569-576.
18. Turkish Regulations, 2012. Yüzeysel Su Kalitesi Yönetimi Yönetmeliği, 30 Kasım
2012 tarihli Resmi Gazete, Sayı: 28483, .
19. TS 266, 2005. Sular-nsani tỹketim amaỗl sular. Tỹrk Standartları Enstitüsü, ICS
13.060.20.
20. EC (European Communities), 2006. EC of the European Parliament and of the council
of 6 September 2006 on the quality of fresh waters needing protection or improvement
in order to support fish life. Directive 2006/44.
21. EC (European Communities), 2007. European Communities (drinking water) (no. 2),
Regulatıons 2007, S.I. No. 278 of 2007.
22. Wetzel, R. G. 2001. Limnology: Lake and River Ecosystems. Elsevier Academic
Press, 1006 pages.
23. Manahan, S. E. 2011. Water Chemistry: Green Science and Technology of Nature's
Most Renewable Resource. Taylor & Francis Group, CRC Press, 398 pages.
24. Turkish Regulations, 2004. Yüzeysel Su Kalitesi Yönetimi Yönetmeliği, 31 Aralık
Cuma tarihli Resmi Gazete, Sayı: 25687, .
25. Uslu, O., Türkman, A., 1987. Su Kirliliği ve Kontrolü. T.C. Başbakanlık Çevre Genel
Müdürlüğü Yayınları, Eğitim Dizisi I, Ankara.
26. WHO (World Health Organization), 2011. Guidelines for Drinking-water Quality.
World Health Organization Library Cataloguing-in-Publication Data, NLM
classification: WA 675.
27. Shrestha S., Kazama F., 2007. Assessment of surface water quality using multivariate
statistical techniques: A case study of the Fuji river basin; Japan. Environmental
Modelling & Software, 22, 464475.
28. Tokatl, C., ầiỗek, A., Köse, E., 2013. Groundwater Quality of Türkmen Mountain
(Turkey). Polish Journal of Environmental Studies, 22 (4), 1197-1208.
29. Tabachnick, B. G., Fidell L. S., 1996. Using multivariate statistics (3rd ed.). New
York: Harper Collins College Publishers.
30.Edirne (2005). Edirne İl Çevre Durum Raporu. Edirne Valiliği İl Çevre Ve Orman
</div>
<span class='text_page_counter'>(11)</span><div class='page_container' data-page=11>
31.Tokatlı, C., Köse, E., Uğurluoğlu, A., ầiỗek, A., Emiroğlu, Ö., 2014. Gala Gölü
(Edirne) Su Kalitesinin Coğrafi Bilgi Sistemi (CBS) Kullanılarak Değerlendirilmesi.
Sigma Journal of Engineering and Natural Sciences, 32: 490-501.
32.Arda, H., Helvacolu, . A., Meriỗ, ầ., Tokatl, C., 2015. Investigation on the Heavy
Metal Contents in Irrigation Water of Ipsala District. Journal of Tekirdag Agricultural
Faculty, 12 (3): 1-7.
33.Tokatlı, C., Baştatlı, Y., 2016. Assessment of Toxic Metals in Sediments of Meriỗ,
Tunca and Ergene Rivers by Using Biological and Ecological Risk Indices. Central
Bohemia University International Conference on Innovations in Science and
Education, 23-25 March 2016, Prague, Czech Republic, 770-775.
34.Tokatlı, C., 2017. Bio – Ecological and Statistical Risk Assessment of Toxic Metals in
</div>
<!--links-->
Quality of Service in IP Networks
- 26
- 456
- 0


.push({});</script> </div> </div> </div> <div class="vf_link_relate px-2 my-2"> <h2 class="vf_doc_relate text-2xl font-bold my-4">Tài liệu liên quan</h2> <ul class="grid grid-cols-12 gap-2"> <li class="col-span-6 md:col-span-2"> <div class="card-doc " onclick="actionDocRelated(this)"> <a class="card-doc-img" href="https://text.123docz.net/document/271463-quality-of-service-in-ip-networks.htm" title="Quality of Service in IP Networks"> <i class="icon i_type_doc i_type_doc2"></i> <img class="lazy" src="data:image/gif;base64,R0lGODlhAQABAIAAAP///wAAACH5BAEAAAAALAAAAAABAAEAAAICRAEAOw==" data-src="https://media.store123doc.com/images/document/13/ri/nx/medium_nxy1365221107.jpg" width="124" height="179" alt="Quality of Service in IP Networks" onerror="this.src=)