Optical Properties of Dy 3+ and Ce 3+ in Borate Glass
Bạn đang xem bản rút gọn của tài liệu. Xem và tải ngay bản đầy đủ của tài liệu tại đây (280.83 KB, 11 trang )
<span class='text_page_counter'>(1)</span><div class='page_container' data-page=1>
52
Optical Properties of Dy
3+and Ce
3+in Borate Glass
Tran Ngoc*
<i>Quang Binh University, Vietnam </i>
Received 19 December 2014
<i>Revised 09 February 2015; Accepted 20 March 2015 </i>
<b>Abstract: Spectroscopic properties of Dy</b>3+ and Ce3+ ions doped alkali metal borate glasses
(70-x-y)B2O3.15Li2CO3.15Na2CO3.xDy2O3 and yCeO2 (BLN:Dy,Ce) fabricated by melting method have
been studied. Energy transfer from the absorption and fluorescence center has been discussed.
Judd–Ofelt (J-O) theory has been used to evaluate various spectroscopic properties such as
oscillator strengths (fexp, fcal), intensity parameters Ωλ(λ=2,4,6), spontaneous transition
probabilities (AR), radiative life times (τR) and luminescence branching ratios (σexp, σR). The
cross-relaxation mechanism was discussed for BLN glass.
<i>Keywords:</i> Alkali metal borate glass, Energy transfer, cross-relaxation mechanism.
<b>1. Introduction</b>∗∗∗∗<b> </b>
Glasses doped with rare earth (RE) ions are good laser materials as they emit intense radiations in
the visible (Vis), near-infrared (NIR) and infrared (IR) spectral regions under a suitable excitation
<i>conditions. Due to the unique structural and physico chemical properties, alkali metal borate glasses </i>
doped with RE ions have been widely used as laser materials, optical amplifiers, optical memories,
optoelectronics and magneto-optical devices [10]. The presence of structurally different borate units
<i>in alkali metal borate glasses is favorable for spectroscopic investigations of RE ions. These structural </i>
differences are usually correlated to chemical composition, type of modifiers and conditions during
glass preparation. Low phonon energy glasses doped with Dy3+ ions have been studied for optical
amplifiers and yellow–green upconversion [11] applications. Special interest has been devoted to Dy3+
doped borate glasses with various chemical compositions [6]. Depending upon the host environment,
the Dy3+ ions emit several emission bands between its f–f transitions [1]. The visible luminescence of
the Dy3+ ion mainly consists of yellow band at 570–600 nm corresponding to the 4F9/2
-6
H13/2
hypersensitive transition and the blue band at 470–500 nm corresponding to the 4F9/2
-6
H15/2 transition.
Dysprosium doped glasses and crystals emit intense discrete radiation in the yellow (570–600 nm) and
NIR (1.35 and 3.0 mm) regions that have potential technological applications in commercial displays
_______
∗
</div>
<span class='text_page_counter'>(2)</span><div class='page_container' data-page=2>
and telecommunications [6, 10]. The intensity of the 4F9/2-
6
H13/2 hypersensitive transition strongly
depends on the host, in contrast to a less sensitive 4F9/2
-6
H15/2 transition of Dy
3+
and results in different
yellow to blue luminescence intensity ratios that largely change with concentration and/or glass
composition.
In this works we prepared Dy3+ ions in alkali metal borate glasses and studied their spectroscopic
properties. Judd–Ofelt (J-O) theory [3, 6] has been used to evaluate various spectroscopic properties
such as oscillator strengths (fexp, fcal), intensity parameters Ωλ(λ=2,4,6), spontaneous transition
probabilities (AR), radiative life times (τR) and luminescence branching ratios (σexp, σR). Energy
transfer from the absorption and fluorescence center has been discussed. The cross-relaxation
mechanism is also discussed for BLN glass.
<b>2. Experiment </b>
Alkali metal borate glass (BLN glass) doped RE3+ were prepared by conventional melt quenching
technique. The molar composition of dysprosium doped BLN glasses investigated in this work is
(68-x-y)B2O3-15Li2O-15Na2O-xDy2O3 and yCe2O3. The chemicals were weighed accurately in an
electronic balance mixed thoroughly and ground to a fine powder. The batches were then placed in
quartz cup and melted in an electrical furnace in air at 1323K for 1,5 hours. The melt was then
quenched to room temperature in air by turning of the furnace. The glasses were then annealed at 650
K for 2 hours. The glasses thus obtained were throughout, evenly, no bubble. The samples were
cutting, grinding, polishing blocks rounded product size: thickness d = 0.98 mm, radius r = 6.5 mm
(used for the measurement of refractive index n, density, absorption and fluorescence); crushing and
sorting grab particles range in size from 76 to 150 micron powder products (used for X-ray
diffraction). The glass formation was confirmed by powder X-ray diffraction recorded.
The measurement of the refractive index n is made performed on the system Abbe refractometer at
a wavelength of Nari, 589 nm with C10H7Br (1- bromonaphthalin) used as the liquid in contact. The
density measurements made by Archimede method, using xylene as immersion liquid form. Optical
absorption spectra were recorded in the wavelength regions 200 nm – 2500nm using Varian
spectrometer system cary 5E UV - VIS - NIR, with a resolution of 1nm. Fluorescence spectra were
obtained at room temperature using Flourolog - 3 Model FL3 - 22, resolution of 0.3 nm, excitation
light xenon (Vehicle).
<b>3. Results and discussion </b>
<i>3.1. BLN: Dy3+ glass </i>
<i>1. Absorption spectra and Judd-Ofelt analysis </i>
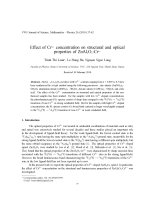
Room temperature absorption spectra of Dy3+<b> doped BLN glasses in the wavelength ranges 300nm </b>
</div>
<span class='text_page_counter'>(3)</span><div class='page_container' data-page=3>
<b>The intensities of absorption bands are measured in terms of experimental oscillator strengths (f</b>exp)
<b>determined from the relative areas under the absorption bands. For J-O analysis, the f</b>exp values of
<b>sevent observed absorption bands at 320, 350, 362, 381, 425, 455 and 470 nm (in the wavelength </b>
<b>range 300nm - 500nm) and six observed absorption bands at 745, 800, 895, 1090, 1270 and 1675 nm </b>
<b>(in the wavelength range 700nm - 1900nm) which are assigned at different transitions from the 6</b>H15/2
<b>ground state to the, </b> 6P3/2,
4
M17/2,
6
P7/2,
4
M19/2,
4
(D,P)3/2,
6
P3/2,
4
F7/2,
4
I13/2 ,
4
G11/2
4
I15/2 ,
4
F9/2 and
6
F3/2,
6
F5/2,
6
F7/2,
6
H7/2,
6
H9/2,
6
F11/2,
6
H11/2<b> excited states, respectively, are taken into account [2,7,9]. Using </b>
the squared reduced matrix elements ||U(λ)||2 <b>and the experimental oscillations (f</b>exp), the calculated
<b>oscillator strengths (f</b>cal<b>) as well as the three J–O intensity parameters Ω</b>λ(λ=2,4,6) are determined by a
<b>least square fit method using the following equation [3,6]: </b>
2
6
,
4
,
2
)
(
2
2
2
'
'
9
)
2
(
1)
3h(2J
8
∑
=
Ω
+
+
=
λ
λ
λ
ψ
ψ
υ
π
<i>J</i>
<i>U</i>
<i>J</i>
<i>n</i>
<i>n</i>
<i>mc</i>
<i>)</i>
<i>J</i>
<i>J,</i>ψ
<i>(</i>ψ
<i>fcal</i> <i>'</i> <i>'</i>
where m is the mass of an electron, c is the speed of light, h is the Plank’s constant, n is the
refractive index of the sample and J is the total angular momentum quantum number. The factor
(2J+1) represents the degeneracy of the ground state, i.e. The terms Sed and Smd are the electric and
magnetic dipole line strengths, respectively. The reduced matrix elements ||U(λ)||2, which are
insensitive to the ion environment, were taken from the literature [2]. Table 1 presents the wavelengths
of absorption bands, experimental and calculated oscillator strengths of the studied glasses.
<b>Table 1. Energy flow of absorption bands and experimental (f</b>exp) and calculated (fcal) oscillator strengths of
Dy3+doped BLN glass.
Transition from 6H15/2 to <i>E</i>exp (cm-1) <i>E</i>quo (cm-1) <i>f</i>exp (×10-6) <i>f</i>cal (×10-6)
6
H11/2 5995 5850 3.21 3.07
6
F11/2,6H9/2 7898 7730 16,54 16,57
6
F9/2,6H7/2 9199 9100 5.97 6,50
300 350 400 450 500
0.6
0.9
1.2
a
BLiNa:Dy3+
2,0%mol
<b>4</b>
<b>F</b>
<b>9/2</b>
<b>4</b>
<b>I</b>
<b>15/2</b>
<b>4</b>
<b>G<sub>11/2</sub></b>
<b>4</b> <b>F</b>
<b>7</b>
<b>/2</b>
;
4 I1
3
/2
4M
1
9
/2
;
(
4P
,
4D
)3/2
<b>6</b>
<b>P<sub>7/2</sub></b>
<b>6</b>
<b>P</b>
<b>5/2</b>
<b>6</b>
<b>P<sub>3/2</sub></b>
<b>4</b>
<b>M<sub>17/2</sub></b>
<b>6</b>
<b>H</b>
<b>15/2</b>
In
te
n
si
ty
(a
.u
)
Wavelenght(nm)
800 1000 1200 1400 1600 1800
0.5
1.0
1.5
2.0 <sub>BLiNa:Dy</sub>3+
,2,0%mol
b
<b>6</b>
<b>H</b>
<b>15/2</b>
<b>6</b>
<b>H<sub>11/2</sub></b>
6
H9/2;
<b>6</b>
<b>F<sub>11/2</sub></b>
6 H
7
/2
;
<b>6</b> <b>F</b>
<b>9</b>
<b>/2</b>
<b>6F</b>
<b>7</b>
<b>/2</b>
;
6H
5
/2
<b>6</b>
<b>F<sub>5/2</sub></b>
<b>6</b>
<b>F<sub>3/2</sub></b>
In
te
n
si
ty
(a
.u
)
Wavelenght (nm)
</div>
<span class='text_page_counter'>(4)</span><div class='page_container' data-page=4>
6
F7/2 11198 11000 4.91 5,15
6
F5/2 12468 12400 3.25 2,36
6
F3/2 13351 13250 0.39 0,48
4
F9/2 21141 21100 0.54 0,39
4
I15/2 22075 22100 1.18 1,04
4
G11/2 23529 23400 0.29 0,21
4
F7/2,4I13/2 25839 25800 4.45 1,91
4
M19/2,4(D,P)3/2,6P3/2 27397 27400 3.90 3,50
6
P7/2 28571 28550 9.12 7,89
6
P3/2,4M17/2 30864 30892 3.14 2,02
rms = 1,09×10⁻⁶
The bonding parameter (δ) depends on the environmentel fied, δ can be received the positive or
negative value indicating covalent or ionic bonding. In our sample, the value of δ bonding parameter
are -1.63, thus in this case the bonding of Dy3+ ions with the local host is ionic bonding [4,10]. The
evaluated JO intensity parameters are compared with those reported for different Dy3+ doped glasses
[7,8,9,11] as presented in Table 2.
Table 2. The JO parameters of Dy3+ ions doped various hosts
Host matrix Ω2(x10-20cm2) Ω4(x10 -20cm2) Ω4x10 -20cm2) Ref.
BLNa: Dy glass 16,28 5,78 5.32 Present
LiLTB: Dy glass 8,75 2,62 2,07 [7]
NLTB: Dy glass 9,25 2,87 2,29 [7]
NLTB: Dy glass 9,86 3,39 2,41 [7]
LB: Dy glass 12,83 3,47 3,43 [8]
PKMAF:Dy glass 7,04 1,73 1,57 [9]
PKBFA:Dy glass 10,41 2,29 2,07 [11]
In the present work, the intensity parameters follow the trend as Ω2 > Ω4 > Ω6 in glasses. In
general, the J-O parameters provide an insight into the local structure and bonding in the
neighbourhood of RE3+ ions. In particular, magnitude of structure/environment parameter Ω2 depends
on covalency of metal ligand bond and also explains the symmetry in the vicinity of RE ion sites. The
Ω2 parameter characterizing the asymmetry of the coordination structure, the polarization of the ligand
and the nature of the link between the Dy3+ ions with other ions (O- , Li ..). The higher magnitude of
Ω2 suggests that the Dy
3+
ion site has lower asymmetry in BLiNa glasses (polarization is large). The
Ω4 parameter is related to the bulk properties and Ω6 is inversely related to the rigidity of host [11,12].
The spectroscopic quality factor X=Ω4/Ω6 (=1,14) is one of the important lasing characteristic
parameters which is used to predict the stimulated emission in any active medium. The Dy3+doped
glass hosts possessing spectroscopic quality factors in the range 0.42–1.92 are the good candidates for
laser active media [11, 13].
<i>2. Excitation spectra. </i>In order to investigate the luminescen ce properties as a function of Dy3+ ion
</div>
<span class='text_page_counter'>(5)</span><div class='page_container' data-page=5>
365; 387; 425; 453 and 475 nm correspond ing to 6H15/2 →
6
P3/2;6P7/2;
4
P3/2;
4
F7/2;
4
G11/2,
4
I15/2 and
4
F9/2, transitions, respectively.It is a well known fact that the wavelength corresponding to the
prominent excitation band can give intense emission . In the present investiga tion, the excitation band
centered at 454 nm is found to be more intense. Thus, the luminescen ce spectra were carried out by
exciting the samples with 454 nm wavelength.
<i>3. Fluorescence spectra and radiation characteristic displacement </i>
Fluorescence spectra measured in the wavelength ranges from 400nm to 750nm of Dy3+ in the
<b>BLN glass at temperature room shown in Fig. 3 </b>
300 400 500
0
1x10⁷
2x10⁷
3x10⁷
6
P<sub>3/2</sub>
4
F9/2
4
I<sub>15/2</sub>
4
G<sub>11/2</sub>
4
I13/2,
4
F7/2
4
P3/2
6
P<sub>7/2</sub>
6
H15/2-->
P
L
I
n
te
n
si
ty
(
a.
u
)
Wavelenght (nm)
<b> </b>
400 500 600 700
0.0
0.5
1.0
1.5
4
F9/2
6
H11/2
4
F9/2
6
H13/2
4
F<sub>9/2</sub> 6
H<sub>15/2</sub>
P
L
i
n
te
n
si
ty
(
a.
u
)
Wavelength (nm)
Fig 2. Excitation spectra of 2.0 mol% of Dy3+doped
BLiNa glasses
<i>Fig 3. PL spectrum of Dy</i>3+<i> in the BLN glass. </i>
It exhibits four emission bands observed at the position 454nm, 478 nm, 585 nm and 668 nm
which are assigned from high-level stimulus 4I15/2→
6
H15/2 and
4
F9/2 →
6
H15/2,
6
H13/2 and
6
H11/2
transitions, respectively [7, 8, 9, 10]. The violet (454 nm) and red (668 nm) emissions are very feeble,
while the blue (478 nm) and yellow (585 nm) emissions are more intense. Emission peak positions
(λp), effective line width (∆λeff<i>), radiative transition probabilities (A), branching ratios (β</i>exp), stimulated
emission cross – section σ(λP) and integrated emission cross – section (Σif) for
4
F9/2 →
6
HJ transitions
of Dy3+<b> displayed in the table 3. </b>
Table 3. Emission peak positions (λp), effective line width (∆λeff), radiative transition probabilities (A),
branching ratios (βexp), stimulated emission cross – section σ(λP) and integrated emission cross – section (Σif) for
4
F9/2 → 6HJ transitions of Dy3+ in BLN glass.
βR (%)
<b>4</b>
<b>F9/2 → </b> λp (nm) ∆λeff (nm) <i>A</i> (s
-1
) σ(λp)
(× 10-22 cm2)
Σif
(× 10-18 cm) exp cal
6
H11/2 662.3 25.9 159 6,5 0.38 4,6 6,59
6
H13/2 574.7 16.4 1620 60,1 2.99 54,8 66,9
6
H15/2 481.4 18.5 448 7,2 0.58 40,6 18,5
</div>
<span class='text_page_counter'>(6)</span><div class='page_container' data-page=6>
<i>The radiative properties such as transition energies (ν), radiative transition probabilities (S</i>ed<i>, S</i>md<i>, A </i>
<i>and A</i>T), radiative lifetime (τR) and branching ratios (βR) for excited levels are evaluated using the
<b>Judd-Ofelt theory, results displayed in the table 4. </b>
<b>Table 4. Transition energies (ν), radiative transition probabilities (S</b>ed, Smd, A and AT), radiative lifetime (τR) and
branching ratios (βR<b>) for excited levels. </b>
Analysis the tables (2 and 3) shows: at a particular yellow to blue (Y/B) intensity ratio of
(6F9/2→
6
H13/2/
6
F9/2→
6
H15/2) emission transitions, the Dy
3+
ions will emit white light. In the present
study, the evaluated (Y/B) ratios are 1,6 for BLN: Dy glasses. Nephelauxetic ratio
β
R and emissioncross section
σ
greatest value to the displacement 4F9/2 →6
H13/2, followed by
4
F9/2 →
6
H15/2.Such
displacement of concern here is 4F9/2 →
6
H13/2 is
β
R andσ
large (60,1×10⁻²²
cm2), the evaluated
emission cross-sections suggest that the BLN:Dy glasses are more useful for the generation of yellow
luminescence [7,11].
<i>4. Cross – Relaxation channels </i>
0 100 200 300
e-3
e-2
e-1
N
o
rm
a
li
ze
d
i
n
te
n
si
ty
(
a.
u
)
0.2
5m
ol%
0.5
.0m
ol%
1.0<sub>m</sub>
ol%
2.0<sub>m</sub>
ol%
5.0<sub>m</sub>
ol%
Time (µs)
<i><b> </b></i>
Fig 4. Decay curves in BLN glasses for different Dy3+ ion concentrations.
<i>SLJ </i> <i>S’L’J’ </i> ν (cm-1) <i>S</i>ed (cm
2
) <i>S</i>md (cm
2
) <i>A</i> (s-1) βR (%)
<b>4</b>
<b>F9/2 </b>
6
F1/2 7,291 4.90E-42 0.00E+00 1.94E-01 8.01E-03
6
F3/2 7,902 4.00E-42 0.00E+00 1.97E-01 8.16E-03
6
F5/2 8,556 2.59E-40 0.00E+00 1.71E+01 7.09E-01
6
F7/2 9,946 1.03E-40 4.00E-41 1.13E+01 4.67E-01
6
H5/2 10,900 6.13E-41 0.00E+00 8.11E+00 3.35E-01
6
H7/2 11,963 2.30E-40 1.76E-41 4.06E+01 1.68E+00
6
F9/2 12,066 1.07E-40 1.59E-41 1.94E+01 8.01E-01
6
F11/2 13,258 2.09E-40 2.26E-42 5.10E+01 2.11E+00
6
H9/2 13,398 1.61E-40 1.65E-40 4.46E+01 1.84E+00
6
H11/2 15,209 4.34E-40 3.13E-41 1.59E+02 6.59E+00
6
H13/2 17,628 2.89E-39 0.00E+00 1.62E+03 6.69E+01
6
H15/2 21,182 4.64E-40 0.00E+00 4.48E+02 1.85E+01
</div>
<span class='text_page_counter'>(7)</span><div class='page_container' data-page=7>
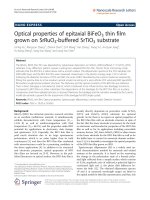
<b>Fig. 4 presents the experimental decay curves obtained for different Dy</b>3+ ion concentrations. The
lifetimes of the 4F9/2<b> level have been determined and were showed in table 5. The decay profiles of </b>
4
F9/2 emission level of Dy
3+
ions in LBZLFB glass containing different concentrations of Dy3+ ions
were recorded under excitation at 350 nm and emission at 577 nm. It is observed that, the decay
profiles are found to be single exponenti al for lower concentrations, i.e., for 0.25 and 0.5 mol% and
for higher concentr ations (1.0, 2.0 and 5.0 mol%) of Dy3+ ions the decay curves deviate towards
non-exponential nature.
Table 5. Variation of lifetime with respect to concentration (%) of Dy3+ ions in BLN glasses
<b>Concentration (%Dy) </b> <b>Lifetime ττττm (µs) </b>
BLN: 0,25 Dy %mol 280
BLN: 0,5 Dy %mol 380
BLN: 1,0 Dy %mol 347
BLN: 2,0 Dy %mol 260
BLN: 5,0 Dy %mol 195
From the decay curves, lifetime (τm) of the
4
F9/2 level has been determined by taking the first
efolding time of the decay intensity. The measured decay time (τm) of the
4
F9/2 emission state is found
<b>to be table 5. The fluorescence lifetime at lower concentr ations is close to the radiative lifetime (τ</b>m);
however as the concentration increases, the lifetime decreases which indicates the presence of
non-radiative energy transfer processes from excited state to neighboring unexcited state of Dy3+ ions. The
discrepancy between the measured and calculated lifetimes is mainly due to energy transfer through
cross-relaxation or multi phonon relaxation or both. The measured lifetime (τm) of an emitting state is
related with the radiative lifetime (τR) and non-radiative decay rates as τm < τR.
20
15
10
5
0
E
n
er
g
y
(
x
1
0
3cm
-1)
<b>4<sub>I</sub></b>
<b>13/2</b>
<b>4<sub>I</sub></b>
<b>15/2</b>
<b>4<sub>F</sub></b>
<b>9/2</b>
<b> </b>
<b> 6<sub>F</sub></b>
<b>3/2 </b>
<b> 6<sub>F</sub></b>
<b>5/2 </b>
<b> 6<sub>F</sub></b>
<b>7/2</b>
<b> 6<sub>H</sub></b>
<b>7/2,6F9/2 </b>
<b> 6<sub>H</sub></b>
<b>11/2, 6F11/2 </b>
<b> 6</b>
<b>F11/2 </b>
<b>6<sub>H</sub></b>
<b>13/2 </b>
<b> 6<sub>H</sub></b>
<b>15/2</b>
Fig.5. Partial energy level diagram showing the energy transfer
cross-relaxation channels of Dy3+ ions in BLN glasses.
<b>4</b>
<b>5</b>
<b>4</b>
<b>n</b>
<b>m</b>
<b>4</b>
<b>7</b>
<b>8</b>
<b>n</b>
<b>m</b>
<b>5</b>
<b>8</b>
<b>5</b>
<b>n</b>
<b>m</b>
<b>6</b>
<b>6</b>
<b>8</b>
<b>n</b>
<b>m</b>
<b>3</b>
<b>5</b>
<b>0</b>
<b>n</b>
<b>m</b>
<b>Dy3+ion</b>
<b>C</b>
<b>R</b>
<b>1</b>
<b>C</b>
<b>R</b>
</div>
<span class='text_page_counter'>(8)</span><div class='page_container' data-page=8>
From the absorption and emission spectra of BLN: Dy3+ glasses, the energy level diagram of Dy3+
<b>in BLN glass and was shown in Fig 5. When Dy</b>3+ ions are excited to the higher levels of the 4F9/2,
there is a fast non-radiative relaxation to this fluorescent level and emission takes place from 4F9/2 level
to its lower levels. The energy transfer process through cross – relaxation (CR) between the pair Dy3+
ions (as shown in Fig.5 leads luminescence quenching. The cross – relaxation channels in BLN glasses
may be estimated to be: 4F9/2+6H15/2→6H5/2 +6H7/2 (CR1) and 4F9/2+6H15/2→6F3/2+6H9/2(CR2) as the
energy difference between these transitions are negligible [11]. The cross-relaxation is due to the
energy transfer from the Dy3+ ion in an excited 4F9/2 state to a near Dy
3+
ion in the ground state 6H15/2
state. This transfer leads the first ion in the intermediate level of 6H9/2 (or
6
F3/2) and the second one in
6
H7/2 (or 6F5/2), which occur in resonance with the 4F9/2 → 6H9/2 (or 4F9/2 → 6H7/2) transition. Then, from
these states, the Dy3+ ions will relax to ground state by non-radiative relaxation. Thus, emission will be
quenched. These cross-relaxation channels are indicated in the partial energy level diagram of Fig.5
by the dotted arrows as CR1 and CR2, respectively [3, 5, 6].
<i>3.2. BLN: Ce3+ glass </i>
<i>1. Absorption spectra:</i> Room temperature absorption spectra of Ce3+<b> doped BLN glasses in the </b>
<b>wavelength ranges 240nm - 400nm are shown in Fig. 6. With intense absorption bands in the UV </b>
region and originate from the ground state 2F5/2 to the various higher states (absorption spectrum is
broad band characteristic for the transition 4f-5d). Unlike other rare earth elements, the optical process
of Ce ion depends greatly on the lattice so the overall network expansion of distance depending crystal
field around Ce3+ ions [1,3].
200 250 300 350 400 450 500
0
2
O
p
ti
ca
l d
en
si
ty
(a
.u
)
Wavelength (nm)
400 500 600
0
40000
80000
120000
405 nm
P
L
i
n
te
n
si
ty
(
a.
u
)
Wavelength(nm)
Fig.6. Absorption spectra of
Ce3+doped BLN glasses.
Fig.7. Fluorescence spectra of
Ce3+doped BLN glasses.
Fig.8. Assignment (D3h
symmetry).
<i>2. Fluorescence spectra</i>: Fluorescence spectra of Ce3+ doped BLN glass were measured in the
</div>
<span class='text_page_counter'>(9)</span><div class='page_container' data-page=9>
transitions have high energies of Ce3+ ion are commonly observed. Figure 8 shows the crystal-field
splitting of both the 4f1 (2F5/2,
2
F7/2) and 5d
1
(2D3/2,
2
D5/2) electronic configurations of Ce
3+
in D3h
symmetry. In the displayed spectrum, the third transition to 2D5/2 is not observed because it lies at too
high energy. Conversely, the Ce3+ luminescence can be tuned from about 300 to 500 nm, depending on
the matrix into which the metal ion is inserted, because of large crystal-field effect on the 5d1 excited
state [1, 3].
<i>3.3. BLN: Dy3+, Ce3+ glass </i>
<i>1. Absorption spectra:</i> Room temperature absorption spectra of Dy3+, Ce
3+
<b> doped BLN glasses in </b>
<b>the wavelength ranges 240nm - 2000nm are shown in Fig.10. Absorption spectrum is the sum of the </b>
absorption of Dy3+ (fig1) and Ce3+ (fig7). Intense absorption bands locate in the UV (240nm - 400nm)
region (absorption of Ce3+<b>). Originate from the ground state to the various higher states (absorption </b>
spectrum is broad band characteristic for the transition 4f1(2F5/2) to the various higher states 5d
1
(2D3/2,
2
D5/2). Unlike other rare earth elements, the optical process of Ce
3+
depends greatly on the matrix so
the overall network expansion of distance depending 4f-5d crystal field around Ce3+ ions [1,3].
The compatibility of the two spectra in the range 400 nm to 2000 nm shows absolutely no Ce3 ions
absorb photons in this region. All the transitions in the absorption spectrum of Dy3+ are
intra-configuration (f-f) transitions and originate from the ground state 6H15/2 to higher energy states (
6
PJ,
4
MJ
4
(D,P)J,
4
FJ,
4
IJ,
4
GJ,
6
FJ and
6
H7/2) [2,7,9].
300 600 900 1200 1500 1800
2
4
Dy
Dy,Ce
?
O
p
ti
ca
l
d
en
si
ty
(
a.
u
)
Wavelength (nm)
900 1200 1500 1800
0.4
0.5
0.6
0.7
400 500 600
0
50000
100000
4
F9/2
-6
H11/2
4
F<sub>9/2</sub>-6H<sub>13/2</sub>
4
F<sub>9/2 </sub>-6H<sub>15/2</sub>
4
f1(
2
F5/2,
2
F7/2
)-5
d1(
2
D3/2,
2
D5/2)
P
L
i
n
te
n
si
ty
(a
.u
)
Wavelength (nm)
Fig 10. Absorption spectra of Dy3+ and Dy3+, Ce3+
doped BLN glasses.
Fig 11. Fluorescence spectra of Dy3+, Ce3+ doped
BLN glasses.
<i><b>2. Fluorescence spectra: Fig.11</b></i> presents the emission spectrum of Dy3+, Ce3+ doped BLN glasses.
Broad band fluorescence (300 nm - 500 nm) with maximum at 405 nm (violet luminescence) that
characterizes for displacement 4f-5d. The 4f–5d transitions have high energies and only those of Ce3+
are commonly observed 4f1(2F5/2,
2
F7/2) and 5d
1
(2D3/2,
2
D5/2) electronic configuration of Ce
3+
</div>
<span class='text_page_counter'>(10)</span><div class='page_container' data-page=10>
Fig.12. Chromaticity diagram of BLN glasses doped with Dy3+, Ce3+ ions.
The emission spectrum of Dy3+ ionsin the wavelength ranges from 400nm to 750nm, It exhibits
four emission bands observed: The violet (454 nm) and red (668 nm) emissions are very feeble, while
the blue (478 nm) and yellow (585nm) emissions are more intense. Among these three transitions, the
4
F9/2→6H15/2 (blue) is magnetic dipole (MD) transition possessing higher intensity, 4F9/2→6H11/2 (red)
possessing lower intensity and 4F9/2→
6
H13/2 (yellow) transition possessing moderate intensity related
to the electric dipole (ED) transition [6,7]. The location of chromaticity coordinates (x= 0,237, y=
<b>0,295) are shown in the inset Fig.12 for the BLN: Dy</b>3+, Ce3+ glasses. From these results it is noticed
that the chromaticity coordinates of BLN glasses doped with Dy3+, Ce3+ ions are located in the white
light region of CIE chromaticity diagram.
<b>4. Conclusion </b>
Dy3+ doped BLN glasses were prepared by melt quenching technique and investigated through the
optical absorption and photoluminescence. Judd–Ofelt theory has been applied to determine the
intensity parameters Ωλ (λ=2,4,6) follow the trend as Ω2>Ω4>Ω6<b> in all the BLN glasses. The Ω</b>2
parameter characterizing the asymmetry of the coordination structure, the polarization of the ligand
and the nature of the link between the Dy3+ ions with other ions (O, Li, Na...). The higher magnitude
of Ω2 suggests that the Dy3+ ion site has lower asymmetry in BLN glasses (polarization is large).
Several radiative and laser characteristic parameters have been evaluated using the J–O intensity
parameters and emission measurements. The luminescence spectra show two intense bands at 478 nm,
585 nm, which are attributed to 4F9/2→
6
H15/2 (blue) and
4
F9/2 →
6
H13/2 (yellow) transitions, respectively.
The cross-relaxation mechanism is also discussed for BLN glass.The cross – relaxation is due to
the energy transfer from the Dy3+ ion in an excited 4F9/2 state to a near Dy
3+
ion in the ground state
6
H15/2 state. This transfer leads the first ion in the intermediate level of 6H9/2 (or 6F3/2) and the second
one in 6H7/2 (or
6
F5/2), which occur in resonance with the
4
F9/2 →
6
H9/2 (or
4
F9/2 →
6
H7/2) transition.
Then, from these states, the Dy3+ ions will relax to ground state by nonradiative relaxation. Thus,
emission will be quenched.
</div>
<span class='text_page_counter'>(11)</span><div class='page_container' data-page=11>
In the absorption spectra of Dy3+ and Ce3+ ions doped BLN glasses, the intense absorption bands
locate in the UV (240nm - 400nm) region absorption of Ce3+ that originate from the ground state to the
various higher states. Absorption bands in the Vis and IR (400nm-2000nm) region ascribe to
absorption of Dy3+. All the transitions in the absorption spectrum of Dy3+ are intra-configurational
(f-f) transitions and originate from the ground state 6H15/2 to higher energy states.
Broad band fluorescence (300nm-500nm) with maximum at 405 nm (violet luminescence)
characterize the displacement 4f-5d. The 4f–5d transitions have high energies and only those of
Ce3+are commonly observed (4f1 (2F5/2,
2
F7/2) and 5d
1
(2D3/2,
2
D5/2) electronic configurations of Ce
3+
in
D3h symmetry.
<b>References </b>
[1] Christane Görller, Walrand and K. Binnemans, Handbook on the Physics and Chemistry of Rare Earths. Vol.25,
pp 101 – 252.
[2] Carnall W.T., Fields P.R., and Rajnak K, J. Chem. Phys, Vol. 49, No 10, (1968), pp. 4424-4442.
[3] Judd BR, Phy Rev (1962),127:750–61.
[4] Jørgensen CK, Reisfeld R, J Less-Common Met. (1983), 93:pp.107–120.
[5] Lin H, Pun EYB, Wang X, Lin X, J Alloys Compd, (2005), 390:pp.197–201.
[6] Ofelt GS, J Chem Phys (1962), 37:511–20 “fluoroborate glasses”, Opt Mater (2000), 15: pp. 65–79.
[7] S.A. Saleema, B.C. Jamalaiah, M. Jayasimhadri, A. Srinivasa Rao,Kiwan Jang, L. Rama Moorthy; Journal of
Quantitative Spectroscopy & Radiative Transfer (2011), pp.78–84.
[8] Surendra Babu S, Babu P, Jayasankar CK, Siewers W, Wortmann G, Opt. Mater, (2009), 31:624–31.
[9] Sardar DK, Bradley WM, Yow RM, Gruber JB, Zandi B, J Lumin , (2004), 106:pp.195–203.
[10] Tripathi G, Rai VK, Rai SB, Spectrochim Acta A, (2005);62:1120–4.
[11] Tanabe S, Kang J, Hanada T, Soga N, J. Non-Cryst Solids, (1998);239:170–5.
[12] Yang Z, Li B, He F, Luo L, Chen W, J Non-Cryst Solids , (2008);354:1198–200.
</div>
<!--links-->