Spatio-temporal dynamics and evolution of landscape pattern in coastal areas of central region, VN
Bạn đang xem bản rút gọn của tài liệu. Xem và tải ngay bản đầy đủ của tài liệu tại đây (1.85 MB, 13 trang )
<span class='text_page_counter'>(1)</span><div class='page_container' data-page=1>
V N U Journal of Science, E arth Sciences 28 (2012) 251-263
<b>Spatio-temporal dynamics and evolution o f landscape pattern </b>
<b>in coastal areas o f central region, Vietnam</b>
<b>M. Kappas'’*, Nguyen Hoang Khanh Linh'’^</b>
<i>^Dept. o f Cartography, GĨS & Rem ote Sensing, Georg-August-University Goettingen, </i>
<i>Goldschmidtstr 5, 37077 Goettingen, Germany </i>
<i>^Faculty o f Land Resources ẵ. Agricultural Environment, H ue University o f Agriculture & Forestry,</i>
<i>Ỉ02 Phung Hung, Hue City, Vietnam</i>
Received 05 October 2012;
Revised 26 Octobcr 2012; accepted 02 December 2012
A b stract. Studying temporal changes o f land use and land cover from satellite images has been
conducted in Vietnam several years. However, few studies have been done to consider seriously
the changes and landscape fragmentation, especially in coastal region, one o f the ecologically
vulnerable regions due to the intensive human activities and urbanization processes. Hence,
analyzing the changes o f landscape pattern helps revealing the interactions between anthropogenic
factors and ứie environment, through which planning actions could be effectively supported. The
present study aimed to examine these changes in the suưoundings o f Da Nang City, Vietnam from
1979 to 2009 based multi-temporal imagery viz. LANDSAT MSS, TM, ETM +, and ASTER
satellite images. The IR-MAD (iteratively re-weighted M ultivariate Alteration Detection)
transformation approach was employed for processing. Land cover change maps with six classes
<i>including agricultural land, urban, baưen land, forest, shrub and water body were created by the </i>
supervised classification method based on maximum likelihood algorithm. Post-classification
comparison was chosen as change detection method for four periods as 1979-1996, 1996-2003,
2003-2009, and 1979-2009. From which key landscape indices were applied by using
FRAGSTATS software. The results showed that during the whole study period, there was a
notable decrease o f forest, shrub, agricultural land and baư en land while urban areas expanded
dramatically. Further spatial analysis by using landscape metrics underlined the evidence of
changes in landscape characteristics with an increase in values o f num ber o f patches and patch
density while the value o f m ean patch size decreased during the span o f 30 years which indicated
landscapes o f Da Nang city have been becoming more fragmented and more heterogeneous.
<i>Keywords: landscape pattern, change detection, coastal region, Vietnam.</i>
<b>Ỉ. Introduction </b> urbanization is a global phenom enon and is
expected to continue for the n ext decades.
As stated in C om petitive C ities in the A ccording to the U nited N ations, roughly h a lf
G lobal Econom y [1] and State o f the W o rld ’s o f the w o rld ’s population lives in urban areas,
Cities 2008/2009: H arm onious C ities [2], and in 2030 it w ill be reached at 60% .
________ D eveloping countries are believed w here the
Coưesponding author: urbanization grow th sừ ongly happens up to
E-mail:
</div>
<span class='text_page_counter'>(2)</span><div class='page_container' data-page=2>
252 <i>M. Kappas, N.H.K. Link / V N U Journal of Science, Earth Sciences 28 (2012) 25Ĩ-263</i>
2030 [3]. U rban areas concentrate not only
people but also econom ic density and
productivity [4]. This is often the reasons o f
changing in lifestyles, high consum ption o f
energy, fransportation, infrasừiicture, and
production o f w aste, etc. [5-12]. U rbanization is
believed one o f the m o st prevalent
anthropogenic causes o f the losing arable land,
devastating habitats, and the decline in natural
vegetation cover [13]. As a consequence, rural
areas have been converted into urban areas w ith
an unprecedented rate and m aking a noted
effect on the natural functioning o f ecosystem s
[14]. Consequently, a profound understanding
o f land use change is very im portant to have a
prop er land use planning and sustainable
developm ent policies [15].
A ccording to M yint and W ang [16], such a
sustainable urban developm ent m ust be
sum m arized from num erous decisions, which
ex ừ acteđ based on huge data sources, viz.
physical, biological and social param eters o f
urban areas in the continued specừ um o f spatial
and tem poral dom ains. T herefore, to understand
urban land-use and land cover change (LU LC)
and to predict the change o f L U L C in future, it
is im portant to have an effective spatial
dynam ic tool. N ow adays, rem ote sensing
technologies have proven its capacity in
providing accurate and tim ely inform ation on
the geographic disừ ibu tion o f land use,
especially for region areas [17]. W ith the
support o f G eographical Inform ation System s
(G IS), satellite im ages can be used effectively
for estim ating and analyzing changes and
L U L C trends [18].
D ue to the fact that the rapid LU LC change
o f one certain area is considered as the driving
force o f environm ental and /o r ecological
changes, w hich is continuously transform ing
landscape pattern, thereby a need for
com prehensive assessing and analyzing the
change in landscape at broad scales is required.
Im portantly, understanding the changes in
spatial contribution o f landscape p attern helps
revealing the critical im plication o f com plex
relationship betw een anthropogenic factors and
environm ent [19]. T o describe fragm entation
and spatial disừ ib utio n, a range o f landscape
m eừ ics w as calculated for each land use/cover
class from satellite classification results by
FR A G STA TS [20].
The Earth's coastal zone is know n as home
o f diverse ecosystem s, such as estuaries, sea-
grass, coral reefs, lagoons, bays, tidal flats,
e tc .... It plays a crucial part for socio
econom ic developm ent and national security.
This zone is quite sensitive and vulnerable
because o f hum an developm ent activities,
especially, the tropical coast. As consequcnces,
these activities causes loses o f living
environm ent o f sea species, degradation o f
drinking w ater, changes o f hydrological cycles,
depletion o f coastal resources and m any other
im pacts to the global clim ate change. Therefore,
the m anagem ent o f m arine and coastal zone has
particularly received great attention from
m anagers as w ell as scientists all around the
world. The urgent dem ands should be set as lop
national sừ ategic m issions and should be
caư ied out w ith scientific fundam entals.
</div>
<span class='text_page_counter'>(3)</span><div class='page_container' data-page=3>
<i>M. Kappas, N.H.K. Link / V N U Journal of Science, Earth Sciences 28 (2012) 251-263</i> 253
land use/cover change in D a N ang for over past
20 years. Through exploring the land use map
extracted from satellite data o f different
periods, the aims o f the present study w ere to
detect, quantify and characterize the changes o f
land use/cover and landscape fragm entation in
Da N an g city.
<b>2. S tudy area</b>
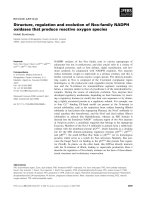
D a N ang city is located in Central region o f
V iet N atn, betw een the 15°55’ 19” to
16°13’20 ”N and 107°49’ 11” to 108°20’20”E
(F igure 1). It is a long-stretching narrow region
and w ell know n as a dynam ic city o f the Key
E conom ic Zone in central V iet N am . The area
consists o f hiils and m ountains in the northw est
and the Eastern Sea in the east. The altitude
varies from 400 m eters to 1,524 m eters above
sea level; next to is the upland with low
<i>m ountains and the delta takes 'Á areas in the </i>
southeast; it covers an area o f 1,283.42 square
kilom eters, including H oang Sa archipelago
district o f 305 square kilom eters.
D a N ang city has typical tropical m onsoon
clim ate. The average annual tem perature is
about
26°c,
average rainfall is about 2,505 mmper year and average hum idity is 83.4%. T here
are two main seasons annually: the w et
(A ugust-D ecem ber) and the dry (January-July).
In 2009, the total population is about 887,070
and the population density is 906.7 persons per
square kilom eters. D a N ang city is know n as
one o f the m ost densely populated and
urbanized area in V ietnam . W ith the econom y
developm ent and population increasing, the
local LULC in Da N ang city has changed
seriously.
</div>
<span class='text_page_counter'>(4)</span><div class='page_container' data-page=4>
2 5 4 <i>M. Kappas, N.H.K. Link / V N U journal o f Science, Earth Sciences 28 (2012) 251-263</i>
<b>3. D ata and m ethods</b>
<i>3.1. D ata so u rces and Im age p rep ro cessin g</i>
L A N D S A T and A S T E R satelliteim ages
w ere chosen for this study. The follow ing
criteria w ere considered for choosing proper
data: (1) the im ages should be long tim e enough
for detecting th e land use change; (2) study area
should not h av e cloud cover. U nfortunately, the
study area is located near coastal. D ue to the
influence o f clim ate, there are not m any data
satisfied b o th conditions. T he im ages alw ays
have som e th ick cloud cover or haze. In
addition, the study area is not entirely contained
w ithin one scene o f L A N D S A T either A STER.
T herefore, h av in g acquisition im ages near
anniversary d ates for changing detection as
Jensen m entioned [21] w as unavailable. In this
study, three periods o f satellite im ages were
selected to classify study area: LA N D SA T-3
M SS July 24, 1979; LA N D SA T-7 ETM +
M arch 04 and A pril 14, 2003 (dow nload free at
h ttp ://earth ex p lo rer. usgs.gov/ and
<b>h ttp ://gloviS.usgs.gov/); </b> and A S T E R A pril 02,
2009. T he details o f data w ere described in
T able 1. F or th is study, the reference data were
also used, included: (1) topographic m ap at
scale o f 1/50.000 conducted in 2001; and (2)
land use m aps at scale o f 1/25.000 conducted in
1997, 2003 an d 2010.
B ecause L A N D S A T and A ST E R im agery
w ere collected at level IT and IB respectively,
im ages w ere acquired at different spatial
resolution and pro jectio ns. T h erefo re, all
im ages w ere first rectifie d to U niversal
T ransverse M ercator (U T M ) coo rdin ate system ,
D atum W G S 84, Zone 48 N o rth for m atching
the geographic pro jection o f th e referen ce data.
Im ages w ere also co -reg istered to g eth er w ithin
25 well distributed G C P s (ground control
points) and polynom ial Is d by m eans o f
O rthoEngine provided b y P C I G eom atica 10.3
software. RM S < 0.5 w as receiv ed . In addition,
N earest N eighbour resam p lin g w as set for not
changing heavily the rad io m etric characteristic
o f image.
In this study, the iterativ ely re-w eighted
<b>multivariate alteration </b>
<b>detection (IR- </b>
M AD ) fransfonnation w as u sed for autom atic
radiom etric n o m a liz a tio n for all im ages by
m eans o f E N V I 4.7 so ftw are; see [22-24J.
A ST ER 02/04/2009 w as ch o sen as reference
image. H ow ever, this im age d o es not cov er all
the region o f study area, th erefo re a subset o f
1800 X 1100 pixels w ith 30m spatial resolution
including 968.17 square k ilo m eters w as created
for all im ages for fu rth er studying. This
territory w as chosen to ensu re the specific study
area w as in the an alysis im age. B esides the
requirem ent o f the sam e d im en sio n, im ages
m ust have the sam e spectral reso lu tion . H ence,
the com posite o f stand ard false colours was
used for this study: L A N D S A T M SS (754);
L A N D SA T T M /E T M + (4 32); A S T E R (321).
geom etric co rrection do n ot require. H ow ever,
Table 1. Characteristics o f satellite data used in study area
T ype o f sen so r Spatial resolution (m) B and D ate P a th Row A v erag e cloud coverage (% )
LANDSAT-3 M SS 68 4-8 July 24, 1979 134 49 20
LANDSAT-7 ETM + 30 1-5,7 M arch 04, 2003 125 49 34.65 *
30 1-5,7 April 14, 2003 124 49 0.34
ASTER 15 1-3 April 02, 2009 - - 4
</div>
<span class='text_page_counter'>(5)</span><div class='page_container' data-page=5>
<i>M . Kappas, N.H.K. Linh / V N Ư Journnl o f Science, Earth Scienccs 28 (2012) 251-263</i> <sub>255</sub>
<i>3.2. L U L C c la ssific a tio n a n d C h a n g e d etectio n</i>
Six land u se/co v e r classes w ere defined for
image classification based on the m odified
A nderson land use/co v er schem e level I [25],
included; (1) w ater, (2) forest, (3) shrub, (4)
agriculture, (5) barren and (6) urban land.
A nderson classificatio n schem e w as chosen
because o f the m a jo r land use/cover classes
using im ages w ith differences in spatial
resolution, w h ich are L A N D S A T M SS,
LA N D SA T T M , L A N D S A T ETM + and
ASTER. S u p erv ised classification using
m axim um lik elih o o d approach in EN V I 4.7 was
individually ap p lied for each im age o f study
area to classify land use/cover. M axim um
likelihood alg o rith m w as p refeư ed because this
rule is con sidered to have accurate results
because it h as m o re accurate results than other
algorithm s [26-28].
B ecause o f v ario u s im age acquisition dates,
training areas for the im ages o f the years 1979,
1996, 2003 and 2009 w ere different during the
classification. In addition, the iTaining areas
w ere verified by references data. A s the next
step, post-classification com parison change
detection alg o rith m w as selected to detect
changes in L U L C from 1979 to 2009 in study
area in order to m inim ize the problem in
radiom etric calib ratio n o f im agery o f two
different dates. F o r com parison o f the
classification results o f two dates, a change
detection m atrix w as created based on pixel-by-
pixel [21]. T hereby, each type o f from -to LU LC
change is identified.
<i>3.3. L a n d sc a p e fra g m e n ta tio n</i>
For quantifying landscape pattern and
landscape fragm entation, FR A G S T A T S w as
applied because this spatial statistic prog ram
offers a com prehensive choice o f landscape
m etrics. This program w as created by decision
maker, forest m anager and ecologists therefore
it is appropriate for analyzing landscape
fragm entation or describing characteristics o f
landscape, com ponents o f those landscapes
[29]. H ow ever, landscape pattern s w ere
com plicated; hencc, to clarify the relationship
o f spatial pattern and process it cannot use
single m etric alone [19, 30].
B ased on the scale o f study area (i.e. the
district level) and its characteristic as w ell, six
related landscape m etrics w ere selected: (1)
Percentage o f landscape (PLA N D ), (2) N um ber
o f patches (N P), (3) Largest patch index (LPI),
(4) M ean patch area (A R E A _M N ), (5) Patch
density (PD ), and (6) P roxim ity index
(PR O X _M N ). A b rie f description o f those
landscape m etrics used in study w as given in
Table 2. T hose descriptions could be also found
at u ser’s guide o f FR A G ST A T S™ [31].
Table 2. Landscape pattern m eừics description [29, 31].
In dex D escription U nit R ange
PLAND
NP
P ercentage o f landscape-equals the sum o f the areas (m^) o f all
patches o f the corresponding patch type, divided by total
landscape area (m^), multiplied by 100 to convert to a
percentage
N um ber o f patches-equals the number o f patches of the
coưesponding patch type (class).
Largest patch index-equals the area (m^) o f the largest patch o f
percent
none
0<PLAND<100
NP>1, no limit
LPI the corresponding patch type divided by total landscape area
(m ), m ultiplied by 100 to convert to a percentage
</div>
<span class='text_page_counter'>(6)</span><div class='page_container' data-page=6>
256 <i>M. Kappas, N.H.K. Link / VNU journal of Science, Earth Sciences 28 (2012) 251-263</i>
Index D escription U nit R ange
AREA_M N Mean patch area-Average size o f patches hectares AREA_MN>0,
no limit
PD
Patch density equals the num ber o f patches o f the
coưesponding patch type divided by total landscape area (m),
num ber per
100 PD >0
no limit
PROX_M N
multiplied by 10,000 and 100 (to convert to 100 hectares).
Mean proxim ity equals the sum o f patch area (m^) divided by
the nearest edge-to-edge distance squared (m^) between the
patch and the focal patch o f all patches of the corresponding
patch type whose edges are within a specified distance(m) o f
the
focal patch; Average proxim ity index for all patches in a class
hectares
meters PROX_MN>0,
no limit
<b>4. R esults and discussion</b>
<i>4.1. L a n d U se/ C over C hanges</i>
B efore doing any other interpretations,
th em atic LU LC m aps (1979, 1996, 2003 and
2009) w ere assessed their accuracy through four
m easurable m eans o f error m atrix: overall
accuracy, p rod ucer’s accuracy, u se r’s accuracy
and K appa coefficient. A total o f 300 sfratified
ran do m pixels w as taken for each LU LC m ap
and then checked w ith reference data.
A ccording to the accuracy assessm ent results o f
classified maps, the overall accuracy for
L A N D S A T M SS 1979, L A N D S A T ETM +
2003 and A ST ER 2009 w as 92.15% , 80.33% ,
84.44% and 89.00% respectively; the K appa
C oefficient o f those m aps reached at 0.9021,
0.6921, 0.7534 and 0.8005, respectively. The
results showed that LU LC m ap derived from
A S T E R has higher accuracy than the others.
T his could be explained by the better spatial,
specừal and radiometoic resolution o f ASTER data.
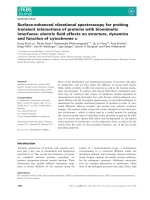
T h e LU LC m aps o f study area w ere
generated for all four years (Figure 2) and
</div>
<span class='text_page_counter'>(7)</span><div class='page_container' data-page=7>
<i>M. Kappas, N.H.K. Linh / V N U Journal of Science, Earth Sciences 28 (2072) 257-263</i> <i>257</i>
Legend
i m m water
H urban
<b>m </b>
forest^ 9 shrub
,__ _! barren
agncuiture
Figure 2. Land use/cover maps o f Da Nang city area.
Table 3. Results o f and use/cover classification for 1979, 1996, 2003 and 2009 images
LU LC class 1979 1996 2003 2009
A rea (ha) (% ) A rea (ha) (% ) A rea (ha) (% ) A rea (ha) (% )
Agriculture 12048.0 <i>/2.4</i> 10416,7 <i>10.8</i> 8118.1 <i>8.4</i> 7294.7 <i>7.5</i>
Barren 4312.2 <i>4.5</i> 3680.9 <i>3.8</i> <i>24ỉ,1.2</i> <i>2.6</i> 1708.9 <i>1.8</i>
Urban 6315.3 <i>6.5</i> 7791.5 <i>8.0</i> 11630.0 <i>12.0</i> 17298.5 <i>17.9</i>
Forest 61972.0 <i>64.0</i> 58126.7 <i>60.0</i> 59467.1 <i>61.4</i> 57936.2 <i>59.8</i>
Shrub 9785.2 <i>10.1</i> 14253.2 <i>14.7</i> 12335.9 <i>12.7</i> 9575.8 <i>9.9</i>
W ater 2384.6 <i>2.5</i> 2548.3 <i>2.6</i> 2779.0 <i>2.9</i> 3003.6 <i>Ì .Ì</i>
Total 96817.2 <i>100</i> 96817.2 <i>100.0</i> 96817.2 <i>100</i> 96817.7 <i>100</i>
To provide a further com prehensive
calculation in losing and gaining am ong the six
LU LC classes, the from -to change m afrix o f
land use/cover in D a N ang city w ere created in
three intervals, 1979-1996, 1996-2003,
</div>
<span class='text_page_counter'>(8)</span><div class='page_container' data-page=8>
258 <i>M . Kappas, N.H.K. Link / V N U Journal of Science, Earth Sciences 28 (2012) 251-263</i>
T ables 4, there w ere sm all differences o f area
coverage o f a particu lar class because o f used
different spatial resolutions for calculating
L U LC change from 2003 to 2009 (e.g., forest
coverage in 2009 is 57936.2 hectares in T able 3
and 57935.79 h ectares in T able 4c). It resulted
because o f using different spatial resolutions for
calculating L U L C change from 1979 to 2009.
In fact, the 2009 A S T E R im age w as re-sam pled
to a spatial reso lu tion o f 30 m eters.
D uring the first period (1979-1996), results
show ed that forest, agriculture, and barren
decreased strongly w hile urban area, shrub and
w ater body increased, notably the raising o f
shrub area. T ab le 4(a) indicated that the
expansion o f shrub area w as the m ost dram atic
changes in the region w hereas forest area
decreased, w hich w as the result o f deforestation
m ainly caused by the increasing dem and o f
tim ber products. U rban area grew up ju st
1476.2 hectares, representing 13.4% o f net
increase o f urban area.
In 1990, the policy no tim ber exploitation o f
natural forests w as prom ulgated by
governm ent, w hich could help to continue
supplying m aterials for tim bers and paper
industry. C onsequently, forestry productions
w ere exploited from forest plantation [32],
Therefore, in the second period (1996-2003)
forest cover extent had been slightly increased
by reforestation program s w ith 1340.01
hectares. As can be seen from Table 4b, urban
area prom ptly grew up 3838.5 hectares after
separating from Q uang N am province and
becam e a cenfrally governed city.
Table 4. Land use/ land cover ừansform ation mafrices o f study area from 1979 to 2009
(Unit: hectares)
1979
Agriculture B aưen Urban Forest Shrub Water 1996 Total
Agriculture 2910.96 1062.45 202,32 3865.05 2238.21 125.1 10416.69
Barren 657.81 481.5 573.84 986.49 832,23 142.56 3680.91
Urban 486.54 834.48 4280.67 1408.77 577.62 189 7791.48
Forest 2797.47 711.99 324,81 52197.03 1878.3 118.62 58126.77
Shrub 5016.06 984.69 655.65 3294.27 4084.56 201.69 14253.21
Water <sub>179.19</sub> <sub>237.06</sub> <sub>97.02</sub> <sub>220.41</sub> <sub>174.24</sub> <sub>1607.58</sub> <sub>2548.26</sub>
1979 Total 12048.03 4312.17 6314.85 61972.02 9785.16 2384.55
Change 1979-1996 -1631.34 -631.26 1476.63 -3845.25 4468.05 163.71
(a) 1979-1996
2003 1996
Agriculture Barren Urban Forest Shrub W ater 2003 Total
Agriculture 2244.51 282.87 575.01 2165.76 2782.44 61.2 8118.09
Barren 325.98 532.08 414.09 360.45 803.7 44.91 2487.15
Urban <sub>1127,07</sub> <sub>985.5</sub> <sub>5867.1</sub> <sub>1090.71</sub> <sub>2187.63</sub> <sub>310,86</sub> <sub>11629.98</sub>
Forest 4389.66 538.29 120.78 51701.94 2610.18 34.29 59466.78
Shrub 2235.96 1169.46 578.43 2572.11 5698.53 74.79 12335.94
W ater 80.91 166.23 221.67 137.25 154.44 1989.45 2778.84
1996 Total 10416.69 3680.91 7791,48 58126.77 14253.21 2548.26
Change 1996-2003 -2298.6 - 1193.76 3838.5 1340.01 -1917.27 230.58
</div>
<span class='text_page_counter'>(9)</span><div class='page_container' data-page=9>
<i>M. Knppns, N.H.K. Link / V N U joiirm l o f Science, Earth Sciences 28 (20Ĩ2) 251-263</i> 259
2009 2003
Agriculture B aưen Urban Forest Shrub Water 2009Total
Agriculture
Baưen
Urban
Forest
Shrub
Water
2003 Total
1858.68
86.76
3188.7
1036.17
1833.21
108.27
8118.09
Change 2003-2009 -823.41
177.66
121.86
1188.27
231.93
656.01
105.48
2487.15
-778.23
711
148.14
9025.29
414.99
808.56
460.89
11629.98
5668.56
2880.63
860.58
739.35
52503.66
2364.21
46.71
59466.78
-1530.99
1645.38
464.04
2673.81
3556.26
3851.46
138.33
12335.94
-2760.12
15.03
24.93
458.55
95.85
51.3
2104.29
2778.84
224.73
7294.68
1708.92
17298.54
57935,79
9575,82
3003.57
(c) 2003-2009
2009
Agriculture
B aưen
Urban
Forest
Shrub
Water
1979 Total
1979
Agriculture B aưen Urban Forest Shrub Water 2009 Total
1779.21
353.07
2975.04
3787,38
2895.48
257.85
12048,03
Change 1979-2009 -4753.35
991.26
78.3
1933.56
227.52
747.45
334 08
4312.17
-2603.25
110.79
91.8
5096.7
221.58
430.47
182.97
6314.85
10983.69
2394.99
933.93
3898.26
51584.22
2834.19
326.43
61972.02
-4036.23
1950.3
240.48
2789.37
1928.79
2589.48
286.74
9785.16
-209.34
61.83
8,73
581.04
89.37
67.68
1575.9
2384.55
619.02
7294.68
1708.92
17298.54
57935.79
9575.82
3003.57
(d) 1979-2009
W hich w as 35% o f n et increase o f urban
area. W hereas from 1996 to 2003, w ithin ju st
seven years, agriculture area reduced 2298.6
hectares, thus representing o f 19.1%.
In the third period, from 2003 to 2009,
forest area decreased once again (1.6% o f total
area in D a N ang City) due to the rapid
urbanization. A griculture area reduced 823.41
hectares w ithin six years, w hich represented o f
6.8%. C onversely, urban area incessantly
increased and gained 5668.5 hectares, w hich
contributed 51.6% to net increase o f urban area,
experienced a rem arkable change o f urban area
w ith a rapid scale.
A ccording to Table 4d, for 30 years,
although forest extent fluctuated variously in
d ifferent periods, this area decreased in general.
R esults show ed that the forest area lost 10387.8
hectares o f Its 1979 area to other classes, in
</div>
<span class='text_page_counter'>(10)</span><div class='page_container' data-page=10>
260 <i>M . Kappas, N,H.K. Link / V N U Journal of Science, Earth Sciences 28 (2012) 25Ĩ-263</i>
conversion o f grow th in urban area, 33.5% was
converted from forestry, 26.1% from
agriculture an d 21.5% from shrub. This also
resulted because o f the grow th o f econom ic
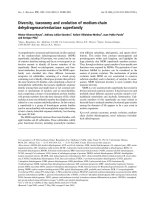
after applying D oim oi policy. As can be seen in
Figure 5. gross dom estic product (G D P) o f Da
N ang city increased steadily from 1990 to 2009,
w ith an annual grow th o f G D P o f 10.3%
(h igher than n a tio n ’s annual grow th o f GDP
7.2% ). In addition, the increase o f population in
D a N ang city could be seen as another reason
for urban expansion, in w hich population
increase from 679.7 thousand in 1997 to 890.5
thousand in 2009, representing an increase o f
31%. Based on Figure 3, the difference o f
spatial distribution o f urban area could be
clearly observed by the years. In 1979, the
urban area dispersedly located along the costal
line. By 2003, this area w as expanded more
concentrated along coastal zone and moved
tow ard Sontra peninsula. From 2003 to 2009,
the urban expansion changed the direction from
costal tow ard in land.
<b>□</b> <b> GDP</b> <b>%GDP</b>
<i>^ </i> <i>rỹ> </i> <i>rỹ rỹ rỹ fỹì rỹ> </i> <i>rỹì rỹ</i>
Y ears
Figure 5. Gross domestic product and its growth in Da Nang city from 1990-2009.
<i>4.2. F ragm entation A nalyses</i>
From L U L C m aps in 1979 and 2009, three
m ost changing classes (agriculture, urban and
forest) were chosen to com pute spatial
landscape m atrices at class level b y m eans o f
FR A G ST A T S softw are (Table 5). In D a N ang
city, forcsừy area presented as the dom inance
</div>
<span class='text_page_counter'>(11)</span><div class='page_container' data-page=11>
<i>M . Kappas, N.H.K. Link / V N U Journal o f Science, Earth Sciences 28 (2012) 251-263</i> 261
(PLAND) index decreased from 36% to 33.2%
and the num ber o f patches (N P) decreased from
2,180 to 1,554 during the w hole period from
1979 to 2009. W hereas the m ean patch area
index (A R EA _M N ) increased from 28.4
hectares to 38.0 hectares, w hich is supported by
the increasing o f the m ean p roxim ity index
(PROX _M N) from 2670.1 m etersto 17985.4
meters. In this case, those forested patches have
been low er isolation and m ore contiguous in the
domain o f spatial disfribution.
In regards to agriculture area during the
period 1979-2009, the num ber o f patches (NP)
increased from 1,240 to 3,051, the m ean patch
area (A R EA _M N ) decreased from 10.0 hectares
to 2.1 hectares and the m ean proxim ity
(PRO X _M N ) decreased strongly from 491.2
m eters to 24.2 m eters. T hese values revealed
that agriculture class in 2009 w ere m ore
isolated than it in 1979.
The spatial analysis o f urban areas show ed
the significant increasing o f the percentage o f
landscape index (PLA N D ) from 3.7% to 10.1%,
the num ber o f patches (N P) from 682 to 1771,
the largest patch index (LPI) fro m 1.0% to
4.6% . T hese indexes evidenced that the
expansion o f urban areas also concentrated on
existent urban. Finally, the gro w th o f m ean
proxim ity (PR O X _M N ) from 67.1 m eters to
1728.6 m eters and o f the patch density from 0.4
to 1.0 patches p er 100 hectares indicated that
urban class distributed in landscape
configuration in 2009 m ore clear th an in 1979.
Table 5. M eữics o f landscape structure for selected indices at the class level, 1979 and 2009.
Class P L A N D (% ) N P (#) L P I (% ) A R EA M N (ha) PD (#/100ha) P R O X M N (m)
1979
Agriculture 7.0 1240 2.7 10.0 0.7 491.2
Urban 3.7 682 1.0 9.2 0.4 67.1
Forestry 36.0 2180 29.4 28.4 1.3 2670.1
2009
Agriculture 3.6 3051 0.3 2.1 1.7 24.2
Urban 10.1 1771 4.6 10.2 1.0 1728.6
Forestry 33.2 1554 29.5 38.0 0.9 17985.4
<b>5. C onclusions</b>
By using the rem ote sensing and fractal
analysisa, this paper describes the analysis o f
LƯ LC and landscape change in the D a N ang
city, V ietnam in the period 1979-2009. T he
analysis carried out found that a notable
decrease o f agriculture and forest because o f
conversion to urban land during the span o f 30
years has taken place. F or further
understanding, key landscape indices w ere set
for three m ain classes to p erform the different
changes in landscape sfructure in the
surroundings o f D a N an g city. T h e dynam ic
change o f class indices revealed th e break-up o f
this area into sm aller patches. H ow ever, except
agriculture, patches o f forestry and urban
tended to have a u niform landscape
</div>
<span class='text_page_counter'>(12)</span><div class='page_container' data-page=12>
26 2 <i>M. Kappas, N.H.K. Link / V N U Journal of Science, Earth Sciences 28 (2012) 251-263</i>
<b>R eferences</b>
<i>[ 1 ] OECD, Competitive Cities in the Global</i>
<i>Econom. 2006, OECD, Paris.</i>
<i>[2] UN, State o f the World's Cities 2008/2009: </i>
<i>Harmonious Cities. 2008, United Nations </i>
Human Settlements Programme, Nairobi, Kenya
[3] <i>OECD, Cities and Climate Change. 2010, </i>
OECD publishing, ^l 0.1787/
9789264091375-en.
<i>[4] OECD, Regions at Glance 2009. 2009, OECD, </i>
Paris.
<i>[5] Angel, D.P., et al., The drivers o f greenhouse </i>
<i>gas emissions: What do we ỉearn from local </i>
<i>case </i> <i>studies? </i> Local Environment; The
International Journal of Justice and
Sustainability, 1998. 3(3): p. 263-277.
[6] <i>Collier, Ư., Local authorities and climate </i>
<i>protection in the European union: Putting </i>
<i>subsidiarity into practice? Local Environment: </i>
The International Joumal of Justice and
Sustainability, 1997. 2(1): p. 39-57,
[7J <i>Collier, u . and R.E. Lofstedt, Think globally, </i>
<i>act locally? : Local climate change and energy </i>
<i>policies in Sweden and the UK. Global </i>
Environmental Change, Ĩ997. 7(1): p. 25-40.
[8] DeAngelo, B J. and L.D.D. Harvey, The
jurisdictional framework for municipal action to
reduce greenhouse gas emissions: Case studies
from Canada, the USA and Germany. Local
<i>Environment: The International Journal o f </i>
<i>Justice and Sustainability, 1998. 3(2): p. 1Ì 1 -136.</i>
[9] <i>Harvey, L.D.D., Tackling urban Co2 emissions </i>
<i>in Toronto. Environment, 1993. 35(7): p. 16-20.</i>
[10] Lambright, W.H., S.A. Changnon, and L.D.D.
<i>Harvey, Urban reactions to the global warning </i>
<i>issue: agenda setting in Toronto and Chincago. </i>
Climate Change, 1996. 34: p. 463-478.
[11] McEvoy, D., D .c. Gibbs, and J.w .s. Longhurst,
<i>The Prospects fo r improved Energy Efficiency </i>
<i>in the UK Residential Sector. Journal of </i>
Environmental Planning and Management,
1999. 42(3); p. 409-424.
<i>[12] Wilbanks, T J. and R.w . Kates, Global change </i>
<i>in local places.'How scale matters. Climate </i>
Change, 1999. 43: p. 601-628.
<i>[13] Dewan, A.M. and Y. Yamaguchi, Land use and </i>
<i>land </i> <i>cover </i> <i>change </i> <i>in </i> <i>Greater Dhaka, </i>
<i>Bangladesh: Using remote sensing to promote </i>
<i>sustainable urbanization. Applied Geography, </i>
2009. 29(3): p. 390-401.
<i>[14] Turner, B.L., Local faces, global flows: The </i>
<i>role o f land use and land cover in global </i>
<i>environmental change. Land Degradation and </i>
Development, 1994. 5(2): p. 71-78.
<i>[15] Braimoh, A.K. and T. Onishi, Geostatỉsticaỉ </i>
<i>techniques fo r incorporating spatial correlation </i>
<i>into land use change models. International </i>
Journal of Applied Earth Observation and
Geoinformation, 2007. 9(4): p. 438.
[16] Myint, s .w . and L. Wang, <i>Muỉĩỉcriíerỉa</i>
<i>decision </i> <i>approach fo r land use land cover</i>
<i>change using Markov chain analysis and a </i>
<i>cellular </i> <i>automata approach. </i> Canadian of
Remote Sensing, 2006. 32(6): p. 390-404.
[17] Sun, z., R. Ma, and Y. Wang, <i>LANDSAT</i>
<i>data to determine land use changes in Datong </i>
<i>basin, China. Environmental Geology, 2009. </i>
57(8); p. 1825-1837.
<i>[18] Hathout, S., The use o f GỈS fo r monitoring and </i>
<i>predicting urban growth in East am! PVest Si </i>
<i>Paul, Winnipeg. Manitoba, Canada. Journal of </i>
Environmental Management, 2002. 66(3): p.
229-238.
<i>[19] Ning, J., et al.. Land use change and ecological </i>
<i>environment evolution in Taihu Lake Basin, in </i>
<i>International Conference on Geoinformatics </i>
<i>ỉềth, 2010 A .c . Yu Liu, Editor. 2010: Beijing, </i>
China.
<i>[20] Kamusoko, c . and M. AniYa, Land use/cover </i>
<i>change and landscape fragmentation analysis </i>
<i>in the Bindura district, Zimbabwe. Land </i>
Degradation and Development, 2006. 18: p.
221-233.
[21] Jensen, J.R., <i>introductory' </i> <i>digital </i> <i>image </i>
<i>processing: a remote sensing perspective. 3nd </i>
ed, ed. n. Edition. 2005, 3nd Edition, NJ:
Prentice-Hall.
<i>[22] Canty, M.J., Image analysis, classificaiion and </i>
<i>change detection in remote sensing with </i>
<i>algorithms fo r ENVỈ/ĨDL, Second ed. 2010: </i>
Taylor and Francis.
[23] Nielsen, A. A. K. Conradsen, and J. Simpson,
<i>Multivariate alteration dectection (MAD) and </i>
<i>MAF </i> <i>postprocessing </i> <i>in </i> <i>multispectral, </i>
<i>bitemporal image data: new approaches to </i>
<i>change detection studies. Remote Sensing of </i>
Environment, 1998. 64: <b>p. </b>1-19.
<i>[24] Canty, M.J, and A.A. Nielsen, Auiomatic </i>
<i>radiometric normalization o f muhitemporal </i>
<i>satellite imagery with the iteratively re- </i>
<i>weighted MAD transformation. Remote Sensing </i>
</div>
<span class='text_page_counter'>(13)</span><div class='page_container' data-page=13>
<i>M. Kaịipas, N.H.K. Linh / V N U journal of Science, Earth Sciences 28 (2012) 251-263</i> 263
<i>[25] Anderson, J.R., ct al., A land use/cover </i>
<i>classification system fo r use with remote sensor </i>
<i>data. US Geological Survey Professional 1976: </i>
p. 964: Sious Fails, SD.
<i>[26] Mengistu D. A. and Salami A. T., Application </i>
<i>o f remote sensing and GỈS inland use/land </i>
<i>cover mapping and change detection in a part </i>
<i>o f south western Nigeria. African Journal of </i>
Environmental Science and Technology, 2007.
1(5): p. 99-109.
<i>[27] Reis, S., Analyzing Land Use/Land Cover </i>
<i>Changes Using Remote Sensing and GĨS in </i>
<i>Rize, North-East Turkey. Sensors, 2008. </i>8: p.
6188-6202.
<i>[28] Diallo Y., Hu G., and Wen X., Applications o f </i>
<i>Remote Sensing in Land Use/Land Cover </i>
<i>Change Detection in Puer and Simao Counties, </i>
<i>Yunnan Province. Journal of American Scicnce, </i>
2009. 5(4): p. 157-166.
<i>[29] Keleạ, s., et al., Urbanization and forest cover </i>
<i>change in regional directorate o f Trabzon</i>
<i>forestry from Ỉ975 to 2000 using LANDSAT </i>
<i>data. </i> Environmental Monitoring and
Assessment, 2008. 140(1): p. 1-14.
<i>[30] Esbah, H., ct al., Analyzing landscape changes </i>
<i>in the Bafa Lake Nature Park o f Turkey using </i>
<i>remote sensing and landscape simcture metrics. </i>
Environmental Monitoring and Assessment,
2009. 165(1): p. 617-632.
[31] McGarigal, K., SA Cushman, MC Nccl, and E
<i>Ene. FRAGSTATS: spatial Pattern Analysis </i>
<i>Program fo r Categorical Maps. Computer </i>
<i>software program produced by the authors at </i>
<i>the University o f Massachusetts. Amherst. </i>
<i>Available </i> <i>at </i> <i>the </i> <i>following </i> <i>web </i> <i>site: </i>
<i>hitp://www. umass.edu/landeco/research/fragsia </i>
<i>ts/fragstats.html. </i> 2002.
<i>[32] Van Loi, N., Use o f GIS modelling in </i>
<i>assessment o f forestry land's potential in Thua </i>
<i>Thien Hue province o f central Vietnam, in GIS, </i>
<i>Remote Sensing & Cartography. 2008, Gcorg- </i>
</div>
<!--links-->
<a href='http://earthexplorer'>h ttp ://earth ex p lo rer</a>
<a href='%5el'>^l</a>