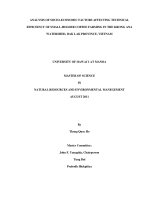
Intergrated study on factors affecting water quality of the saigon river system in vietnam
Bạn đang xem bản rút gọn của tài liệu. Xem và tải ngay bản đầy đủ của tài liệu tại đây (7.57 MB, 281 trang )
Integrated Study on Factors Affecting Water Quality of the Saigon
River System in Vietnam
(ベトナム国サイゴン川水系の水質に影響を及ぼす因子に関する統合的研究)
By
Nguyen Thi Van HA
グエン
ティ
バン
ハ
A dissertation submitted to the Graduate School of Engineering,
The University of Tokyo in partial fulfillment of the requirements for the degree of
Doctor of Philosophy
Examination Committee:
Prof. Satoshi TAKIZAWA (Chairperson)
Prof. Keisuke HANAKI
Prof. Hiroaki FURUMAI
Prof. Satoru OISHI
Assoc. Prof. Hiroyuki KATAYAMA
Assist. Prof. Kumiko OGUMA
Department of Urban Engineering
Graduate School of Engineering
The University of Tokyo
Japan
December 2009
- ii -
ABSTRACT
The Saigon River System, including Dau Tieng Reservoir and the Saigon River, is not
only the vital water resources in the Dong Nai River Basin for supplying water to Ho Chi
Minh City (HCMC), but also is the largest irrigation system in Vietnam. In recent years,
water quality of the Saigon River System has been deteriorated because of the rapid
economic growth of HCMC, Binh Duong and Tay Ninh Provinces in this basin and the
higher concentrations of manganese and iron as well as the salinity intrusion. This
unstable and poor quality of the river water has impaired its utilization and increased the
health risks for people.
The Saigon River system is a complex semi diurnal tidal river which is affected by the
water releasing from the Dau Tieng Reservoir, the natural flow, the regulated drainage
flow and the tidal waters. The Saigon River extends about 280 km which covers 4,717
km2 with different types of land uses and soil types. It passed through the most developed
regions in the southern of Vietnam, i.e. HCMC and Binh Duong Province. It is necessary
to conduct an integrated analysis on the water quality status in the river system in order to
provide a systematic view of the water quality status from the river and its components.
Furthermore, it will yield the interactions of various components of river system and
provided the scientific foundations for setting up sound policies and strategic
management for water resources in the Saigon River Basin.
This study was aimed to determine the water quality status of the Saigon River System
and to provide the scientific knowledge on natural and anthropogenic factors that
affecting water quality of the river system for its strategies and water quality management.
In order to fulfill the above objectives, a study of 6 specific contents was carried out such
as: (i) to investigate seasonal water quality variation in the Dau Tieng Reservoir, (ii) to
estimate the natural and anthropogenic factors affecting water quality, (iii) to investigate
the impacts of fish cage culture on water quality in the Dau Tieng Reservoir, (iv) to
identify sources and potential mechanism of manganese and iron inputs into the Saigon
River, (v) to elucidate water quality status along the Saigon River, and at the Hoa Phu
water intake, and (iv) to apply the artificial neural network to simulate the hourly
variations of salinity in the Saigon River at the Hoa Phu water intake.
The study combined five research approaches, including: (i) interview of fish cage
operators in the Dau Tieng Reservoir, (ii) ad-hoc river survey for on-site and off-site
water quality analysis, (iii) batch leaching tests for iron and manganese from soil and
sediment samples, (iv) continuously water quality monitoring at the water intake in the
-i-
Saigon River, and (v) artificial neural network for simulating hourly salinity at the water
intake.
The monthly water quality monitoring in the Dau Tieng Reservoir was conducted from
March 2005 to March 2006. It was found that water in the Dau Tieng Reservoir was
monomictic and had seasonal variations of water quality and acidification. The increased
inflows of low pH waters and nutrients, especially nitrogen and phosphorus, caused more
acidic, and decreased the water quality in the rainy season. The Dau Tieng Reservoir was
divided into three water zones based on the water quality characteristics: the western
branch, the eastern branch and the center of reservoir. It was also divided into three layers
depending on the water depths: surface (0-5m), middle (6-10m) and bottom layers
(deeper than 11 m). Water quality in the Dau Tieng Reservoir varied in the following
ranges: pH 4.7 – 8.72, EC 2 - 8 μS/cm, Turbidity 2 – 77 NTU, DO 0 - 12.5 mg/L, TDS
0.20 – 0.85 g/L, ORP -169 – 326 mV, BOD5 0.1 – 3.4 mg/L, COD 0.1 – 9.0 mg/L,
ammonia nitrogen 0 – 0.50 mg/L, nitrite 0.001 – 0.021 mg/L, nitrate 0.001 – 0.77 mg/L,
total nitrogen 0.11 – 6.83 mg/L, orthophosphate 0.001 – 0.057 mg/L, total phosphorus
0.001 – 0.334 mg/L, chlorophyll a 0.226 – 15.45 mg/m3, E. coli 0 – 12 CFU, and total
coliforms 0 – 295 CFU. The water quality of the Dau Tieng Reservoir met the
requirements of surface water quality standards for water supply (TCVN 5942-1995 Type A), except for 51%, 26%, 20% and 15% of the total water samples that exceeded
the permissible ranges for ammonium, dissolved oxygen (DO), nitrite and total coliforms,
respectively. The trophic status of the Dau Tieng Reservoir was at the mesotrophiceutrophic boundary. Phosphorus was found to be the limiting nutrient to algae growth.
The estimated total nutrient loads into the Dau Tieng Reservoir were approximately
4,729 tons of total nitrogen (TN) and 412 tons of total phosphorus (TP) per year. The
areal total phosphorus and total nitrogen loads were 1.52 g TP/m2 and 17.5g TN/m2 in
year 2005, respectively, which were about 8 and 6 times higher than the critical areal
loading levels of TP and TN recommended by Vollenweider (Kneale, 1997). The human
activities contributed significant portions of the total nutrient inputs into the Dau Tieng
Reservoir. Nutrients from the runoffs contributed 73% of the total nitrogen and 24% of
the total phosphorus. Fish cage culture and livestock raising added about 15% and 4% of
the total nitrogen, and 39% and 13% of the total phosphorus, respectively, into the
reservoir. The fish cage operation at peak time harvested 9,600 tons fish per year but also
released to the surrounding water 1,200 tons of TN and 281 tons of TP per year, which
increased BOD5, orthophosphate and ammonia nitrogen concentrations in the water in the
vicinity of fish cage. The comparison of water quality at fish cage areas before and after
the ban showed significant declines of BOD5, ammonia nitrogen, total nitrogen, total
phosphorus and orthophosphate in water. Our estimation suggested that limiting the
- ii -
number of fish cage by 250 cages and stopping animal raise could reduce about 28% of
the total phosphorus input, i.e. 147 tons TP, into the Dau Tieng Reservoir.
According to results of the four river water surveys in the dry season (March) and in the
rainy season (September) in 2005 and 2006, the Saigon River could be divided into three
sections: upstream, middle and downstream sections based on water quality
characteristics. The upstream section, from the Dau Tieng Reservoir to the boundary of
Tay Ninh Province and HCMC, had a high turbidity; therefore, soil erosion and
suspended particles in the discharges should be controlled in water quality management
practices. In the middle section, from this boundary to Binh Phuoc Bridge, the impacts of
low pH and leachable ions from the acid sulfate soil (ASS), especially manganese and
iron, deteriorated the water quality for its supply to HCMC and Binh Duong Province. In
the downstream section, water became more polluted by high concentrations of ammonia
nitrogen, total nitrogen and total phosphorus, due to untreated effluents from residential
and industrial areas, and dissolved manganese. Both middle and downstream sections
were highly contaminated by bacteria of E. coli and total coliforms.
The supplementary river and canal water survey was conducted in May 2008 in order to
identify water quality in the Saigon River and its tributaries and canals in the middle and
the downstream sections. The acid sulfate soil and sediment samples were also taken for
conducting the batch leaching tests and chemical analysis. Those experiments were aimed
to identify the manganese and iron sources and transports in the Saigon River Basin and
to provide better understanding on factors affecting their release rates. Two major sources
of manganese and iron inputs into the Saigon River water were found. In the middle
section of the Saigon River, manganese and iron leachings from ASS were the dominant
sources. Iron inputs from ASS were significantly higher than manganese inputs due to
much higher contents of iron than those of manganese in ASS. In the downstream river
sections, dissolution and reduction of manganese and iron from the deposited Mn-Fe-rich
sediments were the major sources. Manganese inputs from sediments became more
important than those from ASS leachate, indicating by manganese contents in sediment
was about 10 times of those in ASS; and the manganese releasing rate about 14 times of
that from leaching of ASS. The Dau Tieng Reservoir, soil erosion and industrial effluents
are not major sources of manganese and iron inputs into the Saigon River.
Manganese and iron had similar leaching behaviors from ASS. pH was found to be a
determinant factor for manganese and iron leaching from soil. Low pH (less than 3)
dissolves the iron-bound manganese and facilitates the pyrite oxidation in ASS, which
increases the dissolved manganese and iron concentrations in the drainage waters.
Change the pH from 4 to 1.5 could increase manganese leaching from PASS 10 times
that of iron 14 times. In contrast to the manganese and iron leaching from the soils,
- iii -
manganese leaching from the sediments was independent of iron leaching. Manganese
inputs from the sediments was found to be more important in the downstream river
section than the leaching from acid sulfate soils, which was evidenced by ten-times
higher manganese contents in the sediments than in the ASS and the fourteen-times
higher manganese releasing rates from the sediments than the ones from the ASS. In
contrast with manganese, iron leaching from sediments was slow and less significant.
The sediment leaching test revealed that manganese and iron release rates from sediments
depended on pH, redox potential (Eh), their aqueous concentrations and their contents in
the sediments, which were of less importance. Those factors caused the temporal and
spatial variations of manganese and iron released. Eh was found to have no direct effect
on manganese reduction from the sediments. Because of the acidic nature (pH<6) of
Saigon water pH did not show direct effects on manganese leaching from sediment.
Manganese contained in the sediments readily dissolved into water. Meanwhile, decrease
of pH and Eh affected the iron releasing rate. Especially, decrease of Eh caused the
significant increase of iron releasing from sediments due to the iron reduction process.
Both the ad-hoc river survey and the continuous water quality monitoring found that in
the middle section of the Saigon River, pH decrease and Eh increase occurred frequently
in the rainy season, which facilitated manganese releasing from the sediments, but
retarded the iron reduction from the sediments. In the downstream section, acidic water
and anoxic water (low Eh) facilitated manganese dissolution from sediments, resulted in
the elevated manganese concentrations in water. When water was mostly anoxic for a
long time period, manganese and iron reductions took place, however, the iron reduction
were much slower, indicated by the decrease of dissolved iron concentrations in the
downstream water. The ASS-derived sediments had the highest release rates of
manganese and iron due to its high contents of total manganese, total iron and their
readily dissolved forms.
The advanced techniques such as the continuous on-site water quality monitoring and the
artificial neural network were applied in this study in order to provide (i) baseline data of
water quality for water supply in the Saigon River, and (ii) a tool for water quality
simulation, respectively. Both have demonstrated their useful application and advantages
in water quality monitoring and management. The three data loggers, including
Aquadopp, YSI and CLW, were installed at about 4 m above river bottom at the water
intake in the Saigon River for monitoring the water level, water velocity and the physical
water-quality parameters at 10 or 30-minute intervals from April 2006 to April 2008. The
hourly logging data in two monitoring years showed that water quality at the water intake
did not meet the Vietnamese standard for water supply for pH and DO throughout a year
and for and salinity in the dry season. The hourly water quality data varied in the
- iv -
following ranges: pH 3.83 - 6.84, EC 0.002 -1.171 mS/cm, temperature 26.23 – 31.89oC,
DO 0 – 6 mg/L, salinity 0 – 0.54 ‰, TDS 0.01 – 0.713 mg/L, Eh 211 – 698 mV,
chlorophyll a 1.21 – 11.12 mg/m3 and turbidity 6.7 – 198.2 NTU. Low pH and DO
depletion in the rainy season, high chlorophyll a concentration in April, high salinity in
the dry season were found to be the main characteristics of the Saigon River.
The back-propagation ANN model showed good performance for simulating hourly
salinity in the Saigon River, using pH, water velocity and water level as input variables.
pH was thought that has less interference on salinity, however, the results indicated that
pH was correlated with salinity in the Saigon River and could improve the performance
of ANN training process because pH had the same “variation patterns” with salinity in
the Saigon River. The study found that ANN could stimulate the hourly variation of
salinity within an acceptable error (i.e. mean square error (MSE) = 0.3 and correlation
efficient R = 0.86 for training data set). The ANN could also predict the missing data for
salinity in the continuous water quality monitoring. However, to improve the ANN
model’s performance, six input variables should be studied further such as (i) water flow
direction, (ii) time function, (iii) lag of inputs, (iv) the difference between two time series
water levels, (v) tidal regimes, and (vi) upstream and downstream water levels and
salinity concentrations. Input variables and ANN geometry should be restructured so that
ANN model will be able to forecast the water quality trends before water quality became
worse for withdrawing water.
The study found that the emerging water-quality problems in the Saigon River impaired
water use in recent years, even when water was abundant in there. The elevated
manganese concentration and bacteria contamination created the potential risk on human
health. High concentrations of manganese, ammonia nitrogen and salinity made
difficulties for water treatment. Chlorophyll a and turbidity were not the major problems
of water quality in both the Saigon River and the Dau Tieng Reservoir. These existing
water-quality problems will become more seriously in the future, especially when only
10% of sewage has been treated. The impacts of salinity intrusion will increase with the
impacts of climate changes and less discharge from the Dau Tieng Reservoir.
The Water-quality in the Saigon River should be managed in the different approaches
from the present ones and should be taken into account with the integrated river basin
management. The study proposed some main management strategy as following: (i)
Applying the total maximum daily loads to control water quality of the Dau Tieng
Reservoir, (ii) limiting the number of fish cage by 250 cages and stopping the livestock
animal raise in the Dau Tieng Reservoir to protect the good water sources, (iii)
implementing the better practice and management of land use and ASS to avoid the
leachable acid and heavy metal, (iv) avoiding water acidification and DO depletion in the
-v-
Saigon River, (v) setting up the water quality standard for reservoirs and enforcing the
environmental regulations (water quality standard and polluter pays principle) and
wastewater treatment, (vi) establishing the continuous water-quality monitoring network,
of which at least three monitoring stations should be taken into account such as DT7,
SG15 and SG19, (vii) increasing the implementation of water quality models or ANN
tool for water quality simulation, prediction, forecast and management. Moreover, the
possibility of withdraw water directly from the Dau Tieng Reservoir for water supply and
the development of community-based water management should be studied and
implemented as soon as possible.
To improve the study results, the effect of pH and nutrients on controlling of algal growth
in tropical reservoirs, manganese and iron immobilization in soils and sediments, and the
upgraded ANN models for forecasting water quality should be studied further.
- vi -
ACKNOWLEDGEMENTS
When I was born, my father gave me a name called “Ha”, which means “River”. Later, as
seemingly guided by destiny, I love Water and River and devote my life to study on
Water. I decided to spend a part of my life to study on the Saigon River, which always
nurtures my dreams and desires. This dissertation is the first product about this dream.
This product will never be manufactured without my advisor, Sensei, Professor Satoshi
Takizawa, who always extends me a helping hand in case of need, and provides me with
invaluable comments and unreserved patience and guidance. His advices and boundless
knowledge enabled me to overcome all the difficulties I encountered. I am revigored by
his curing hands and there are not enough words that I can use to express my deep
gratitude to him.
I would also like to address my sincere thanks to the committee members, Prof. Hiroaki
Furumai, Prof. Keisuke Hanaki, Prof. Satoru Oishi, Assoc. Prof. Hiroyuki Katayama and
Assist. Prof. Kumiko Oguma, for providing me invaluable advices in order to improve
my research.
I am immensely grateful to Prof. Nguyen Cong Thanh and Prof. To Phuc Tuong, who
have sharpened my study capacity. Both have left the unforgettable stamp in my
professional life.
I am profusely grateful to my father, Nguyen Huu Hiep and my mother, Bui Thi Dao who
gave me unreserved and constant love and support, to my husband, Pham Ngoc Hoang
and my two lovely children Thong and Nhu for their endless love, patience and
encouragement, to sister, Ha, to brother, Huy, to uncle, Nguyen Huu Hung and all my
family members, uncles, aunts, and cousins.
I wish to express my sincere thanks to Prof. Shinichiro Ohgaki, Prof. Satoru Oishi, Prof.
Nguyen Van Phuoc, Assoc. Prof. Nguyen Phuoc Dan, and Ms. Le Thi Sieng for their
precious guidance and encouragement.
I am grateful to the Japanese Science Promotion Science (JSPS), Ronpaku Program for
the financial support throughout my study in Japan; the Ho Chi Minh City National
University for the financial support to conduct the monitoring experiment in Vietnam, to
the Global Center of Excellence, University of Yamanashi for kindly providing the
monitoring equipments during field experiment, to Department of Urban Engineering,
- vii -
University of Tokyo for giving me the opportunity to develop my research in the
laboratory. I am also thankful to the Dau Tieng Irrigation and Exploitation Company, the
Water Resources Institute and the Southern Regional Hydro-Meteorological Center in
Vietnam for their kind support during water and sediment sampling in Vietnam.
I would like to acknowledge Dr. Kumiko Oguma, Dr. Michio Murakami for their friendly
encouragement and helpful hands during my experimental works; Mr. Shoji Karasawa,
Mr. Hiroyuki Nakagawa, Mr. Micha Sigrit for their technical supports for my laboratory
works. I am also thankful to the whole research group in the Urban Water System
laboratory – Dr. Allisara, Dr. Thuy, Dr. Jenyuk, Dr. Aunnop, Kuroda, Fukushi, Tomoko,
Ishitobi, Umemoto, Huy, to my friends – Dr. Chanetta, Dr. Charminda, Hayja, Wanatabe,
Kumar, Kojima, Thao, Van, Bao, Huong, Binh, Ngan, Quang, Mai Anh, Quoc, Hung, Le
–who made my life in Japan enjoyable, meaningful and memorable, to my assistants –
Hang, Phuong, Linh, Hop, Luan, Kiet – who always support me during study.
- viii -
TABLE OF CONTENTS
Title
Page
CHAPTER 1 INTRODUCTION
1
1.1
1.2
1.3
1.4
1
5
7
8
Background
Objectives of the Study
Scope of the Study
Structure of the dissertation
CHAPTER 2 LITERATURE REVIEW
11
2.1
2.2
11
13
13
13
18
20
22
22
23
24
25
25
29
29
30
31
34
36
36
41
44
Water Quality Management in Asian Countries
Reservoir Water Quality Management
2.2.1
Technical Definitions
2.2.2
Tropic Status Assessment of Tropical Reservoirs
2.2.3
TMDL-Based Reservoir Management
2.2.4
Empirical models of phosphorus load and concentration of TP
2.3
Acid Sulfate Soil: Problems and Management
2.3.1
Distribution of Acid Sulfate Soil
2.3.2
Pyrite Oxidation Process
2.3.3
Emerging Problems and Management of Acid Sulfate Soils
2.4
Manganese and Iron Contamination of Surface Water
2.4.1
Manganese and Iron in Nature
2.4.2
Problems of Manganese and Iron in Drinking Water
2.4.3
Health Effect and Regulatory Consideration with Manganese and Iron
2.4.4
Manganese and Iron Removal from Surface Water
2.4.5
Manganese and Iron Transport Between Media
2.4.6
Manganese and Iron Cycle at the Sediment-Water Interfaces
2.5
Artificial Neural Network Application for Water Management
2.5.1
Introduction of Artificial Neural Network
2.5.2
Application of Artificial Neural Network on Water Research
2.5.3
Salinity Prediction Models
- xiv -
CHAPTER 3 MATERIALS AND METHODS
47
3.1
47
47
54
57
57
Study Area
3.1.1
Saigon River Water System
3.1.2
Water Use in HCMC
3.2
Water Quality Problems in the Saigon River
3.2.1
Water Pollution in the Saigon River
3.2.2
Water Quality Problems at the Hoa Phu Water Intake in the Saigon
River
3.2.3
Salinity Intrusion in the Saigon River
3.3
Sample Collection
3.3.1
Water Samples
3.3.2
Soil and Sediment Samples
3.4
Batch Leaching Test
3.5
Synthetic Saigon River Water
3.6
Chemical Analysis
3.6.1
Water Analysis
3.6.2
Soil and Sediment Analysis
3.7
Continuous Monitoring of Water Quality
3.7.1
Flow Monitoring
3.7.2
Water Physical-Parameter Monitoring
3.7.3
Turbidity and Chlorophyll a Monitoring
3.7.4
Install and Maintain Data Loggers
3.8
Interview Method
3.9
Secondary Data
3.10 Statistical Methodology
3.11 Artificial Neural Network
58
59
63
63
63
64
64
65
65
67
68
68
69
70
72
72
73
73
73
CHAPTER 4 NATURAL AND ANTHROPOGENIC FACTORS CONTROLLING
WATER- QUALITY VARIATIONS IN THE DAU TIENG RESERVOIR
74
4.1
Background of the Dau Tieng Reservoir
4.1.1
Locations and Hydrology
4.1.2
Water Use and Water Quality of Dau Tieng Reservoir
4.1.3
Soil Types and Land Use of the Dau Tieng Watershed
4.2
Methodology
4.3
Water Quality of the Dau Tieng Reservoir
4.3.1
Variations of Water Quality in Dau Tieng Reservoir
- xv -
74
74
77
79
81
83
83
4.3.2
4.3.3
4.3.4
4.3.5
4.3.6
Stratification
Episodic acidification
Seasonal Variations of Nutrient Inputs
Nutrient and Suspended Solid Retention in Dau Tieng Reservoir
Chlorophyll a and Eutrophication
85
88
90
92
93
4.4
Impacts of Fish Cage Culture on Water Quality of Dau Tieng Reservoir
96
4.4.1
Results of Survey
96
4.4.2
Nutrient Loads to Surrounding Water
98
4.4.3
Impacts of Fish Cage Culture on Water Quality of DT Reservoir
99
4.5
Nutrients Loads to Dau Tieng Reservoir
101
4.5.1
Calculation Methods for Total Nutrient Loads
101
4.5.2
Total Nutrient Loads in Dau Tieng Reservoir
103
4.6
Total Maximum Daily Loads (TMDLs) of Dau Tieng Reservoir
104
4.6.1
Areal Total Phosphorus Load
104
4.6.2
Critical Loads of Total Phosphorus
105
4.6.3
Correlation Model Between Average TP Concentrations and TP Loads105
4.6.4
Load Reduction for Dau Tieng Reservoir
106
4.7
Conclusions
107
CHAPTER 5 MANGANESE AND IRON SOURCES AND TRANSPORTS IN THE
SAIGON RIVER BASIN
109
5.1
5.2
Potential Sources of Manganese and Iron in the Saigon River
109
Study Area and Methodology
110
5.2.1 Study Area
110
5.2.1
Materials and Methods
112
5.3
Variations of Total Manganese and Total Iron in the Saigon River
115
5.3.1
Variations of Total Manganese and Total Iron Concentrations in Surface
Water
115
5.3.2
Variations of Total Manganese and Iron Concentrations at Different Water
Depths
118
5.3.3
Ratios of Dissolved Manganese to Total Manganese
119
5.3.4
Manganese, Iron and Ion Contents in Sediments and Acid Sulfate Soils120
5.4
Manganese and Iron Releases from Acid Sulfate Soils
122
5.5
Manganese, Iron and Aluminum Releases from Sediments
125
5.6
Sulfate and Chloride Releases from Sediments
127
5.7
Effect of pH and Eh on Iron and Manganese Releases from Sediments
129
5.8
Correlations of Cations and Anions Release Rates from Sediments
133
- xvi -
5.9
Potential Sources of Manganese and Iron Releases into the Saigon River
5.10 Potential Mechanisms of Manganese and Iron Releases into Saigon River
5.10.1
Mechanisms of Manganese and Iron Releases from ASS
5.10.2
Mechanisms of Manganese and Iron Releases from Sediments
5.11 Proposed Mechanism of Manganese and Iron Leaches in Saigon River Basin
5.12 Risks of Manganese and Iron Releases into the Saigon River System
5.13 Conclusions
134
135
135
138
142
144
145
CHAPTER 6 WATER QUALITY VARIATIONS AND SALINITY SIMULATION
USING ARTIFICIAL NEURAL NETWORK
147
6.1
6.2
6.3
Introduction
147
Scope of the Study
148
Methodology
148
6.3.1
Ad-hoc Saigon River Water Survey
148
6.3.2
Continuous Monitoring of Water Quality
148
6.3.3
Flow Monitoring in the Saigon River
150
6.3.4
Data analysis
152
6.4
Results and Discussion
152
6.4.1
Seasonal Variations of Water Quality in the Saigon River
152
6.4.2
Water Quality at the Hoa Phu Water Intake
157
6.4.3
Hourly Variations of pH and Eh in the Saigon River
161
6.4.4
Hourly Variations of Chlorophyll a in the Saigon River
163
6.4.5
Hourly Variations of Turbidity in the Saigon River
165
6.5
Tidal Regimes of the Saigon River at Hoa Phu Water Intake
166
6.5.1
Results of Saigon River Flow-Monitoring at Hoa Phu Water Intake 166
6.5.2
Relationship between Edge Velocity (Vp) and Cross-Sectional Average
Velocity (Vc)
168
6.5.3
Estimating the Average Flow Using the Edge Velocity (Vp)
169
6.6
Salinity Intrusion at Hoa Phu Water Intake in the Saigon River
173
6.7
Salinity Simulation Using Artificial Neural Network at Hoa Phu Water Intake175
6.7.1
Determination of Model Inputs
176
6.7.2
Data Preparation
180
6.7.3
Set Up the ANN Model
182
6.7.4
Results of ANNs for Simulating Salinity in the Saigon River
182
6.8
Possibility of Improvement of ANN Model Performance
189
6.8
Conclusions
190
- xvii -
CHAPTER 7 CONCLUSIONS AND RECOMMENDATION
193
7.1
Water Quality Status of the Saigon River System
7.1.1
Water Quality in Dau Tieng Reservoir
7.1.2
Water Quality in the Saigon River
7.1.3
Water Quality at Hoa Phu Water Intake
7.2
Manganese and Iron Sources and Transports in the Saigon River
7.3
Salinity Simulation Using Artificial Neural Network (ANN) Model
7.4
Conclusions
7.5
Recommendation for Future Study
193
193
195
195
196
197
198
200
REFERENCES
APPENDIX 1
APPENDIX 2
APPENDIX 3
APPENDIX 4
201
214
216
227
231
- xviii -
LIST OF TABLES
Title
Page
Table 2.1 Cases of water quality problems and management in the Asian countries
11
Table 2.2 Summary of some characteristics of tropical lakes with their consequences
for the function of tropical lakes and management implications
14
Table 2.3 OECD and Carson index for trophic status assessment
16
Table 2.4 Loading rate for nitrogen and phosphorus in lakes and reservoir
20
Table 2.5 Empirical models between TP load and TP concentrations in lakes/reservoirs21
Table 2.6 Emerging problems caused by acid sulfate soils
25
Table 2.7 Concentrations of manganese and iron found in environments
27
Table 2.8 Application of neural network on water researches
42
Table 2.9 Advantages and disadvantages of ANN model and process-based model
45
Table 3.1 Designed, existing and extended capacity of Dau Tieng Reservoir
50
Table 3.2 Population, GDP and industrial development in the Saigon River Basin
52
Table 3.3 Number of industrial parks and their discharges into the Saigon River
53
Table 3.4 Population, population density and domestic discharges
53
Table 3.5 Monthly average flow (m3/s) of Saigon River with regulated flow from the
Dau Tieng Reservoir
54
Table 3.6 Water level (m) at Phu An gauging station in 2004
54
Table 3.7 Water in selected Southeast Asia Cities
55
Table 3.8 Isohales of 1 ‰ and 4 ‰ in the Dong Nai and Saigon Rivers after operations
of Tri An, Thac Mo and Dau Tieng Reservoirs in the basin
60
Table 3.9 Water discharges from the Dau Tieng Reservoir for controlling salinity
63
Table 3.10 Physic-chemical properties of the synthetic Saigon River water
65
Table 3.11 Materials and methods used for water analysis in the research
66
Table 3.12 Parameter and analysis methods for soil and sediment samples
67
Table 3.13 Water quality parameters, measurement range, resolution and accuracy of
data loggers
71
Table 4.1 Main weather conditions and hydrology characteristics of the Dau Tieng
Reservoir
75
Table 4.2 Comparison of water quality of Dau Tieng, Tri An and Thac Mo Reservoirs
in the Dong Nai River Basin
79
Table 4.3 Land use distribution in Dau Tieng Reservoir Watershed
80
Table 4.4 Seasonal and average concentrations of main water quality parameters in
Dau Tieng Reservoir
84
- xix -
LIST OF TABLES
(continued)
Title
Page
Table 4.5 Mass balances of water, sediment, total nitrogen and total phosphorus of
Dau Tieng Reservoir in 2005
Table 4.6 Comparison of trophic status of reservoirs
Table 4.7 Estimation of nutrient loads from fish cage operation in DT Reservoir
Table 4.8 Estimated nutrient loads to Dau Tieng Reservoir
Table 4.9 Potential and maximum total phosphorus cut-offs
Table 5.1 Code of the experimental treatments for batch leaching test
Table 5.2 Comparison of organic carbon (%) and ions contents (mg/kg dry weight)
in ASS and sediments
Table 5.3 pH and dissolved manganese and iron concentrations in soil leachates and
total manganese and total iron contents in soils
Table 5.4 Manganese and iron release rate (%) from sediments
Table 5.5 pH, EC, DO and ORP of the final leachates of sediment leaching test
Table 5.6 Comparison of manganese and iron leached amounts from soils and
sediments in the batch tests
Table 5.7 Examples of Minerals iso-structure with chemically close to jarosite
Table 6.1 Summary results of continuous water quality monitoring in Saigon River
Table 6.2 Discharges from Dau Tieng Reservoir to control the downstream salinity
Table 6.3 Cross-correlation coefficient between variables and EC in the dry season
Table 6.4 Input vectors used for training ANNs
Table 6.5 Input lags chosen for the salinity model
Table 6.6 Size of input data
Table 6.7 Characteristics of ANN models
Table 6.8 Results of ANN models simulation
- xx -
92
95
99
103
107
114
122
124
127
130
135
137
157
174
176
177
178
181
182
184
LIST OF FIGURES
Title
Page
Figure 1.1 Saigon River System and its components
Figure 1.2 Structure of dissertation
Figure 2.1 Example of relationships of TP, TOP and TIN/TOP for determining the
nutrient limiting factor (NJDEP, 2004)
Figure 2.2 Manganese cycle occurs at the sediment-water interfaces
Figure 2.3 Schematic drawing of a typical neuron
Figure 2.4 Structure of artificial neural nework
Figure 2.5 Schematic diagram of the three –layer backpropagation neural network
Figure 3.1 The Saigon River System and its tributaries
Figure 3.2 Daily rainfall at Dau Tieng Reservoir (2005)
Figure 3.3 Existing and forecasted water intake capacity from water resources in the
Saigon – Dong Nai River Basin for water supply in HCMC
Figure 3.4 Percentage of water distribution among water users in HCMC
Figure 3.5 Variations of DO, turbidity, iron and manganese in the Saigon River
Figure 3.6 Predicted the maximum salinity concentrations in the Saigon – Dong Nai
River Basin in 2005
Figure 3.7 Predict maximum salinity concentrations in the Saigon River with different
scenarios
Figure 3.8 AQUADOP current profiler
Figure 3.9 Interface of the AQUAPRO WIN 32 software
Figure 3.10 Data logger YSI 6600 V2.
Figure 3.11 Interface of the ECHOWATCH software
Figure 3.12 Miniature Compact – ACLW
Figure 3.13 Interface of the Win CKU software
Figure 3.14 Data loggers used in the continuous monitoring at Hoa Phu Intake
Figure 4.1 LANDSAT 7 Satellite Image of Dau Tieng Reservoir on 9 March 2005
Figure 4.2 Monthly inflows, outflows and water storages in DT Reservoir
Figure 4.3 Relationship between rainfall and water levels in Dau Tieng Reservoir
Figure 4.4 Development history of fish cage culture in Dau Tieng Reservoir
Figure 4.5 Topography slope of Dau Tieng Reservoir Catchment
Figure 4.6 Dau Tieng Reservoir Watershed and sampling locations
Figure 4.7 Trends of average pH and ammonia nitrogen at three water layers
Figure 4.8 Isopleths of temperature, DO, pH and conductivity at location DT7
Figure 4.9 Profiles of average temperature, DO, pH and EC by water depths
- xxi -
3
9
18
31
37
38
40
48
49
56
56
59
61
62
68
69
69
70
70
71
72
75
76
76
78
80
82
83
87
88
LIST OF FIGURES (continued)
Title
Page
Figure 4.10 pH variations of inflows and waters in Dau Tieng Resevoir
89
Figure 4.11 Monthly variations of nitrate, ammonia nitrogen, total nitrogen and total
phosphorus
91
Figure 4.12 Monthly variations of chlorophyll a (March 2005 to March 2006)
94
Figure 4.13 Relationship between ratios of TIN to TOP and TP and TOP in the surface
water layer of Dau Tieng Reservoir
96
Figure 4.14 Distribution of number of people per fish cage
97
Figure 4.15 Distribution of education, domestic water use (DW), payment of water fee
(PWF)
97
Figure 4.16 Reasons for starting and stopping fish cage culture in DT Reservoir
98
100
Figure 4.17 BOD5 variations at different monitoring locations
100
Figure 4.18 Trends of BOD5 in water with and without fish cages
Figure 4.19 Trends of orthophosphate in water with and without fish cages
101
Figure 5.1 Schematic of the potential sources of manganese and iron in Saigon River 110
Figure 5.2 Map of study area, sampling sites and distributions of ASS
111
Figure 5.3 Correlations of Hach and ICP analysis for manganese and iron
112
Figure 5.4 Experimental setup for sediment batch leaching test
114
Figure 5.5 Profiles of pH, DO, manganese and iron in surface layer in 2006 and 2008 117
Figure 5.6 Trends of total manganese and total iron at different water depths
118
Figure 5.7 Percentage of dissolved Mn to total Mn at different water depths
120
Figure 5.8 Trends of dissolved manganese, iron and aluminum during batch leaching
test from sediments
126
Figure 5.9 Trends of sulfate and chloride during batch leaching test from sediments 128
Figure 5.10 Trends of DO, pH, EC and ORP of leachates during batch leaching test 129
Figure 5.11 Estimated distribution of manganese and iron species based on pH and
Eh of the final leachates
132
Figure 5.12 Relations between dissolved ions (manganese, calcium, sulfate and
aluminum)
133
Figure 5.13 Manganese and iron releases (µM/L) from soil batch leaching test
134
- xxii -
LIST OF FIGURES (continued)
Title
Page
Figure 5.14 Ratio of dissolved manganese to dissolved iron released form soil
Figure 5.15 Manganese, iron and sulfate leaching behaviours from sediments
Figure 5.16 Sources and factors control manganese and iron inputs in Saigon River
Figure 6.1 Cross section of the Saigon River at SG15 and location of data loggers
Figure 6.2 Bridge gate of Hoa Phu water intakes at SG15 of the Saigon River (left)
and three data loggers (right)
Figure 6.3 Location of observation point and flow measurement
Figure 6.4 Seasonal trends of pH along the Saigon River
Figure 6.5 Seasonal trends of Eh along the Saigon River
Figure 6.6 Seasonal trends of turbidity along the Saigon River
Figure 6.7 Seasonal trends of ammonia nitrogen along the Saigon River
Figure 6.8 Seasonal trends of total nitrogen along the Saigon River
Figure 6.9 Seasonal trends of total nitrogen along the Saigon River
Figure 6.10 Total coliforms detected in the Saigon River
Figure 6.11 E. coli detected in the Saigon River
Figure 6.12 Daily rainfalls in 2006 and 2007 in the Saigon River Basin
Figure 6.13 Variations of hourly pH at Hoa Phu water intake from May to October
in 2006 and 2007
Figure 6.14 Trends of pH and Eh at Hoa Phu water intake in the rainy season 2006
Figure 6.15 Trends of pH and Eh at Hoa Phu water intake in the rainy season 2007
Figure 6.16 Trends of Chlorophyll a in surface water layer of Saigon River
Figure 6.17 Hourly trends of chlorophyll a and water level
Figure 6.18 Hourly chlorophyll a at water intake from December 2006 to June 2008
Figure 6.19 Hourly turbidity at water intake from December 2006 to June 2008
Figure 6.20 Hourly trends of turbidity and water level at the Tan Hiep water intake
Figure 6.21 Water velocity distribution across the Saigon River
Figure 6.22 Flow direction and mean velocity monitored by ADCP on a ship across
the Saigon River
Figure 6.23 Mean flow of Saigon River at Hoa Phu water intake in January 2008
Figure 6.24 Relationship between the cross-sectional average velocity (Vc) and the
edge velocity (Vp) at Hoa Phu water intakes
Figure 6.25 Trends of cross-sectional average velocity and the edge velocity at the
Hoa Phu water intake
- xxiii -
136
138
143
149
149
151
152
153
153
154
154
155
156
156
160
161
162
162
163
163
164
165
166
167
167
167
168
168
LIST OF FIGURES (continued)
Title
Page
Figure 6.26 Relationship models of h-H and H-A at the Hoa Phu water intake
170
Figure 6.27 Comparison of the cross-sectional areas between SG15 and SG16
170
Figure 6.28 Time series velocity of the Saigon River at SG15 and SG16
171
Figure 6.29 Time series of the Saigon River flows at SG15 and SG16
172
Figure 6.30 Trends of water level and salinity (EC) in the Saigon River at Hoa Phu
water intakes in the dry season 2007
173
Figure 6.31 Hourly variations of water level and salinity at SG15 from 26 February
to 6 March 2007
174
Figure 6.32 Trends of water levels and salinity (EC) at Hoa Phu water intake in the
dry season 2008
175
Figure 6.33 Steps of ANN model development
180
Figure 6.34 Distribution of selected data set
181
Figure 6.35 Performance of training process of three ANN models
183
Figure 6.36 Correlation between measured data and ANN data in the training
process of Model ANN 4
185
Figure 6.37 Time series EC of measured data, ANN simulated and predicted data
186
Figure 6.38 Hourly variation of pH from December 2006 to April 2007
186
Figure 6.39 ANN-simulated data and measured data for cases of EC ≤ 0.5 mS/cm
187
Figure 6.40 ANN-simulated data and measured data for cases of EC > 0.5 mS/cm
187
Figure 6.41 ANN- predicted data of salinity (EC) in the Saigon River
188
Figure 6.42 Time series of ANN-predicted data and measured data of salinity in 2008 189
Figure 7.1 Summary of the significant findings of this study
198
- xxiv -
LIST OF ABBREVIATION AND NOMENCLATURES
Symbol
Description
AASS
ADCP
ADCP
ANN
ASS
ASTMD
BPA
BPNN
BVI
CGER
CR-WQME
DIN
DO
DOP
DT
DTIEC
EC
Fe
HCMC
IC
ICP
ICP-AES
IPHS
IRIS
IUWM
JICA
JICA
KDa
LA
LED
Mn
MOB
MONRE
MOS
MRB
MSE
NAS
NH4-N
NJDE
NO2-N
Actual acid sulfate soil
Acoustic doppler current profiler
Acoustic Doppler Current Profiler
Artificial Neural Network
Acid sulfate soil
Standard test method for shake extraction of solid waste
Back Propagation Algorithm
Back-propagation neural network
Binnie Black and Veatch
Commission on Geosciences environment and resource
continuous recording water-quality monitoring equipment
Dissolved inorganic nitrogen
Dissolve oxygen
Dissolved orthophosphate phosphorus
Dau Tieng
Dau Tieng Reservoir Irrigation and Exploitation Company
Electrical conductivity
Iron
Ho Chi Minh City
Ion chromatography
Institute for construction planning
Inductively coupled plasma atomic emission spectrometer
Institute of Public Health and Sanitation
Integrated risk information system
Integrated Urban Water Management
Japanese International Cooperation Agency
Japan International Cooperation Agency
kiloDalton
Load allocation
Light-emitting diode
Manganese
Manganese oxidizing bacteria
Ministry of natural resources and environment
Margin of safety
Manganese reducing bacteria
Mean Square error
National Academy of Sciences
Ammonia nitrogen
New Jersey Department of Environment
Nitrite nitrogen
- xxv -
LIST OF ABBREVIATION AND NOMENCLATURES
(continued)
Symbol
Description
NO3-N
NSP
NTU
OECD
ORP
PASS
PMI
PO4-P
PSP
RBB
RBC
RBL
RM
RMSE
RT
SAWACO
SDD
SDD
SDI
SG
SMCL
SO HCMC
SRHCM
TDS
ThT
TIN
TMDL
TMDL
TN
TN
TP
TP
UK
USA
USEPA
VIWASE
VND
VRSAP
VT
Nitrate nitrogen
Nonpoint source pollution
Nephelometric turbidity unit
Organization for economic cooperation and development
Oxidation reduction potential
Potential acid sulfate soil
Partial mutual information
Orthophosphate
Point source pollution
Rach Ba Bep
Rach Ba Co
Rach Ba Lua
Rach Mau
Root mean square error
Rach Tra
Saigon water supply company
Sechi disk depth
Sechi disk depth
Shoreline Development Index
Saigon
Secondary maximum contamination level
Ho Chi Minh City Statistic Office
Southern regional hydro-meteorological center
Total dissolved solids
Thi Tinh
Total inorganic nitrogen
Total Maximum Daily Load
Total maximum daily load
Total nitrogen
Total nitrogen
Total phosphorus
Total phosphorus
United Kingdom
United States of America
The United States Environmental Protection Agency
Vietnam water supply engineering
Vietnam Dong
Vietnam river system and plains
Vam Thuat
- xxvi -
LIST OF ABBREVIATION AND NOMENCLATURES
(continued)
Symbol
Description
WEPA
WHO
WLA
WTP
XRD
XRD
YSI
A
Ai
A1
Dm
DT
ECi
ECs
Eq.
H
H
In
K
L
M
N
Out
P
Pa
Pi
PSI
Q
Qa
Qout
qs
S
SR
Vc
Vp
vs
W
Water Environment Partnership in Asia
World Health Organization
Waste allocation load
Water Treatment Plant
Powder diffraction analysis
X-Ray diffraction
Yellow Spring Instrument
Cross-sectional area
Area of land use type i
Lake surface area
Mean depth
Detention time
Export coefficient for land use type i
Export coefficient of septic tank
Equation
Cross-sectional water level
Edge water level
Inflow
Equilibrium constant
Total phosphorus loading
Number of input nodes
Number of output nodes
Outflow
Steady-state total phosphorus concentration
Areal phosphorus loading
Average phosphorous concentration in inflow
Point source input
Average flow
Areal water load
Total outflow
Overflow rate
Settling rate
Soil retention coefficient
Cross-sectional average velocity
Edge velocity
Settling velocity
Total water volume
- xxvii -
LIST OF TABLES
Title
Page
Table 2.1 Cases of water quality problems and management in the Asian countries
11
Table 2.2 Summary of some characteristics of tropical lakes with their consequences
for the function of tropical lakes and management implications
14
Table 2.3 OECD and Carson index for trophic status assessment
16
Table 2.4 Loading rate for nitrogen and phosphorus in lakes and reservoir
20
Table 2.5 Empirical models between TP load and TP concentrations in lakes/reservoirs21
Table 2.6 Emerging problems caused by acid sulfate soils
25
Table 2.7 Concentrations of manganese and iron found in environments
27
Table 2.8 Application of neural network on water researches
42
Table 2.9 Advantages and disadvantages of ANN model and process-based model
45
Table 3.1 Designed, existing and extended capacity of Dau Tieng Reservoir
50
Table 3.2 Population, GDP and industrial development in the Saigon River Basin
52
Table 3.3 Number of industrial parks and their discharges into the Saigon River
53
Table 3.4 Population, population density and domestic discharges
53
3
Table 3.5 Monthly average flow (m /s) of Saigon River with regulated flow from the
Dau Tieng Reservoir
54
Table 3.6 Water level (m) at Phu An gauging station in 2004
54
Table 3.7 Water in selected Southeast Asia Cities
55
Table 3.8 Isohales of 1 ‰ and 4 ‰ in the Dong Nai and Saigon Rivers after operations
of Tri An, Thac Mo and Dau Tieng Reservoirs in the basin
60
Table 3.9 Water discharges from the Dau Tieng Reservoir for controlling salinity
63
Table 3.10 Physic-chemical properties of the synthetic Saigon River water
65
Table 3.11 Materials and methods used for water analysis in the research
66
Table 3.12 Parameter and analysis methods for soil and sediment samples
67
Table 3.13 Water quality parameters, measurement range, resolution and accuracy of
data loggers
71
Table 4.1 Main weather conditions and hydrology characteristics of the Dau Tieng
Reservoir
75
Table 4.2 Comparison of water quality of Dau Tieng, Tri An and Thac Mo Reservoirs
in the Dong Nai River Basin
79
Table 4.3 Land use distribution in Dau Tieng Reservoir Watershed
80
Table 4.4 Seasonal and average concentrations of main water quality parameters in
Dau Tieng Reservoir
84
- xiii -