chap09 hypothesis testing
Bạn đang xem bản rút gọn của tài liệu. Xem và tải ngay bản đầy đủ của tài liệu tại đây (1.81 MB, 56 trang )
Statistics for
Business and Economics
Chapter 9
Hypothesis Testing:
Single Population
Copyright © 2010 Pearson Education, Inc. Publishing as Prentice Hall
Ch. 9-1
9.1
n
What is a Hypothesis?
A hypothesis is a claim
(assumption) about a
population parameter:
n
population mean
Example: The mean monthly cell phone bill
of this city is µ = $42
n
population proportion
Example: The proportion of adults in this
city with cell phones is p = .68
Copyright © 2010 Pearson Education, Inc. Publishing as Prentice Hall
Ch. 9-2
The Null Hypothesis, H0
n
States the assumption (numerical) to be
tested
Example: The average number of TV sets in
household is equal to three ( H0 : µ = 3 )
n
Is always about a population parameter,
not about a sample statistic
H0 : µ = 3
Copyright © 2010 Pearson Education, Inc. Publishing as Prentice Hall
H0 : X = 3
Ch. 9-3
The Null Hypothesis, H0
(continued)
Begin with the assumption that the null
hypothesis is true
n Similar to the notion of innocent until
proven guilty
n Refers to the status quo
n Always contains “=” , “≤” or “≥” sign
n May or may not be rejected
n
Copyright © 2010 Pearson Education, Inc. Publishing as Prentice Hall
Ch. 9-4
The Alternative Hypothesis, H1
n
Is the opposite of the null hypothesis
n
n
n
n
n
e.g., The average number of TV sets in U.S.
homes is not equal to 3 ( H1: µ ≠ 3 )
Challenges the status quo
Never contains the “=” , “≤” or “≥” sign
May or may not be supported
Is generally the hypothesis that the
researcher is trying to support
Copyright © 2010 Pearson Education, Inc. Publishing as Prentice Hall
Ch. 9-5
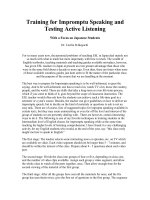
Hypothesis Testing Process
Claim: the
population
mean age is 50.
(Null Hypothesis:
H0: µ = 50 )
Population
Is X= 20 likely if µ = 50?
If not likely,
REJECT
Null Hypothesis
Copyright © 2010 Pearson Education, Inc. Publishing as Prentice Hall
Suppose
the sample
mean age
is 20: X = 20
Now select a
random sample
Sample
Ch. 9-6
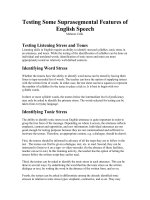
Reason for Rejecting H0
Sampling Distribution of X
20
If it is unlikely that
we would get a
sample mean of
this value ...
µ = 50
If H0 is true
... if in fact this were
the population mean…
Copyright © 2010 Pearson Education, Inc. Publishing as Prentice Hall
X
... then we
reject the null
hypothesis that
µ = 50.
Ch. 9-7
Level of Significance, α
n
Defines the unlikely values of the sample
statistic if the null hypothesis is true
n
n
Defines rejection region of the sampling
distribution
Is designated by α , (level of significance)
n
Typical values are .01, .05, or .10
n
Is selected by the researcher at the beginning
n
Provides the critical value(s) of the test
Copyright © 2010 Pearson Education, Inc. Publishing as Prentice Hall
Ch. 9-8
Level of Significance
and the Rejection Region
Level of significance =
H 0: µ = 3
H 1: µ ≠ 3
α/2
Two-tail test
α/2
Represents
critical value
Rejection
region is
shaded
0
H 0: µ ≤ 3
H 1: µ > 3
α
Upper-tail test
H 0: µ ≥ 3
H 1: µ < 3
α
0
α
Lower-tail test
Copyright © 2010 Pearson Education, Inc. Publishing as Prentice Hall
0
Ch. 9-9
Errors in Making Decisions
n
Type I Error
n Reject a true null hypothesis
n Considered a serious type of error
The probability of Type I Error is α
n
Called level of significance of the test
n
Set by researcher in advance
Copyright © 2010 Pearson Education, Inc. Publishing as Prentice Hall
Ch. 9-10
Errors in Making Decisions
(continued)
n
Type II Error
n Fail to reject a false null hypothesis
The probability of Type II Error is β
Copyright © 2010 Pearson Education, Inc. Publishing as Prentice Hall
Ch. 9-11
Outcomes and Probabilities
Possible Hypothesis Test Outcomes
Actual Situation
Key:
Outcome
(Probability)
Decision
H0 True
Do Not
Reject
H0
No Error
(1 - α )
Type II Error
(β)
Reject
H0
Type I Error
(α)
No Error
(1-β)
Copyright © 2010 Pearson Education, Inc. Publishing as Prentice Hall
H0 False
Ch. 9-12
Type I & II Error Relationship
§ Type I and Type II errors can not happen at
the same time
§ Type
I error can only occur if H0 is true
§ Type
II error can only occur if H0 is false
If Type I error probability ( α )
, then
Type II error probability ( β )
Copyright © 2010 Pearson Education, Inc. Publishing as Prentice Hall
Ch. 9-13
Factors Affecting Type II Error
n
All else equal,
n
β
when the difference between
hypothesized parameter and its true value
n
β
when
α
n
β
when
σ
n
β
when
n
Copyright © 2010 Pearson Education, Inc. Publishing as Prentice Hall
Ch. 9-14
Power of the Test
n
n
The power of a test is the probability of rejecting
a null hypothesis that is false
i.e.,
n
Power = P(Reject H0 | H1 is true)
Power of the test increases as the sample size
increases
Copyright © 2010 Pearson Education, Inc. Publishing as Prentice Hall
Ch. 9-15
Hypothesis Tests for the Mean
Hypothesis
Tests for à
Known
Copyright â 2010 Pearson Education, Inc. Publishing as Prentice Hall
σ Unknown
Ch. 9-16
Test of Hypothesis
for the Mean (σ Known)
9.2
n
Convert sample result ( x ) to a z value
Hypothesis
Tests for µ
σ Known
σ Unknown
Consider the test
H 0 : µ = µ0
H1: µ > µ 0
(Assume the population is normal)
Copyright © 2010 Pearson Education, Inc. Publishing as Prentice Hall
The decision rule is:
Reject H 0 if z =
x − µ0
≥ zα
σ/ n
Ch. 9-17
Decision Rule
x − µ0
Reject H 0 if z =
≥ zα
σ/ n
H0: µ = µ0
H1: µ > µ0
Alternate rule:
α
Reject H 0 if x ≥ µ 0 + Zα σ / n
Z
x
Copyright © 2010 Pearson Education, Inc. Publishing as Prentice Hall
Do not reject H0
0
µ0
zα
µ0 + z α
Reject H0
σ
n
Critical value x c
Ch. 9-18
p-Value Approach to Testing
n
p-value: Probability of obtaining a test
statistic more extreme ( ≤ or ≥ ) than the
observed sample value given H0 is true
n
n
Also called observed level of significance
Smallest value of α for which H0 can be
rejected
Copyright © 2010 Pearson Education, Inc. Publishing as Prentice Hall
Ch. 9-19
p-Value Approach to Testing
(continued)
n
n
n
Convert sample result (e.g., x ) to test statistic (e.g., z
statistic )
Obtain the p-value
n For an upper
x − µ0
p-value = P(z ≥
, given that H 0 is true)
tail test:
σ/ n
x − µ0
= P(z ≥
| µ = µ0 )
σ/ n
Decision rule: compare the p-value to α
n
If p-value ≤ α , reject H0
n
If p-value > α , do not reject H0
Copyright © 2010 Pearson Education, Inc. Publishing as Prentice Hall
Ch. 9-20
Example: Upper-Tail Z Test
for Mean (σ Known)
A phone industry manager thinks that
customer monthly cell phone bill have
increased, and now average over $52 per
month. The company wishes to test this
claim. (Assume σ = 10 is known)
Form hypothesis test:
H0: µ ≤ 52 the average is not over $52 per month
H1: µ > 52
the average is greater than $52 per month
(i.e., sufficient evidence exists to support the
manager’s claim)
Copyright © 2010 Pearson Education, Inc. Publishing as Prentice Hall
Ch. 9-21
Example: Find Rejection Region
(continued)
n
Suppose that α = .10 is chosen for this test
Find the rejection region:
Reject H0
α = .10
Do not reject H0
0
1.28
Reject H0
x − µ0
Reject H 0 if z =
≥ 1.28
σ/ n
Copyright © 2010 Pearson Education, Inc. Publishing as Prentice Hall
Ch. 9-22
Example: Sample Results
(continued)
Obtain sample and compute the test statistic
Suppose a sample is taken with the following
results: n = 64, x = 53.1 (σ = 10 was assumed known)
n
Using the sample results,
z =
x à0
n
Copyright â 2010 Pearson Education, Inc. Publishing as Prentice Hall
=
53.1 − 52
10
= 0.88
64
Ch. 9-23
Example: Decision
(continued)
Reach a decision and interpret the result:
Reject H0
α = .10
Do not reject H0
1.28
0
z = 0.88
Reject H0
Do not reject H0 since z = 0.88 < 1.28
i.e.: there is not sufficient evidence that the
mean bill is over $52
Copyright © 2010 Pearson Education, Inc. Publishing as Prentice Hall
Ch. 9-24
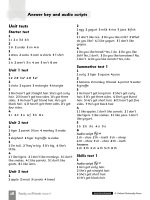
Example: p-Value Solution
Calculate the p-value and compare to α
(continued)
(assuming that µ = 52.0)
p-value = .1894
P(x ≥ 53.1 | µ = 52.0)
Reject H0
α = .10
0
Do not reject H0
1.28
Z = .88
Reject H0
53.1 − 52.0 ⎞
⎛
= P⎜ z ≥
⎟
10/ 64 ⎠
⎝
= P(z ≥ 0.88) = 1− .8106
= .1894
Do not reject H0 since p-value = .1894 > α = .10
Copyright © 2010 Pearson Education, Inc. Publishing as Prentice Hall
Ch. 9-25