Simulation and evaluation of odor pollution from da phuoc landfills in ho chi minh city masters thesis major sciences and management of the environment
Bạn đang xem bản rút gọn của tài liệu. Xem và tải ngay bản đầy đủ của tài liệu tại đây (4.36 MB, 122 trang )
THE JOINT ACADEMIC PROGRAM OF EXECUTIVE MASTER IN
SCIENCES AND MANAGEMENT OF THE ENVIROMENT
BETWEEN INDUSTRIAL UNIVERSITY OF HOCHIMINH CITY
AND LIÈGE UNIVERSITY
TA QUANG
SIMULATION AND EVALUATION OF ODOR
POLLUTION FROM DA PHUOC LANDFILLS
IN HO CHI MINH CITY
Major: EXECUTIVE MASTER IN SCIENCES AND MANAGEMENT OF
THE ENVIRONMENT
MASTER’S THESIS
HO CHI MINH CITY, YEAR 2018
ACKNOWLEDGEMENTS
To complete the master thesis topic, I would like to thank the school board, Graduate
School of Ho Chi Minh City University of Industry, teachers Institute of Environment,
together Teachers in various disciplines have enthusiastically taught and equipped me
with knowledge during my studies.
I would like to thank my advisor, Dr. Luong Van Viet for his support and advice
throughout this thesis. I would also like to thank professor of university de liege for
taught and supported me during my studies.
Lastly but most importantly I would like to thank my parents for bringing me into this
world and supporting me in every way possible. Without them I would not be the man I
am today.
Although there are many attempts to complete the topic. But due to the early learning in
scientific research, access to reality as well as knowledge is limited and lack of
experience should not be avoided shortcomings. I look forward to the comments of
teachers and friends to complete the thesis.
Author
Ta Quang
1
ABSTRACT
Odor,which refers to unpleasant smells, is nowadays considered an inportant
enviroment pollution issue. Odor pollution abatement has involves a number of bodies.
In this thesis, odor pollution in the inviroment will be reviewed, including its sources
and dispersion, the plysical and chemical properties of odor, odor emission from Da
Phuoc landfill in Ho Chi Minh city. Determining the pollutant load from which the
intensity of the odor gas is calculated. Simulate the spread of odor pollution and
evaluate to give the measures of reduction.
Keyword: odor, odor pollution, olfactometry, pollution load (NH3, H2S,CH3SH), EGauss,Arcgis.
2
TABLE OF CONTENTS
LIST OF TABLES ........................................................................................................... 5
LIST OF FIGURES .......................................................................................................... 8
LIST OF ABBREVIATIONS ........................................................................................ 10
INTRODUCTION .......................................................................................................... 11
1. The reason for choosing the topic ........................................................................... 11
2. Objectives of the study ............................................................................................ 12
3. Object and area of the study .................................................................................... 12
4. The methodology .................................................................................................... 13
5. The meaning of the topic ......................................................................................... 13
CHAPTER 1 OVERVIEW OF THE FIELD OF THE STUDY ................................... 14
1.1 Overview of Ho Chi Minh City ............................................................................ 14
1.1.1 Natural condition ........................................................................................... 14
1.1.1.1 Geography ............................................................................................. 14
1.1.1.2 Hydrogeology ........................................................................................ 14
1.1.1.3 Climate, weather .................................................................................... 15
1.1.2 Social and economic conditions ...................................................................... 15
1.1.2.1 Economic growth ................................................................................... 15
1.1.2.2 Characteristics of population, society .................................................... 15
1.2 Overview of domestic solid waste and solid waste management in HCM city .... 16
1.2.1 Situation of domestic solid waste generation .................................................. 16
1.2.2 Volume and composition of the domestic solid waste .................................... 16
1.2.3 Current status of collection and transportation of the domestic solid waste .. 20
1.2.3.1 Collection time ...................................................................................... 20
1.2.3.2 Means of collection ............................................................................... 20
1.2.3.3 Save at source ......................................................................................... 20
1.2.3.4 Collector at source .................................................................................. 21
1.2.3.5 Collected at intended destinations (on the street) .................................. 22
1.2.3.6 Commercial Transfer Station ................................................................. 22
1.2.3.7 Transportation network .......................................................................... 23
3
1.2.4 Purchasing and recycling of the solid waste ................................................... 24
1.2.4.1 Reusing and recycling ............................................................................ 24
1.2.4.2 Scrap collection facalities ...................................................................... 24
1.2.4.3 Purchasing activity ................................................................................. 25
1.2.5 Treating and landfilling of the domestic solid waste ...................................... 26
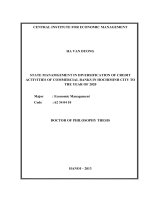
1.3 Overview of Da Phuoc Solid Waste Treatment Complex ..................................... 27
1.4 Components and process of forming foul odor gases from landfill sites .............. 33
1.4.1 Components of odor gases from landfill sites ................................................. 33
1.4.2 Process of forming gases from landfill site ..................................................... 34
1.4.3 Source causing foul odor from landfill sites .................................................. 38
1.5 Method of assessment and odor meter .................................................................. 38
1.5.1 The nature of the odor ..................................................................................... 39
1.5.2 Measurement of odor by the olfactory sensitivity method ............................. 43
1.5.3 Measurement of odor by Electronic nose (E-nose) ......................................... 45
1.5.4 Relationship between odor intensity and odor concentration ......................... 45
CHAPTER 2 RESEARCH METHOD AND CONTENTS ......................................... 49
2.1 Situation of research on the spread of odor pollution ........................................... 49
2.1.1 Abroad research situation. ............................................................................... 49
2.1.2 Domestic research situation ............................................................................ 50
2.2 Research contents .................................................................................................. 51
2.3 Research methods .................................................................................................. 53
2.3.1 Statistical methods .......................................................................................... 53
2.3.2 GIS-RS method ............................................................................................... 53
2.3.3 Method of determining the intensity of odor .................................................. 54
2.2.4 Method of determining the amount of odor pollutant load ............................. 55
2.3.5 Process of simulating odor pollution .............................................................. 62
CHAPTER 3 CHARACTERISTICS OF CLIMATE AND CIRCULATION IN HO
CHI MINH CITY ........................................................................................................... 65
3.1 Characteristics of climate in studied area ............................................................. 65
3.1.1 Rainfall ........................................................................................................... 65
4
3.1.2 Temperature .................................................................................................... 68
3.1.3 Relative humidity ............................................................................................ 70
3.2 Wind speed and direction ...................................................................................... 72
CHAPTER 4 RESEARCH RESULTS AND DISCUSSION ...................................... 76
4.1 Analysis of opinion survey .................................................................................... 76
4.2 Garbage formula in Da Phuoc landfill site ............................................................ 80
4.3 The results determine the amount of odor gas ...................................................... 82
4.3.1 Loading of NH3 ............................................................................................... 83
4.3.2 Loading of H2S and MER ............................................................................... 87
4.4 Results of the odor intensity equation ................................................................... 92
4.5 The level of odor pollution around the landfill site through simulation results ... 93
4.3.1 The level of odor pollution through the dry season ........................................ 93
4.3.2 The level of odor pollution through the rainy season ..................................... 96
4.3.3 The level of odor pollution during the transition from dry to rainy season. ... 99
4.4.4 The level of odor pollution during the transition from rainy to dry season .. 102
4.5 Proposing a plan to reduce odor pollution from the landfill site ....................... 105
4.5.1 Proposed scenarios ........................................................................................ 105
4.5.2 Analysis of pollution mitigation through scenarios ...................................... 108
4.5.2.1 Scenarios 1 (Reduce 50% of the pollutant load) .................................. 108
4.5.2.2 Scenarios 2 (Reduce 50% of the pollutant load) .................................. 110
4.5.2.3 Scenarios 3 (Reduce 70% of the pollutant load) .................................. 111
4.5.3 Suggestions for reduction of pollution load .................................................. 113
CONCLUSION & RECOMMENDATION ................................................................ 117
REFERENCES .............................................................................................................. 118
APPENDIX ................................................................................................................... 120
5
LIST OF TABLES
Table 1.1 Composition of solid wastefrom households, schools, restaurants and hotels in
Ho Chi Minh City ........................................................................................................... 17
Table 1.2 Compsition of solid waste at Đa Phuoc and Phuoc Hiep landfill site ........... 19
Table 1.3 Composition and volume of solid waste at purchasing and recycling facilities
........................................................................................................................................ 25
Table 1.4 Domestic solid waste disposal and treatment plants are in operation ............ 26
Table 1.5 Volume of solid waste collected at Da Phuoc landfill ................................... 31
Table 1.6 Componentsof gases from landfill sites by percentage by dry volume ......... 33
Table 1.7 The effect of hydro sulfua gas on humans ..................................................... 39
Table 1.8 The effect of SO2 gas on humans ................................................................... 40
Table 1.9 The effect of NH3 gas on humans .................................................................. 41
Table 1.10 Scale of 4 on assessment of odor intensity .................................................. 43
Table 1.11 Scale of 6 on assessment of odor intensity .................................................. 43
Table 1.12 Odor threshold of H2S .................................................................................. 46
Table 2.1 The value of k for tropical regions ................................................................. 59
Table 3.1 Average monthly rainfall in Tan Son Hoa station (mm) ............................... 65
Table 3.2 Monthly statistics of Tan Son Hoa station (0C) ............................................. 68
Table 3.3 Monthly humidityof Tan Son Hoa station (%) .............................................. 71
Table 3.4 Frequency of wind direction of Tan Son Hoa station (%) ............................. 73
Table 3.5 Average wind speed of Tan Son Hoa station (m/s) ....................................... 74
Table 3.6 Average wind speed and standard deviation of Tan Son Nhat station .......... 75
Table 4.1 Odor sign in the questionnaire ....................................................................... 76
Table 4.2 Frequency of occurrence of odors over time in Nhon Duc commune (%) .... 79
Table 4.3 Frequency of occurrence of odors over time in Đa Phuoc commune (%) ..... 79
Table 4.4 Composition of solid waste is capable of decomposing at Da Phuoc
landfillsites ..................................................................................................................... 80
Table 4.5 The composition of domestic solid waste ...................................................... 81
Table 4.6 The composition of domestic solid waste in Da Phuoc landfill sites ............ 81
Table 4.7 Data on NH3, H2S and MER emissions of Da Phuoc landfill site on average
dry season and rainy season (tons/month) ..................................................................... 83
Table 4.8 Coefficient k in calculated emissions of NH3 ................................................ 85
Table 4.9 The result of monthly and seasonal NH3 emission in Da Phuoc landfill site
(ton/month) ..................................................................................................................... 87
Table 4.10 Coefficient k in calculated emissions H2S and CH3SH .............................. 88
Table 4.11 The results of average monthly and seasonal H2S emission at Da Phuoc
landfill site (tons /month) .............................................................................................. 90
6
Table 4.12 The results of average monthly and seasonal CH3SH emission at Da Phuoc
landfill site (tons /month) .............................................................................................. 91
Table 4.13 The results of H2S and CH3SH emission at Da Phuoc landfill in 2016
(mg/m2.h) ........................................................................................................................ 92
Table 4.14 Data on the concentration of odors and odor levels ..................................... 92
Table 4.15 Frequency of occurrence of odors at the ward level during the dry season(%)
......................................................................................................................................... 96
Table 4.16 Frequency of occurrence of odors at the ward level during the rainseason(%)
......................................................................................................................................... 99
Table 4.17 Frequency of odors occurring at commune and ward levels during
transitionfrom dry to rainy season (%) ........................................................................ 102
Table 4.18 Frequency of odors occurring at commune and ward levels during transition
from rainy to dry season (%). ...................................................................................... 105
Table 4.19 Frequency ofl odor in communes with Scenario 0 (%) ............................. 108
Table 4.20 Frequency of level odor with KB 1 and the decrease compared to KB 0 (%) .
....................................................................................................................................... 109
Table 4.21 Frequency of level odor with KB 2 and the decrease compared to KB 0 (%) .
....................................................................................................................................... 111
Table 4.22 Frequency of level odor with KB3 and the decrease compared to KB 0 (%) ..
....................................................................................................................................... 112
7
LIST OF FIGURES
Figure 1.1 Da Phuoc Solid Waste Treatment Complex ................................................. 27
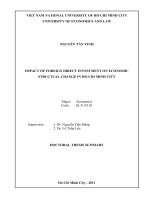
Figure 1.2 The system of reservoirs and leachate treatment .......................................... 30
Figure 1.3 Olfactometry ................................................................................................. 42
Figure 1.4 Relationship between odor concentration and odor intensity of Butanol and
Hydrogen Sulphide ........................................................................................................ 47
Figure 3.1 Average surface temperature of Tan Son Hoa station (oC) .......................... 69
Figure 3.2 High temperature on Tan Son Hoa station (oC) ............................................ 70
Figure 3.3 Average humidity of Tan Son Hoa station, 2 m height (%) ......................... 71
Figure 3.4 Wind at 10m in Tan Son Hoa station ........................................................... 72
Figure 3.5 The prevailing wind speed and average wind speed of Tan Son Nhat station..
......................................................................................................................................... 74
Figure 3.6 Wind direction and average wind speed on the elevation of Tan Son Hoa
station ............................................................................................................................. 75
Figure 4.1 Percentage of time people live in their current place of residence ............... 76
Figure 4.2 Odor sensitivity level .................................................................................... 77
Figure 4.3 Feel about the characteristic odors ............................................................... 79
Figure 4.4 Relationship between monitoring data and NH3 emission calculation ........ 86
Figure 4.5 Relationship between monitoring data and calculation of H2S emission ..... 89
Figure 4.6 Relationship between monitoring data and calculation of CH3SH emission.....
........................................................................................................................................ 90
Figure 4.7 Frequency of first class odor in dry months ................................................. 94
Figure 4.8 Frequency of third level odor in dry months ................................................ 94
Figure 4.9 Frequency of secondary level odor in dry months ....................................... 95
Figure 4.10 Frequency of fourth level odor in dry months ............................................ 95
Figure 4.11 Frequency of first class odor in the rainy season (%) ................................ 97
Figure 4.12 Frequency of third class odor in the rainy season (%) ............................... 97
Figure 4.13 Frequency of secondary class odor in rainy season (%) ............................. 98
Figure 4.14 Frequency of fourth class odor in the rainy season (%) ............................. 98
Figure 4.15 Frequency of first level odor in the transition months from dry to rainy
season (%) .................................................................................................................... 100
Figure 4.16 Frequency of first level odor in the transition months from dry to rainy
season (%) .................................................................................................................... 100
Figure 4.17 Frequency of third level odor in the transition months from dry to rainy
season (%) .................................................................................................................... 101
Figure 4.18 Frequency of fourth level odor in the transition months from dry to rainy
season (%) .................................................................................................................... 101
8
Figure 4.19 Frequency of first level odor in the transition months from rain to dry
season (%) .................................................................................................................... 103
Figure 4.20 Frequency of second level odor in the transition months from rain to dry
season ........................................................................................................................... 103
Figure 4.21 Frequency of third level odor in the transition months from rain to dry
season (%) .................................................................................................................... 104
Figure 4.22 Frequency of foutth level odor in the transition months from rain to dry
season (%) .................................................................................................................... 104
Figure 4.23 Frequency of second level odor with Scenario 0 (%) ............................... 107
Figure 4.24 Frequency of third level odor with Scenario 0 (%) .................................. 107
Figure 4.25 Frequency of second level odor with Scenario 1 (%) ............................... 108
Figure 4.26 Frequency of third level odor with Scenario 1 (%) .................................. 109
Figure 4.27 Frequency of second level odor with Scenario 2 (%) ............................... 110
Figure 4.28 Frequency of third level odor with Scenario 2 (%) .................................. 110
Figure 4.29 Frequency of third level odor with Scenario 3 (%) .................................. 111
Figure 4.30 Frequency of third level odor with Scenario 3 (%) .................................. 112
Figure 4.31 Vertical wells ............................................................................................ 116
Figure 4.32 Horizontal wells ........................................................................................ 116
9
LIST OF ABBREVIATIONS
CAPE
Convective Available Potential Energy
EPA
US Environmental Protection Agency
GIS-RS
Geographic information system
I
Odour Intensity
ITCZ
The Inter Tropical Convergence Zone
MER
Methyl Mercaptan
OSHA
The Occupational Safety and Health Administration, U.S.
Department of Labor
Ou
Odor unit
Pt
Perception Threshold
TNHH MTV
One-member limited liability
UBND
People's Committee
WVS
Waste Vietnam Solution
10
INTRODUCTION
1. The reason for choosing the topic
In the strategy of industrialization and modernization of the country by the Party and the
Government set out and by the National Assembly through in the strategy for socioeconomic development, 10-year period from 2011 to 2020, important goal is to develop
faster and stronger to increase the contribution of the industry, construction and services
in the economy structure [1]. The manufacturing business service in urban areas;
industry zones (IZ) have increasingly expansion and development has spurred the
growth of the economy - society. Economic growth - social contribute positively to the
development of the country, on the other hand gave increase to solid waste (SW) and
more (include municipal solid waste, industrial solid waste, medical solid waste,...). The
disposal indiscriminate and the lack management of uniformity of the authorities,... is
one of the causes of environmental pollution, spread of diseases, affecting the health
and human life.
Our country is one of the countries with the highest population density in the world with
a population ranks 3rd in Southeast Asia, 14th in the world. The process of rapid
population growth led to demands for housing, healthcare, transportation,... increasing
pressure on the natural environment and social environment. Load capacity of the
natural environment is limited, when the amount of waste not been disposal increase
being discharged into the environment would exceed the self-cleaning ability of the
natural environment, cause environmental pollution. Municipal solid waste mainly
domestic solid waste accounting for about 60-70% of the solid waste generated,
followed by the construction of solid waste, industrial solid waste, medical solid waste,..
The collection rate of domestic solid waste, services and industries today has increased
significantly in urban areas is 83-84%, however not meet the actual needs. Beside, the
majority of domestic solid waste had unclassified and transported to landfills. It is this
that the disposal of solid waste in Vietnam living complex than advanced countries.
Therefore, the solid waste is one of the main reasons, pollute surface water, air, soil,
11
urban landscape and the adverse impact on the community. This time, separately in Ho
Chi Minh City receiving more than 7,500 tons of solid waste / day, which makes the
landfills become overloaded and not guaranteed to be the issues related to the
environment. The solution for the management of landfills just focus on the problem of
leachate, collapse or subsidence, groundwater... The study on air pollution has formed
the foundation but have not been applied in practice.. Especially odor pollution, the
problem is not interested in the EIA report, The annual environmental report. So, when
planning the landfill sites were met with opposition from people around.
From these issues, topic: "Simulation and evaluation of odor pollution from Da Phuoc
landfills in Ho Chi Minh City" to be studied in order to make the assessment, long-term
solution to the problem of odors from the landfill sites in the city.
2. Objectives of the study
2.1 General Objective
Applying simulation software spreads the odor pollution from the Da Phuoc landfill
activities serve tge assessement, planning and management of solid waste.
2.2 Spectific Objectives
Determine the natural conditions, terrain meteorological survey area..
Odor level determination based on the components related pollution for assessing
pollution levels and simulated smells odors.
Determine the load of pollutants related to odor and serving smell spread simulation.
Applying the model to spread the smell: Mapping the spread of odor simulation based
on odor pollution levels.
3. Object and area of the study
3.1 Objectives
- Odor pollution from Da Phuoc landfill
- Model of odor diffusion in the air
12
- Areas affected by odor arising from Da Phuoc landfill
3.2 Area study
Da Phuoc solid waste complex is located in the south of hamlet 1 and hamlet 2 of Da
Phuoc commune in Binh Chanh district
4. The methodology
- Statistical methods
- Method of determining the intensity of odor
- Method of determining the amount of odor pollutant load
5. The meaning of the topic
5.1 Scientific significance
The research was based on the scientific basis, approaching the object through
investigation, survey and analysis, and then assess the extent of odor spread at the Da
Phuoc landfill to the residential areas surrounding the landfill site and propose
appropriate solutions for mitigation and protection of the environment.
5.2 Practical significance
The study was conducted to assess the spread of odor pollution and to propose remedies
and mitigation measures. This will create favorable conditions for industrial and
agricultural production of people in the area and ensure the living of people in the area
surrounding the Da Phuoc landfill.
13
CHAPTER 1 OVERVIEW OF THE FIELD OF THE STUDY
1.1 Overview of Ho Chi Minh City
1.1.1 Natural condition
1.1.1.1 Geography
Coordinating location of Ho Chi Minh City:
- North latitude: 10°10' – 10°38' North
- East longitude: 106°22' – 106°54' East
Ho Chi Minh City is located in the south-eastern region of Vietnam, 1,760 km
(1,090 mi) south of Hanoi. The average elevation is 19 metres (62 ft) above sea level. It
borders:
- The north borders with Tây Ninh Province and Bình Dương Province;
- The east borders with Đồng Nai Province and Bà Rịa–Vũng Tàu Province ;
- The west borders with Long An Province ;
- The south borders with The East Sea;
With its central location in Southeast Asia, Ho Chi Minh City is an important transport
hub for both land, water and air, connecting the provinces in the region and also as an
international gateway.[1]
1.1.1.2 Hydrogeology
Geology of Ho Chi Minh City consists mainly of two generations of Pleistocene and
Holocene sediments exposed on the surface. Pleistocene sediments occupy most of the
North, Northwest and Northeast of the city. Under the influence of natural factors and
human activities, alluvial sediment formation forming specific soil group: gray soil..
With more than 45 thousand hectares, or about 23.4% of the city, the gray soil in Ho
Chi Minh City has three types: gray soil, gray soil with reddish-brown and reddish-gray
soil.[2]
On hydrography, Ho Chi Minh City located in the downstream of Dong Nai river
14
system - Sai Gon. Ho Chi Minh City have many different rivers and canals. Dong Nai
River originates from the Lam Vien plateau, confluence with many other rivers, with
large basins, about 45,000 km². With an average flow of 20-500 m³/s, annually provides
15 billion m³ of water, Dong Nai River becomes the main freshwater source of the
city. The Saigon river originates from the area of Hon Quan district, flowing through
Thu Dau Mot to Ho Chi Minh City. It has a length of 200 km and runs along the city
about 80 km.[3]
1.1.1.3 Climate, weather
Located in the tropical savanna, Ho Chi Minh City has only two seasons: rainy season –
dry season. The rainy season starts from May to November (hot and humid climate, low
temperature, heavy rain), and dry season from December to April next year (dry
climate, high temperature and low rainfall). Average, Ho Chi Minh City has 170 to 275
hours of sunshine per month, average temperature is 28.7 °C, highest temperature is
32 °C, lowest temperature is 25 °C. Every year, the city has 330 days average
temperature 25-28 °C. Average rainfall of the city reached 1,760 mm/year.[4]
Ho Chi Minh City is affected by two main winds are the southwest monsoon southwest and north - northeast. West-Southwest wind from the Indian Ocean, average
speed is 3.6 m/s in rainy season. North-East wind from the East Sea average speed 2.4
m/s in the dry season. There is also a south-southeastern trade wind around March to
May, average speed is 3.7 m/s. It can be said that Ho Chi Minh City is not a wind storm.
1.1.2 Social and economic conditions
1.1.2.1 Economic growth
HCMC plays a leading role in Vietnam's economy. In the first 6 months of 2016, Gross
domestic product GRDP was about 476,988 billions VND, an increase of 7.47% over
2015, in which the service reaches 53,9 %, industry and construction increased by
29.3%, agriculture reached 0.6%. Per capital income reached 5,428 USD.[5]
1.1.2.2 Characteristics of population, society
15
In 2016, the average population in HCMC estimated to be 8.426,1 thousands of people,
an increase of 2.16% over 2015 [6]. The distribution of people in HCMC is uneven.
While districts such as districts 4, 5, 10 and 11 have a density of over 40,000
persons/km² and
Can Gio district has a relatively low population density of
98 persons/km². In recent years, The population of central districts tends to decrease,
while the population of new districts is rising rapidly. Estimated in 2005, there are about
1 million visitors per day in HCM City. By 2015, this figure could increase to 2
million.[7]
1.2 Overview of domestic solid waste and solid waste management in HCM city
1.2.1 Situation of domestic solid waste generation
Ho Chi Minh City is a large urban area with high annual domestic solid waste
generation. The volume of domestic solid waste generated in HCMC is shown in Table
1.1. According to this table, the volume of municipal solid wastes is rather highthe
average annual increase in the period 2000-2015 is 7.22%.
According to the Department of Natural Resources and Environment, total volume of
daily-life waste arising in HCM city is estimated at 7,500 - 8,000 tons/day ( 2,7-2,9
million tons/year). With the volume of collection and transportation to the landfill about
7000 – 7.200 tons/day, the rest is solid waste for recycling. Only a small part, mainly
organic waste discharged to the field in the suburbs. Comparisons of the volume of
daily-life solid waste generated are calculated according to the population figures
coefficients of solid wastes (kg/person) and the volume of solid wastes are collected and
processed by weighing stations at solid waste treatment complexes over the years
showed: The rate of collection and treatment of domestic solid waste is approximately
85% in 2014, 85,3% in 2015 and 100% in 2016.[8]
1.2.2 Volume and composition of the domestic solid waste
Domestic solid waste generated mainly from the following sources: residential area,
commercial area, offices, hospital, schools, construction, public works, factory,
agricultural activities. Composition of domestic solid waste at sources such as
16
household, schools, restaurants, hotels in HCMC is analyzed in table 1.1.
Table 1.1 Composition of solid wastefrom households, schools, restaurants and hotels in
Ho Chi Minh City[9]
No.
Households
Schools
Restaurants and
hotels
% (ww)
% (ww)
% (ww)
Composition
1
Food
61,0 – 96,6
23,5 – 75,8
79,5 – 100
2
Nylon
KĐK – 13,0
8,5 – 34,4
KĐK – 5,3
3
Plastic
0,5 – 10,0
3,5 – 18,9
KĐK – 6,0
4
Fabric
1,0 – 5,1
1,0 – 3,1
-
5
Soft plastic
KĐK – 0,3
-
-
6
Fard plastic
KĐK – 2,8
-
-
7
Wood
0,7 – 3,1
-
-
8
Molded foam
KĐK – 1,3
1,0 – 2,0
KĐK – 2,1
9
Paper
0,7 – 14,2
1,5 – 27,5
KĐK – 2,8
10
Glass
1,65 – 4,0
KĐK – 2,5
KĐK – 1,0
11
Metal
0,9 – 3,3
KĐK
-
12
Rubber
-
KĐK – 4,2
-
13
Soil
KĐK – 10,5
-
-
14
Porcelain
KĐK – 3,6
-
-
15
Carton
KĐK – 0,6
-
KĐK – 0,5
16
Can
0,98 – 2
-
-
17
Cell
-
-
-
18
Cotton
KĐK – 2,0
-
-
19
Bamboo, straw
1 – 2,0
-
-
20
Shellfish, animal bones
Nothing – 9,0
-
-
Note:
- KĐK: Nothing < 0,5%;
- ww – wet weight
17
- “-“ – Unknown
Households: Composition of solid waste accounted for most of is the food (The average
value on the sample is 61 – 96 %), Nylon (0,5 – 13,0%), nhựa plastic (0,5 – 10,0%),
paper (0,7 – 14,2%), glass (1,7 – 4,0%), fabric (1,0 – 5,1%), debris and leaves (1 – 2%),
can (0,98 – 2,30%), wood (0,7 – 3,1%) [9]. Special, Carton hardly appears in samples of
solid waste from households. Data on solid waste composition of households showed
that although households now classify waste for reuse but the waste can be recycled still
much. However, most recyclable components are often contaminated and have high
humidity.
Schools: Data analysis of solid waste generated from the school shows components
garbage can recycle a high percentage, ssuch as nylon (8,5 – 34,4%), plastic (3,5 –
18,9%) and paper(1,5 – 27,5%) [9]. The percentage of components varies depending on
the student's grade level and mode of activity (boarding school, day-boarding school...).
In the solid waste samples were analyzed activities in schools, The highest percentage
of food waste at boarding schools occupy (23,5 – 75,8%), The other schools have
smaller proportions (23,5 – 32,5%) [9]. In addition, when comparing the percentage of
solid waste discharged from schools compared to households and markets, day-boarding
schools have the same percentage of solid waste as those of the household.
Restaurants, Hotels: Depending on the size and management, composition of solid
waste of the restaurant and the hotel varies greatly. For the hotels with large size or
restaurants almost all solid waste has been classified before being discharged. While
hotels are small in size, solid waste has most of the household components.
At the source, Solid waste is usually "clean”, easy to classify and collect, low humidity
(excluding food solid wastes). The major component of solid waste at landfill sites is
food waste at a relatively high rate (83,0 – 88,9% ww). Composition of soil waste can
recylable such as plastics, paper, metals are significantly reduced by classification and
scrap collection. The rest is less recyclable, mostly inorganic (sludge, soil).
18
Table 1.2 Compsition of solid waste at Đa Phuoc and Phuoc Hiep landfill site[9]
No.
Composition
Phuoc Hiep landfill
(%)
Da Phuoc landfill
(%)
1
Food
83,0 – 86,8
83,1 – 88,9
2
Shellfish, snails, crabs
0,0 – 0,2
1,1 – 1,2
3
Bamboo, straw
0,3 – 1,3
1,3 – 1,8
4
Paper
3,6 – 4,0
2,0 – 4,0
5
Carton
0,5 – 1,5
0,5 – 0,8
6
Nylon
2,2 – 3,0
1,4 – 2,2
7
Plastics
0,0 – 0,1
0,1 – 0,2
8
Fabric
0,2 – 1,8
0,9 – 1,8
9
Skin
0 – 0,02
-
10
Wood
0,2 – 0,4
0,2 – 0,4
11
Soft rubber
0,1 – 0,4
0,1 – 0,3
12
Hard ruber
-
-
13
Glass
0,4 – 0,5
0,4 – 0,5
14
Can
-
0,2 – 0,3
15
Metals
0,1 – 0,2
0,1 – 0,2
16
Porcelain
0,1 – 0,3
0,1 – 0,2
17
Debris
1,2 – 4,5
1,0 – 4,5
18
Ash
0,0 – 1,2
-
19
Styrofoam
0,0 – 0,3
0,2 – 0,3
20
Cotton tape, diapers
0,9 – 1,1
0,5 – 0,9
21
Hazardous waste
0,1 – 0,2
0,1 – 0,2
22
Humidity
52,5 – 53,7
52,6 – 53,7
Comparisons of solid waste compositions at waste sources and at landfill sites shows
that the components are recyclable with high value such as nylon, plastic, paper, metal,
rubber, glass at the landfill sites significantly reduced, as nylon only 1,4 – 2,8%, plastic
19
0,1 – 0,2%, ... The cause is due to the separation activities (outside the house) to collect
valuable scrap. This work is picked up by scavengers, collecters from waste sources and
scrap collecter at rendezvous and Commercial Transfer Station.
1.2.3 Current status of collection and transportation of the domestic solid waste
1.2.3.1 Collection time
The work of cleaning and gathering on the street today is mainly done at night, Working
time starts from 18 to 22 hours and ended before 6 am the following morning. However,
for some central districts (district 1, district 3, district 10, ...) are arranged throughout
the day to ensure the maintenance of the quality of street cleaning.
1.2.3.2 Means of collection
Collection means is being invested in the direction of safety, modern. However, there
are still some rudimentary means of collection with small quantities and most
concentrated in Binh Chanh district, the amount of dustbin (660 l capacity) for solid
waste is only 69%. In addition, some districts such as Districts 4, 9, Phu Nhuan, Go
Vap, Cu Chi still use other means available for cleaning and moving. However, because
these means do not ensure sealing and often spills contaminated waste so districts are
still actively investing and converting their means of collection to dustbin 660 liters to
ensure street hygiene, labor safety and traffic safety.
1.2.3.3 Save at source
Solid waste is not currently classified at the source. Households use plastic dustbin for
containing solid waste, others use metal dustbin or bamboo baskets. Most commonly,
people use nylon bags that contain solid waste and put them in dustbin. At the time of
solid waste collection, households bring dustbin or dustbin bags to the front door so that
collectors can easily collect them. For those who are not home at the time of collection,
solid waste is often put in tightly packed dustbin bags, in front of the door.
At the market, due to the limited business area, most small traders are making full use of
space as storage space very few places have dustbin , Most of the generated solid waste
20
is disposed of in the market aisles. After the market, the sanitation workers will collect
solid substances in the market. For schools, offices, restaurants, hotels, solid waste is
stored in small dustbin are equipped in the unit. After that, most of the soil waste was
delivered to dustbin 240L.
1.2.3.4 Collector at source
Today in HCMC, solid waste is collected through the following three forms:
Form 1: daily, solid waste are collected by dustbin trolleys and gathered at the indicated
destination, and then solid waste from the dustbin trolleys will be poured into small
compactor trucks (from 2-4 tons) and transferred to the Commercial Transfer Station.
At the Commercial Transfer Station, large trucks pick up solid waste from small
garbage compactor trucks and transport them to the landfill site.
Form 2: Solid waste are collected by dustbin trolleys and gathered at the indicated
destination, then solid waste from the dustbin trolleys will be poured into compactor
trucks (or large garbages compactor system) and transported directly to landfill site.
This technology is being used and increasingly expanded to reduce the destinations
concentrating too many solid waste and to restrict pollution.
Form 3: Solid waste available in dustbin (240-600L) along the roads or at large sources
of waste (markets, commercial areas, offices ...) are poured into small compactor trucks
(from 2-4 tons) and transported to the Commercial Transfer Station. At the Commercial
Transfer Station, large trucks pick up solid waste from small compactor trucks and
transport them to the landfill site. In this form, if the solid waste from the dustbins are
poured into the large compactor trucks, the trucks will transport them straight to the
landfill site.
Domestic solid waste collection activities in the city are carried out by 03 groups of
units: (1) the public system operated by Urban Environment Company and 22 District
Public Service Companies (Tan Phu and Binh Tan districts are newly established so that
they have no public service company), now all of these companies have been
21
transformed into one-member limited liability companies; (2) the private system run by
the private solid waste collection force, which is located outside or in about 30
collecting syndicates and (3) solid waste collection cooperatives (District 2, District 4,
District 6, Go Vap District, Thu Duc District). [9]
The statistics show:
60% of the volume of solid waste generated from households due to the private solid
waste collection force, 40% due to solid waste collection cooperatives and public
service companies. There are 4.000 collectors in the private solid waste collection, and
1.500 collectors in solid waste collection cooperatives and public service companies.
1.2.3.5 Collected at intended destinations (on the street)
Currently in Ho Chi Minh City, there are 241 intended destinations, mainly in districts
such as Tan Phu (76 destinations), District 10 (41 destinations), District 8 (17
destinations) that are inner districts in the city, the rest are scattered in some districts.
The number of existing intended destinations (in 2015) are greatly reduced compared to
period of 2005-2010. The locations of the intended destinationsare frequently displaced
due to poor environmental sanitation. This will affect the beauty and traffic of the city.
1.2.3.6 Commercial Transfer Station
Currently in HCMC, there are 45 commercial transfer stations with the task of
concentrating the amount of solid waste from private solid waste collection force,
cooperatives, companies. At the commercial transfer station s, solid waste are picked up
large trucks and transported to the landfill site. (10-15 ton/car).
The commercial transfer station s are divided into 4 categories:
Type 1 :
- Large reception capacity of over 800 tons /day
- The workshop is designed to meet the requirements, large campus.
- Technology: hooklif facilities, environmentally controlled, leaked water collection
system.
22
Type 2:
- Small receiving capacity: 20 - 100 tons /day
- Applied technology is the hooklif facilities
- The commercial transfer station has wall surrounding, a security gate, a roof, a
cement floor, a leaking water collection system..
Type 3:
- The commercial transfer station has wall surrounding, with guard, with / without
roof, cement floor, with / without leachate collection system.
- Means of transportation closed.
- Capacity : over 100 tons/day
Type 4:
- The commercial transfer station has wall surrounding, no guard gate, with/ without
roof, cement floor, without leachate collection system.
- Means of transportation closed.
- Capacity: less than 100 tons/day
Currently, the total of 45 commercial transfer station and garbage dumps, there are 33
commercial transfer station of type 3 and 4. This is an open commercial transfer station
or open rubbish dumps (73%). Therefore, it is necessary to invest in replacing open
rubbish dumps into closed rubbish dumps with advanced technology. In addition, it is
necessary to build a substation with a waste recycling station.
1.2.3.7 Transportation network
The solid waste transportation network from the intended destinations to the landfill
sites is carried out by 3 units: HCMC Urban Environment Company Limited (53%),
District Public Service Companies (30%) và Cooperatives (17%).
Form of execution: the existing districts (District 1, Tan Binh District, Binh Chanh
District, Cu Chi District, Can Gio District) and two newly established districts carry out
the bidding (Tan Phu District, Binh Tan District), which received funds from District
23
People's Committee.
The remaining districts will be executed by HCMC Urban
Environment Company Limited, District Public Service Companies and Cooperatives.
City People's Committee assigned Urban Environment Company Limited as a unit main
contractor, which signed contracts with the remaining units..
Transportation: including motor vehicles of all kinds (garbage trucks, trucks,
excavators). In particular, the number of vehicles used for solid waste collection and
transportation from the intended destinations or commercial transfer station to the
landfill sites are 261 vehicles.
Statistics also show that about 55% of solid waste transportation vehicles have a
leachate collection system, which made sure the leachate does not leak out. But, the
remaining vehicles have not a leachate collection system. There are still a large number
of vehicles that do not guarantee the environment is still functioning.
Average distance of transportation of domestic solid waste of Ho Chi Minh City on the
landfill sites (Northwest and Da Phuoc complexes) as follows: Phuoc Hiep 47.66 km;
Da Phuoc 29.08 km; Vietstar 50.17 km.
1.2.4 Purchasing and recycling of the solid waste
1.2.4.1 Reusing and recycling
Currently, recyclable solid waste is collected by scrap collectors. These types of solid
waste come from the daily activities of households, offices, factories, commercial
centers, garbage dumps. Most of scrap collectors are small, backwar so it is not possible
to create high quality products.
1.2.4.2 Scrap collection facalities
According to the survey of 202 scrap collection facalities, most the scrap collection
facalities have to rent premises to do business. Of the surveyed in 202 scrap collection
facalities, 178 ones (78.2%) [10]haveto rent premises. And most the scrap collectors’s
areas are small or very small. There are only a few ofthe scrap collectors(4.5%) with
large areas (several hundred of m2) and many workers (from 6 people or more).
24