- Trang chủ >>
- Y - Dược >>
- Y học cổ truyền
Structural Change In The Indian Manufacturing: A Study Of Technological Structure And Economic Development
Bạn đang xem bản rút gọn của tài liệu. Xem và tải ngay bản đầy đủ của tài liệu tại đây (811.83 KB, 45 trang )
<span class='text_page_counter'>(1)</span><div class='page_container' data-page=1>
<b>STRUCTURAL CHANGE IN THE INDIAN MANUFACTURING: A STUDY OF </b>
<b>TECHNOLOGICAL STRUCTURE AND ECONOMIC DEVELOPMENT </b>
<i><b>Chaitanya Talreja</b></i>
Keywords: structural change, technological classification, economic development, manufacturing,
services, demand regime, productivity regime
<b>JEL Classification: O14 L60 L80 D57 </b>
<b>I. </b> <b>INTRODUCTION </b>
In the process of economic development of societies in the world industrialization has assumed the
central role. According to Rodrik (2016) industrialization led to sustained productivity increase in Europe and
the United States of America leading to economic advancement to becoming rich nations. Later the process of
<i>industrialization was crucial in catch-up and convergence of a smaller group of non-Western nations like Japan </i>
(late nineteenth century), South Korea and Taiwan (post 1960s). Inherent in this process is the importance of
manufacturing sector as the driving force of industrialization which the study suggests should also be crucial in
reducing poverty in developing economies of Sub-Saharan Africa and South Asia. Felipe et. al. (2013) in their
cross country analysis suggest that the probability of transition of an economy from low to high income is much
higher (42 percent probability) with manufacturing share in employment and output being at least 18 percent as
opposed to lower shares of employment and output (5 percent probability). Further they suggest that no economy
has achieved high income status without its manufacturing sector share reaching at least 18 percent. They also
argue that for an economy to benefit from services as an escalator of growth a solid complementary
manufacturing base is essential.
In this context, the study of structural change in India has been a curious case, especially in its
post-liberalization period after 1991. The GDP share of manufacturing in India has stagnated around 15-16 percent
from 1991-92 to 2012-13 as compared to an increase from 9 percent to 15 percent from 1950-51 to 1990-91. The
manufacturing employment share between 1993-94 and 2011-12 hovered around 10-12 percent. The GDP share
PhD scholar at South Asian University, Chanakyapuri, New Delhi
Email:
Postal Address: E-56, Phase-1, Ashok Vihar, Delhi-110052
</div>
<span class='text_page_counter'>(2)</span><div class='page_container' data-page=2>
of services on the other hand has grown rapidly from 38 percent to 53 percent from 1991-92 to 2012-13 as
compared to 27 percent to 36 percent from 1950-51 to 1990-911. Services employment share increased from 21
percent to 27 percent during 1993-94 to 2011-122. India‟s structural change has been quite distinct as compared
to various Asian economies like China, Indonesia, Malaysia, South Korea and Thailand etc. as noted by Kochhar
et al. (2006), Papola (2006) and Ghose (2016), especially during the post reform period after 1991. Most notably,
India‟s service sector during the post-reforms period has been a positive outlier in terms of its GDP share and a
negative outlier in its employment share in a global comparative perspective. On the other hand the
manufacturing sector contribution to employment and output remained comparably low.
In light of the central role of manufacturing in economic development and the observed structural
change in India with respect to the manufacturing output and employment share, there arises a need to revisit the
Indian manufacturing. The approach in this analysis takes a marked departure from analysing the relationship
between economic growth and manufacturing growth. This kind of analysis has been the central feature of
important studies like Dasgupta and Singh (2005) and Dasgupta and Singh (2006) in response to the observed
structural change with respect manufacturing and services in the developing world, particularly focussing India.
This approach is restricted to verifying econometric relationship between growth in manufacturing, services and
agriculture sectors, respectively with aggregate economic growth. This has been with the objective to identify
sectors that could be engines of growth. The approach being important remains restricted and is unable to
explain the underlying process of translation of manufacturing into economic development or reasons for the
lack of it. The approach presented in this study is to understand the evolution of Indian manufacturing against a
framework that explains translation of manufacturing growth into economic development. Importantly, this
paper looks at the structural change that has happened within the Indian manufacturing across various
manufacturing sub-sectors. The within manufacturing structural change has been anchored to grouping of
manufacturing sub-sectors into technology groups based on standard technological classifications for various
manufacturing sub-sectors. The importance of this classification and the framework of the analysis are presented
in the subsequent sections of the study.
1<sub> National account statistics, 2004-05 prices, EPWRF. </sub>
</div>
<span class='text_page_counter'>(3)</span><div class='page_container' data-page=3>
The following part of the paper has been divided into four sections. Section II explains the theoretical
and empirical works behind the synthesis of the analytical framework used in this study. Section III discusses the
empirical strategy for the study. Section IV presents the different aspects of analysis of the internal structural
change in the Indian manufacturing since the liberalization reforms based on the analytical framework presented
in Section III. Section V presents a summary and discussion on the findings of the paper.
<b>II. </b> <b>STRUCTURAL CHANGE IN MANUFACTURING: AN ANALYTICAL FRAMEWORK </b>
The structural change within manufacturing sector is closely related to the pattern of manufacturing
sector led economic development, particularly the shift/upgrading of manufacturing production and exports from
low technology to high technology manufacturing. This has been clearly demonstrated in the work of Lall
(2000). This study focuses on the patterns of manufacturing sector exports and relates the change in trade
patterns of manufacturing sub-sectors across technology groups between 1985 and 1998. This has been used to
demonstrate the relationship between manufactured exports and internal dynamics of structural change in the
manufacturing sector from the perspective of economic development. According to the study, the share of
manufactured exports in total product exports in the world increased from 74 percent to 84 percent between 1985
and 1998. Within the same period resource based manufacturing3 lost their shares in manufactured exports from
24 percent to 17 percent and the high tech industries increased their shares from 17 percent to 25 percent. The
shares of low and medium technology manufacturing were stable at 19 percent and 39-40 percent, respectively.
This shows that high technology exports witnessed rapid increase in exports during this period with an annual
growth of 13 percent much faster than 9.7 percent for aggregate manufacturing. Lavopa and Szirmai (2015) also
supports the observation by Lall (ibid).They show that there has been an internal shift in the manufacturing
sector towards knowledge intensive high technology manufacturing in terms of manufacturing output share at
current prices between 1972 and 2012. The share of medium and high technology manufacturing industries like
machinery, electrical & optical equipments and chemicals & chemical products increased from 19 percent to 22
percent and 9 percent to 11 percent, respectively. The shares of low technology industries like textiles, leather
and footwear and wood, paper and publishing fell from 11 percent to 6 percent and 10 percent to 8 percent,
respectively. But the internal structural change within the manufacturing sector has not been uniform across
</div>
<span class='text_page_counter'>(4)</span><div class='page_container' data-page=4>
geography in terms of regional contributions. Lall (ibid) shows that the share of developing economies in total
manufactured exports increased from 16 percent to 23 percent between 1985 and 1998, but during the same
period the share of East Asian economies in total developing economies‟ manufactured exports increased from
57 percent to 70 percent. Within the high technology manufacturing the share of East Asia increased from 81
percent to 86 percent. Even in terms of share in developing economies‟ manufacturing output at current prices,
Lavopa and Szirmai (ibid) show that the share of Asian economies increased from 23 percent to 66 percent
during 1972 to 2012.
Lall (ibid) also shows that as the importance of high technology manufacturing has increased in world
manufacturing exports, this has been accompanied by greater concentration of manufacturing exports in a few
economies of the world. The top 10 manufacturing exporters contributed to 65 percent of total manufacturing
exports and this increased to 80 percent in 1998. The corresponding shares for high technology manufacturing
were 94 percent and 96 percent, respectively. Driemeier & Nayyar (2018) show that medium and high
technology manufacturing had been amongst the highest traded manufacturing industries in the world with high
degree of export concentration in a few economies, extensive use of professional, scientific and technical
services, witnessed greatest level of automation in manufacturing processes for the study period of 2011 to 2015.
Lall (ibid) suggests that the success of a few Asian economies has been driven by development of
capabilities which has been a cumulative process over time as these economies climbed up the ladder of
technological sophistication within manufacturing and expanded & diversified their manufactured exports.
</div>
<span class='text_page_counter'>(5)</span><div class='page_container' data-page=5>
effects of labour productivity growth create a employment-productivity growth trade-off (Storm and Naastepad. ;
2005). It has been observed that in their successful economic development the East Asian economies managed to
escape the productivity-employment-growth trade-off (Storm and Naastepad 2005; Astorga et. al. 2014). This is
because their output expanded more than their labour productivity during the process of industrialization. When
output growth exceeds labour productivity growth, employment expands.
There have been many studies that have looked at the evolution of Indian manufacturing output and
employment structure during the post reforms period. Some of the important studies are Chaudhuri (2002), Rani
and Unni (2004), Kannan and Raveendran (2009) and Ghose (2016). These studies focus on different aspects of
Indian manufacturing growth and employment in different sectors like employment elasticity, capital intensity,
labour productivity etc. These studies have not analysed the Indian manufacturing against a framework that
captures the key aspects that led to the successful industrialization of the most recently industrialized economies
particularly in East Asia. The role of technological classification as an anchor for structural change, a key
element for such an analysis has been particularly missing.
Studies like Weiss (2005) and Storm & Naastepad (2005), Felipe et. al. (2013) and Astorga et. al.
(2014), provide a theoretical framework to understand the process that enabled the successful industrialization of
newly industrialized East Asian economies. A synthesis of the framework developed using the ideas presented in
these studies and studies like Park (1989), Park (1994), Francois & Reinert (1996), Guerrieri & Meliciani (2005),
and Driemeier & Nayyar (2018) specially for their contribution in highlighting the role of services in
</div>
<span class='text_page_counter'>(6)</span><div class='page_container' data-page=6>
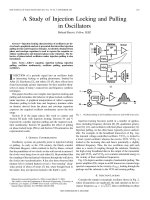
<b>Figure 1 </b>
<b>A framework of virtuous growth through manufacturing production </b>
Source: Author‟s elaboration
Figure 1 depicts the important relationship between demand expansion and productivity growth. This
understanding is based on the theoretical basis provided by the synthesis of Kaldor-Verdoon understanding of
the mutually reinforcing demand expansion and productivity relationship. Within this framework, the aggregate
demand drives the production in an economy, and output expands in response to aggregate demand expansion.
Output expansion further leads to increased productivity in the economy. This relationship has been further
explained and elaborated by Storm and Naastepad (2005), specifically focussing the East Asian economic
success. The initial impetus on labour productivity growth comes through investment and capacity creation for
production which is the starting point for kick-starting the process of virtuous growth. Labour productivity
further improves through capital deepening. Capital deepening is the growth of capital stock per worker. But it
has been argued by Storm and Naastepad (2005) increased capital intensity essentially embodies technology and
reflects technological progress embodied in the capital equipments used with increased used of capital per
worker. They show that capital stock per worker grew by 7.7 percent, 5.6 percent, 5.2 percent, 5.2 percent and
8.2 percent in South Korea, Japan, China, Singapore and Taiwan respectively, between 1960 and 2003.
</div>
<span class='text_page_counter'>(7)</span><div class='page_container' data-page=7>
successful industrialized economies in East Asia have witnessed structural change in their manufacturing
composition, beginning from larger share of low technology groups to a shift towards medium and high
technology groups in production and exports. For example the manufacturing value added share of textile sector
(low technology) fell from 22.6 percent to 7.8 percent and 17.4 percent to 6.5 percent respectively for South
Korea and Taiwan between 1975 and 2002. On the other hand shares of machinery sector (high technology)
increased from14.2 percent to 45.9 percent and 18.2 percent to 45.5 percent in both these economies respectively
during the same period. Similar shifts happened in the case of exports shares (See Storm & Naaastepad 2005, pp
1070-1071). In their work, Lall (2000) and Palma (2009) have closely analysed the relationship between
technological upgradation within manufacturing production and the export expansion within the successfully
industrialized East Asian economies. As previously noted in this section, there has been a close association
between global relocation of manufacturing production towards the East Asian economies, and their
manufactured exports expansion. The East Asian economies that have successfully industrialized during this
period as they rapidly increased their share in world manufacturing exports and upgraded and diversified their
exports beginning from low-technology manufacturing to high-technology manufacturing. This process has been
popularly termed as the flying geese pattern where the leading goose economy leaves the space open for the
following geese to enter the export market of a lower technology industry, as it upgrades its exports to higher
technology industries. This happens as the leading goose economy has saturated productivity advantage or faces
rising costs in low technology industry. This process has been considered to be a path-dependent process,
involving development of cumulative capabilities as an economy upgrades itself towards high technology
manufacturing production. Simply put, the process of learning, knowledge creation and capability development
enabled these economies to sequentially upgrade from low technology manufactured exports to high technology
manufactured exports (Lall 2000 and Palma 2009). Technological classification of industries is the most useful
anchor to understand the structural change in manufacturing in order to compare it with the experience of
successful industrializers.
An aspect which has become more important in manufacturing production since the 1990s after the
Information and Communication technology revolution is the intensity of service use in manufacturing
</div>
<span class='text_page_counter'>(8)</span><div class='page_container' data-page=8>
1994; Francois & Reinert 1996; Guerrieri & Meliciani 2005; Felipe et. al. 2013 and Driemeier & Nayyar 2018)
as discussed in Section II. The process of technological upgradation, capital deepening and contribution of
service inputs in manufacturing production determine the labour productivity regime of an economy under this
framework.
Under this framework aggregate demand expansion stimulates labour productivity growth, but labour
productivity growth also has an effect on demand as elaborated by Storm and Naastepad (2005). Improved
labour productivity may have opposing effects on aggregate demand. If the share of wages in output falls as a
result of improved labour productivity and the propensity to consume of wage earners is higher than the profit
earners, the consumption demand is expected to fall. At the same time a rise in profit share may incentivise
greater investment. Improved productivity also supports export expansion by improving the competitiveness of
domestic production. The net effect of a rise in labour productivity on consumption demand, investment demand
and exports determines the impact of labour productivity on demand expansion. A mutually beneficial
relationship between the demand and productivity regimes is crucial for virtuous economic growth occurring
through the structural change within the manufacturing sector.
This framework provides a useful anchor against which the developmental implications of
manufacturing sector structural change in an economy needs to be assessed.
<b>III. </b> <b>EMPIRICAL STRATEGY </b>
The empirical strategy for an analysis of the structural change in the Indian manufacturing is based on
the analytical framework presented in Section III. Technological upgradation within manufacturing industry
structure is an element of the analytical framework that is both a crucial aspect of understanding the
technological sophistication and diversification within the manufacturing sector and also lends a definitional
understanding to the structure of classification4 of industries within the manufacturing sector. The analysis here
uses the technological classification of manufacturing industries as an anchor against which the structural change
within the Indian manufacturing sector has been assessed. The empirical exercise in this paper is based on the
specific areas of analysis in the productivity and demand regimes identified from the analytical framework and
carried out in the following steps:
4
</div>
<span class='text_page_counter'>(9)</span><div class='page_container' data-page=9>
1. Trends in the structure and composition of value added and employment within the
manufacturing sector
2. labour productivity and employment elasticity relationship across technological groups in Indian
manufacturing (reflects the interplay of the demand/output growth regime, productivity regime
and employment growth),
3. indirect employment structure of the manufacturing sector (If change in the technological
structure of production has altered the structure of indirect employment generation across
technological groups),
4. labour productivity and capital intensity relationship (reflects the nature of capital deepening.
Whether capital deepening reflects technological upgradation or labour substitution),
5. Pattern of service dependence of different technological groups of manufacturing,
6. Demand regime analysis: Composition of effective demand and trends in domestic absorption,
export orientation and imports
The purpose of the strategy adopted in the steps mentioned above is to interpret the different aspects of
the productivity and demand regimes of the Indian manufacturing sector. The motivation behind this is to
understand the co-evolution of these aspects of the productivity and demand regimes and understand the
implications of this growth process for the economic development of the Indian economy. The aim of this study
is not to model the causality of the analytical framework explained in Section III but to assess the developmental
implications of the growth process through an analysis of the patterns observed at different nodes of Figure 1.
<b>IV. </b> <b>STRUCTURAL CHANGE IN INDIAN MANUFACTURING: AN ANALYSIS </b>
This section investigates the various discussed aspects of structural change in the Indian manufacturing
sector during the post liberalization era. The analysis in this section has been based on the India KLEMS
database5 and five Input-Output Transactions Tables (IOTTs) available for India during the post-reforms period.
The third edition of India KLEMS database has been used here with the base year as 2004-05. This dataset
provides time-series data for 27 sectors of the Indian economy on outputs (gross value added and gross value of
output) and inputs like capital, labour, energy, material and services from 1980-81 to 2014-15.There are 13
</div>
<span class='text_page_counter'>(10)</span><div class='page_container' data-page=10>
manufacturing sectors in this database. The Central Statistics Office (CSO), Government of India has provided
four IOTTs for the years 1993-94, 1998-99, 2003-04 and 2007-08. The fifth IOTT used here is for the year
2013-14 which has been published by the National Council for Applied Economic Research (NCAER)6. There are 115
sectors in the 1993-94 and 1998-99 IOTTs and there are 130 sectors in the subsequent IOTTs. There are 66
manufacturing sub-sectors in the 1993-94 and 1998-99 IOTTs and 68 manufacturing sub-sectors in the latter
three IOTTs. The focus of this analysis is to analyse the structural change in India‟s manufacturing sector based
on the technological classification of manufacturing sub-sectors. The manufacturing sub-sectors in both the India
KLEMS database and IOTTs have been classified into three and four technology categories, respectively. The
manufacturing sub-sectors in the IOTTs have been aggregated to 16 sectors. The three categories of
technological sophistication used for KLEMS database are low technology (LT), medium low technology
(MLT), medium & high technology (MHT). The four categories used for IOTTs are low technology (LT),
medium low technology (MLT), medium technology (MT) and high technology (HT). The OECD (2011)
document and UNIDO‟s latest technological classification of manufacturing sectors have been used7<sub>. The </sub>
analysis in this section follows the sequence of exercises discussed in Section IV.
<b>1. Trends in Composition of Manufacturing Output and Employment </b>
Figure 2 and Figure 3 below depict the change in average gross value added shares and average
employment shares for five year intervals beginning from 1990-91 to 1994-95 till 2010-11 to 2014-15 for low
technology, medium low technology and medium & high technology groups of the Indian manufacturing sector.
6<sub> This IOTT has been prepared by modifying the Supply and Use Tables (SUTs) provided by the CSO for the years 2011-12 and 2012-13. The </sub>
SUTs provided by the CSO are rectangular matrices of intermediate transactions and final demand for different sectors with 140 rows and 66
columns. The analysis requires square matrices and IOTTs are available as square matrices.
7<sub> The OECD and UNIDO provide classification of manufacturing sectors based on technology intensity reflected by Research and Development </sub>
</div>
<span class='text_page_counter'>(11)</span><div class='page_container' data-page=11>
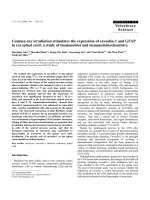
<b>Figure 2 </b>
<b>Average Gross Value added shares of manufacturing sectors based on technology intensity </b>
<b>(2004-05 prices) </b>
Source: Author‟s Calculation based on India KLEMS database
<b>Figure 3 </b>
<b>Average Employment shares of manufacturing sectors based on technology intensity </b>
Source: Same as Figure 2.
Figure 2 above clearly depicts the internal adjustment of output within the manufacturing sector from
low technology manufacturing to medium & high technology manufacturing between 1990-91 and 2014-15. The
output share of medium low technology fluctuated around 30 percent during this period. The share of low
technology fell from around 45 percent to 35 percent and the share of medium & high technology rose from 25
</div>
<span class='text_page_counter'>(12)</span><div class='page_container' data-page=12>
percent to 35 percent. The adjustment in employment shares across technology categories has been relatively
much slower and smaller in magnitude as compared to the adjustment in output shares as can be seen in Figure 3.
The employment share of low technology industries fell by 5 percent from 70 percent to 65 percent and the
shares of medium low technology and medium & high technology increased from 18 percent and 12 percent to
20 percent and 15 percent respectively. A clear pattern that emerges from this structural change within the
manufacturing sector is that a larger chunk of manufacturing output has moved to sectors which support much
lesser manufacturing employment. This depicts that the composition of income generation in the manufacturing
sector followed a trajectory similar to the change that the global economy has witnessed during these years. But
at the same time the gap in average values added between those associated in production across different
technology groups widened. This suggests that the internal productive structure of manufacturing sector
witnessed a structural change which saw a skewed distribution of income towards those who have managed to
find access to work in higher skill and higher technology.
<b>2. Trends in Employment Elasticity and Labour Productivity Relationship </b>
In the previous sub-section we found out the structural adjustment of output and employment
composition across technological groups within the Indian manufacturing during the post-liberalization era. In
general for the growth process to be inclusive it needs to be accompanied by improvement in labour productivity
and employment generation at the same time. This relationship between output growth, employment elasticity
and labour productivity growth has been discussed in Kapsos (2005) and Kannan & Raveendran (2009). This
relationship that has been analysed here for the Indian manufacturing across its sub-sectors is based on the
following conceptualization by Kapsos (2005):
</div>
<span class='text_page_counter'>(13)</span><div class='page_container' data-page=13>
<i>employment with respect to output and is given by gl/gy. Equation (3) here establishes an important relationship </i>
between employment elasticity, labour productivity growth and output growth. This also conveys that higher
labour productivity accompanied with a relatively low rate of growth of output pushes the employment elasticity
downwards. Simply put, in such a situation a higher labour productivity occurs only due to low employment
growth. This is because labour productivity depicted here is average labour productivity. Despite the simplicity
of this exposition, the analysis of actual trends in output and employment growth using this framework provides
useful insights about the growth process8. This exercise has been conducted for the Indian manufacturing sector
based across technological groups using the India KLEMS database. The methods for computing employment
elasticities, labour productivity growth, output and employment growths are provided in Appendix B.
<b>Table 1 </b>
<b>Employment Elasticity of manufacturing groups based on technological classification </b>
Emp Elasticity
1990-91
to
1994-95
1995-96
to
1999-00
2000-01
to
2004-05
2005-06
to
2009-10
2010-11
to
2014-15
LT 0.19 0.44 1.10 -0.49 0.29
MLT 0.53 1.02 0.42 -0.05 0.71
MHT 1.29 0.09 0.38 0.23 3.13
Total
Manufacturing 0.38 0.49 0.61 -0.24 0.65
<b> Source: Author‟s calculation based on India KLEMS database </b>
<b>Table 2 </b>
<b>Labour productivity growth of manufacturing groups based on technological classification </b>
Source: Same as Table 1.
<b>Table 3 </b>
<b>Employment growth of manufacturing groups based on technological classification </b>
8
See Appendix B, Table 12 for interpretation of employment elasticities in different scenarios depicted by different combinations of output,
productivity and employment growth.
Manufacturing
groups based on
technology
intensity/Years
1990-91
to
1994-95
1995-96
to
1999-00
2000-01
to
2004-05
2005-06
to
2009-10
2010-11
to
2014-15
LT 4.3 2.3 -0.4 10.6 4.5
MLT 1.9 -0.1 3.4 10.1 1.8
MHT -1.5 3.8 5.3 8.2 -5.2
</div>
<span class='text_page_counter'>(14)</span><div class='page_container' data-page=14>
Manufacturing
groups based on
technology
intensity/Years
1990-91
to
1994-95
1995-96
to
1999-2000
2000-01
to
2004-05
2005-06
to
2009-10
2010-11
to
2014-15
LT 1.0 1.8 3.8 -3.5 1.8
MLT 2.1 3.1 2.5 -0.5 4.4
MHT 6.5 0.4 3.3 2.4 7.6
Manufacturing 1.8 1.9 3.5 -2.2 3.2
Source: Same as Table 1.
<b>Table 4 </b>
<b>Output growth of manufacturing groups based on technological classification </b>
Manufacturing groups
based on technology
intensity/Years
1990-91
to
1994-95
1995-96
to
1999-00
2000-01
to
2004-05
2005-06
to
2009-10
2010-11
to
2014-15
LT 5.4 4.1 3.4 7.1 6.3
MLT 4.0 3.0 6.0 9.6 6.2
MHT 5.0 4.2 8.5 10.6 2.4
Manufacturing 4.8 3.8 5.7 9.0 4.9
Source: Same as Table 1.
The Tables 1-4 depict the trends in relationship between employment elasticity, labour productivity,
employment and output growths during the post-reform period for the Indian manufacturing sector across
technological groups. As a background to this analysis it is important to shed light on a few issues. Mehrotra et.
al (2014) shows that the unorganized segment of the Indian manufacturing contributes 65 percent to
</div>
<span class='text_page_counter'>(15)</span><div class='page_container' data-page=15>
are three important observations here in the periods with highest employment elasticity i.e. 2000-01 to 2004-05
and 2010-11 to 2014-15. First, the low technology manufacturing group witnessed an employment elasticity of
1.10 with a negative labour productivity growth rate of -0.04 percent (See Tables 1 and 2) during 2000-01 to
2004-05.The previous section has already shown that the structural adjustment within manufacturing across
technological groups has reflected large labour productivity difference between low technology manufacturing
and medium & high technology manufacturing as the former contributed much more to employment than output
and the latter contributed much more to output than employment (See Figures 2-3). This high elasticity of
employment in low technology group has been a result of employment growth superseding output growth during
this period (See Tables 3 and 4). Second, the employment elasticity of the manufacturing sector increased
steeply during 2010-11 and 2014-15, but the medium & high technology witnessed an extremely steep decline in
labour productivity as the growth rate was -5.2 percent. This was due to a rapid slowdown in output growth of
this group and a sharp rise in employment growth, which seems to be a peculiar trend during this period (See
Tables 1-4)9. Third, the period 2005-06 to 2009-10 saw rapid growth rates in labour productivity and output
growth which were highest during the post-reform period for the manufacturing sector as a whole and across
technology groups (Tables 2 and 4). But this rapid rise in labour productivity came along with decline in
manufacturing employment growth i.e. decline in employment contributed to the rise in labour productivity as
opposed to a employment generating labour productivity growth. All the technological groups witnessed
negative growth rates in employment except medium & high technology group where the growth rate was
moderately positive. The period saw a negative employment elasticity in manufacturing with high output growth.
This exercise depicts that though manufacturing sector employment elasticity improved as a whole during the
post reform period (except during 2005-06 to 2009-10), the internal dynamics of the sector convey that this
process witnessed steep fluctuations in employment growth and labour productivity in different periods and
across technological groups and was not uniform or sustained process of employment generating labour
productivity growth10. It was previously discussed in Section III, that technological change has both
9
This is on account of an unusually high employment growth in Electrical and Optical Equipments sector of the MHT during 2010-11 to
2014-15 of 17.6 percent (annual average growth rate). This sector accounted for average 31 percent employment share of MHT sector during this
period. This has also been noted in the KLEMS report published on 27/03/2018 which describes the KLEMS dataset creation.
(Section 4.1).
10<sub>Mehrotra et. al. (2014) provides a qualitative assessment of the trends in employment of the Indian economy during the post-reform period. In </sub>
</div>
<span class='text_page_counter'>(16)</span><div class='page_container' data-page=16>
employment displacing and employment generating effects in the economy. In the analysis so far it has been
noticed that structure of manufacturing has been altered in favour of industries that have generated relatively
much lesser employment per unit of output as compared to more employment intensive industries. But this only
reflects direct employment intensity of these industries. As structural change occurs, employment might be
added indirectly by production in a sector through different process added in the production process, such that
employment is generated in other sectors of the economy. To understand this process, the next sub-section
analyzes the evolution of structure of indirect employment generation by different technological groups in the
manufacturing sector.
<b>3. Structure Of Indirect Employment </b>
In sub-section 1 of Section IV it was also noticed that the low technology manufacturing continued to
be the major direct employer of the manufacturing sector employment during the post-reforms period (See
Figure 2). This does not reflect the indirect employment that different manufacturing sub-sectors generate
through their input-output linkages with different sectors. This is aspect has been analysed below in Table 5
using the methodology of computing indirect employment based on Veeramani (2016).
<sub> </sub>
(
)
∑
<i>In equation (1), E is n*n diagonal matrix of employment to gross output ratio for each sector i, where </i>
<i>each diagonal element of the matrix is denoted by ei. The term </i> depicts the Leontief inverse matrix
<i>computed from the matrix Ad of the domestic input coefficients</i>11<i>. The term Fd depicts the n*n diagonal matrix </i>
<i>of final demand from domestic sources with each diagonal element denoted by Fj depicting the final demand for </i>
<i>each sector j. Matrix L depicts the n*n matrix where each lij depicts the employment generated in sector i due to </i>
<i>the total final demand for commodity j. In equation (3) the total indirect employment generated by sector j in the </i>
<i>economy due to final demand generated for sector j (depicted by the column sum of matrix L) due to the </i>
female employment within self employment low productivity manufacturing activities. In the entire period, there was a consistent rise in casual
employment amidst the fluctuations witnessed by self employed and regular workers.
11<i><sub>Dietzenbacher et. al. (2005) provides a detailed discussion on the usage of Ad matrix instead of A in modelling and multiplier exercises. </sub><sub>The Ad </sub></i>
</div>
<span class='text_page_counter'>(17)</span><div class='page_container' data-page=17>
<i>backward linkages of sector j with all the upstream sectors i. The employment coefficients used here have been </i>
computed from the India KLEMS database, and all the IOTTs have been reduced to the 27 sector classification
provided by the India KLEMS database. As already discussed, there are 13 manufacturing sub-sectors in the
total 27 sectors as per the India KLEMS database. Table 5 below shows the percentage of indirect employment
created by the manufacturing sectors in the total indirect employment generated by these manufacturing
sub-sectors in the Indian economy for all the benchmark IOTTs during the post-reforms period.
<b>Table 5 </b>
<b>Manufacturing sub-sector indirect employment (as a percentage of total indirect employment </b>
<b>generated by all the manufacturing sub-sectors) </b>
S No. Manufacturing Sectors/Years
Technological
classification
1993-94
1998-99
2003-04
2007-08
2013-14
1
Food Products, Beverages and
Tobacco LT 50 62 59 48 55
2
Textiles, Textile Products,
Leather and Footwear LT 22 16 17 19 14
3 Wood and Products of wood LT 0 0 0 1 3
4
Pulp, Paper,Paper
products,Printing and Publishing LT 1 1 1 2 0
5 Manufacturing, nec; recycling LT 3 4 2 6 7
6
Coke, Refined Petroleum
Products and Nuclear fuel MLT 1 1 1 2 4
7 Rubber and Plastic Products MLT 2 2 2 3 2
8
Other Non-Metallic Mineral
Products MLT 1 1 0 1 0
9
Basic Metals and Fabricated
Metal Products MLT 2 1 2 3 2
10
Chemicals and Chemical
Products MHT 5 3 5 4 3
11 Machinery, nec. MHT 3 3 3 4 4
12 Electrical and Optical Equipment MHT 4 3 5 3 2
13 Transport Equipment MHT 4 3 3 4 5
14 Manufacturing 100 100 100 100 100
Source: Author‟s calculation based on India KLEMS database and IOTTs 1993-94, 1998-99, 2003-04 and 2007-08,
CSO, MOSPI, GOI and IOTT 2013-14 Kanhaiya and Saluja (2016)
</div>
<span class='text_page_counter'>(18)</span><div class='page_container' data-page=18>
This is also on account of its strong backward linkages with the agricultural & allied activities12 sector which is the
largest sector in terms of employment in India13. This analysis conveys that as the composition of value added has
adjusted in favour of technologically sophisticated sectors, their direct and also indirect employment contribution in
the economy has been relatively much lower during the post-reforms period. The structure of indirect employment
generation by the manufacturing sector remained virtually unaltered. This can also be seen from the actual
employment figures in Appendix D Table 14. Out of the 54.4 millions indirect employment attributed to
manufacturing final demand in 1993-94, 25.4 million jobs were contributed by Food Products, Beverages and
Tobacco sector. As the manufacturing indirect employment doubled to 103.4 millions in 2013-14, 56.5 millions
were contributed by Food Products, Beverages and Tobacco sector. The low technology sectors also dominated the
indirect employment generation by the Indian manufacturing. The medium & high technology sectors with relatively
low employment intensity per unit of output also did not become more important sectors in terms of indirect
employment generation through backward linkages with upstream sectors. This would be expected in a virtuous
process of growth where new production processes add employment elsewhere in the economy (Storm and
Naastepad 2005; Astorga et. al 2014).
<b>4. Labour Productivity, Capital Productivity and Capital Intensity Relationship </b>
The previous sub-sections observed the trends and deciphered the patterns of structural change in the
Indian manufacturing through the relationship between employment and labour productivity growth. The growth
in labour productivity itself can be decomposed into capital productivity growth and capital intensity growth.
The decomposition of this relationship has been presented in Chaudhuri (2002) and Rani & Unni (2004). It is
also shown here below:
<i>Where Y is the output, L is the employment, K is the capital stock, Y/L is labour productivity, K/L is capital </i>
<i>intensity and Y/K is capital productivity. Equation (2) depicts the growth rates from equation (1), where is </i>
<i>labour productivity growth, gk is capital intensity growth and is capital productivity growth. Based on </i>
Chaudhuri (2002) and Rani & Unni (2004), the basic conceptualisation in equation (2) conveys that the growth in
12<sub> Agriculture, Hunting, Forestry and Fishing </sub>
13<sub> Appendix D shows that among the 6 broad sectors of the Indian economy, manufacturing sector contributed 60 percent of the overall indirect </sub>
</div>
<span class='text_page_counter'>(19)</span><div class='page_container' data-page=19>
labour productivity could be understood as labour substitution if growth in capital intensity is accompanied by a
lack of capital productivity growth and in case of capital productivity growth with capital intensity growth the
situation could be understood as that of technological upgradation14. As previously discussed in Section III,
capital deepening is an important aspect of the productivity regime in successful manufacturing sector led
economic development. The exercise discussed here aims to understand the evolution of this specific relationship
between capital deepening and labour productivity for the Indian manufacturing sector. Table 6 and Table 7
below respectively present capital intensity growth and capital productivity growth in Indian manufacturing,
respectively. Table 2 above has already presented labour productivity growth. The analysis here involves
observations made through conjunction of Table 2, Table 6 and Table 7.
<b>Table 6 </b>
<b>Capital intensity growth of manufacturing groups based on technological classification </b>
Manufacturing
groups based on
technology
intensity/Years
1990-91
to
1994-95
1995-96
to
1999-00
2000-01
to
2004-05
2005-06
to
2009-10
2010-11
to
2014-15
LT 5.2 6.0 2.1 11.4 1.3
MLT 6.7 8.1 3.2 12.3 2.1
MHT -1.1 10.4 0.5 7.6 -1.5
Manufacturing 5.0 8.0 1.7 12.1 2.1
Source: Same as Table 1.
<b>Table 7 </b>
<b>Capital productivity growth of manufacturing groups based on technological classification </b>
Manufacturing
groups based
on technology
intensity/Years
1990-91
to
1994-95
1995-96
to
1999-00
2000-01
to
2004-05
2005-06
to
2009-10
2010-11
to
2014-15
LT -0.9 -3.7 -2.4 -0.8 3.2
MLT -4.9 -8.1 0.3 -2.2 -0.3
MHT -0.3 -6.6 4.8 0.5 -3.7
Manufacturing -2.0 -6.1 0.5 -0.9 -0.4
Source: Same as Table 1.
Table 6 shows that during the entire post-reform period the capital intensity of the manufacturing
witnessed an increase. The initial decade of the reform period witnessed a rise in the growth of capital intensity
which slowed down sharply from 8 percent during 1994-95 to 1999-2000 to 1.7 percent during 2000-01 to
</div>
<span class='text_page_counter'>(20)</span><div class='page_container' data-page=20>
05. The sharpest increase in capital intensity growth took place during 2005-06 to 2009-10 when it rose 12.1
percent and subsequently slowed down to 2.1 percent during 2010-11 to 2014-15. Table 7 shows that capital
productivity growth was negative during the entire period except 2000-01 to 2004-05. The nature of capital
intensity growth reflected labour substitution more intensely during the first decade due to much larger negative
capital productivity growth of the post-reform period (See Table 7). The nature of labour substitution reflected
by capital intensity growth was much more sustained in low technology and medium low technology groups.
The medium & high technology group was relatively better off in this sense as it experienced a decade of capital
intensity growth which was more reflective of technological upgradation during 2000-01 to 2009-10 (See Tables
6 and 7) . The medium & high technology group also witnessed a fall in capital intensity during 2010-11 to
2014-15 due to a rapid rise in employment growth (Table 3) during this period. This also came along with steep
slowdown in output growth (Table 4) which did not accompany technological upgradation (Table 7). The
negative capital productivity growth of 3.7 percent in the MHT sector was due high and negative capital
productivity growth in machinery nec. (7 percent), transport equipments (7 percent) and chemicals and chemical
Products (1.6 percent) sectors. The electrical and optical equipments sector witnessed a small positive capital
productivity growth of 0.9 percent. This exercise depicts that as the manufacturing sector witnessed a growth in
capital intensity that reflected labour substituting labour productivity growth. The lower technology groups (LT
& MLT) were affected much more in terms of labour substitution due to the longer period of such process in
these groups and a much larger magnitude of employment share. This reflects that the post-reform growth
process within the manufacturing sector has been clearly biased against low productivity-low skill manufacturing
employment.
<b>5. Structure of Manufacturing Dependence on Services </b>
</div>
<span class='text_page_counter'>(21)</span><div class='page_container' data-page=21>
analyse its role in the manufacturing production structure. Following Park (1989) manufacturing intensity of
service use has been calculated as share of service inputs in total input cost of manufacturing sectors.
Table 8 below depicts the dependence structure of the manufacturing sector technology groups on
modern producer services and traditional services15 for the benchmark IOTT years.
<b>Table 8 </b>
<b>Manufacturing dependence on services based on technology groups (service input cost as a percentage of total </b>
<b>input cost) </b>
S No. 1993-94
Services/Manufacturing technology
groups*
LOW
(1)
MLT
(2)
MT
(3)
HT
(4)
Manufacturing
(5)
1 Trade, Storage and Transport 22.5 18.0 16.0 20.0 19
2 Finance and Communication services 3.4 4.0 6.1 8.6 5
3 Services 28.6 24.4 25.5 29.5 27
1998-99
LOW
(1)
MLT
(2)
MT
(3)
HT
(4)
Manufacturing
(5)
1 Trade, Storage and Transport 17.3 16.8 13.4 16.7 16
2 Finance and Communication services 5.9 6.1 7.2 8.4 6
3 Services 25.8 25.6 24.3 25.9 25
2003-04
LOW
(1)
MLT
(2)
MT
(3)
HT
(4)
Manufacturing
(5)
1 Trade, Storage and Transport 21.3 14.1 12.8 11.2 16
2
Finance, Communication and Business
services 6.6 4.5 8.9 12.0 7
3 Services 28.9 18.9 23.8 24.7 24
2007-08
LOW
(1)
MLT
(2)
MT
(3)
HT
(4)
Manufacturing
(5)
1 Trade, Transport and Storage 22.6 14.3 13.1 13.9 17
2
Finance, Communication and Business
services 5.9 3.2 7.6 11.1 6
3 Services 30.4 18.1 21.5 27.7 23
2013-14
LOW
(1)
MLT
(2)
MT
(3)
HT
(4)
Manufacturing
(5)
1 Trade, Storage and Transport 14.3 7.6 9.3 8.6 10
2
Finance, Communication and Business
services 3.4 3.6 1.5 1.2 3
15<sub> Modern Services: Services like banking and insurance, business and legal, computer-related and real estate services; Traditional Services: </sub>
</div>
<span class='text_page_counter'>(22)</span><div class='page_container' data-page=22>
3 Services 17.7 11.4 10.9 9.8 13
Source: Author‟s calculation based on IOTT 1993-94, 1998-99, 2003-04 and 2007-08, CSO, MOSPI, GOI and IOTT
2013-14 Kanhaiya and Saluja (2016)
Note: Data on “business services” is separately available only since 2003-04 IOTT. For the years 1993-94 and
1998-99 “business services” category was not separately provided and was a part of a broader category of “other services”.
In Table 8 above, the columns (1)-(4) depict the dependence of all the four manufacturing technology
groups on traditional services in row 1, modern services in row 2 and aggregate services in row 3 for each
benchmark IOTT years. Column (5) for each year depicts the dependence of aggregate manufacturing on the
services. This dependence is characterised by the share of input cost of these services in total input cost of the
manufacturing sectors concerned. A systematic pattern that is clearly visible from Table 8 is that traditional
services have been structurally most important services for the manufacturing sector as a whole and all the
technology groups during the post reforms period. On the other hand, the reliance of manufacturing sector on
modern services was virtually unaltered as opposed to the evidence that these services tend to become
structurally important in manufacturing production with increasing per capita income shown in various cross
country analyses like Park (1989), Park (1994), Francois & Reinert (1996), Guerrieri & Meliciani (2005), and
Driemeier & Nayyar (2018). This observation is notably perverse in the light of rapid service sector growth in
India during this period16. Another clear pattern that emerges from Table 8 is that medium technology and high
technology manufacturing groups have been systematically more intensive users of modern services as compared
low technology and medium low technology groups. This finding is intuitive in terms of the knowledge and skill
intensive nature of medium technology and high technology manufacturing, but also depicts a structural duality
between technology groups within the manufacturing sector. This indicates towards a relatively higher
integration between relatively more productive and skill intensive sectors of the Indian economy17. Studies like
16<sub> This finding has also been discussed in detail in Talreja (2018) which shows that in its rapid growth phase during the post-reform era, the </sub>
service sector and modern services did not witness an increased integration with the manufacturing sector as a whole. Final demand played an
important role as a source of growth and demand for services in India during this period.
17<sub>In the year 2013-14, it can be noticed that there is a steep fall in dependence of manufacturing on services which is also reflected by the </sub>
technology groups. The clear patterns of comparably greater integration higher technology groups (MT and HT) with modern services observed
consistently from 1993-94 and 2007-08 is not seen in 2013-14. As a possible explanation, Talreja (2018) shows that the share of mining &
quarrying saw a steep rise in manufacturing input cost from 16 percent to 24 percent between 2007-08 to 2013-14 as the share of services
declined from 23 percent to 13 percent during the same period. A closer analysis of the 2007-08 and 2013-14 IOTTs shows that the dependence
of medium technology and high technology groups on natural resource based medium low technology manufacturing group (which is highly
integrated with the mining & quarrying sector) increased from 26 percent and 9 percent to 36 percent and 20 percent, respectively. The period
2010-11 to 2014-15 also saw a steep slowdown in manufacturing sector value added growth and the medium & high technology group witnessed
the slowest growth during the post-reforms period, during this period (See Table 4). This slowdown was accompanied by a negative growth of
labour productivity and capital productivity (See Table 2 and Table 6, respectively) of the manufacturing sector which was much more
</div>
<span class='text_page_counter'>(23)</span><div class='page_container' data-page=23>
Banga and Goldar (2005) and Mukherjee (2018) in their analysis of organised manufacturing sector show that in
their estimated production function, services contributed positively to manufacturing sector productivity for the
years 1980-81 to 1999-00 and 2000 to 2014, respectively. Mukherjee (2018) shows this evidence to be mixed at
the disaggregate level. The former is a plant level analysis while the latter is a firm level analysis. Clearly, at a
broad structural level in terms of industry/sectors this did not alter the pattern of reliance of the manufacturing
sector on services during this period. While there is evidence of services impacting productivity in certain
organised segments of manufacturing during this period, this did not alter the structural reliance of the
manufacturing productivity regime on services during this period. On one hand this could be due to
heterogeneity in productivity regimes of manufacturing sector in terms of organised and unorganised sectors and
in terms of technological groups and on the other hand on the nature of service sector growth in India itself.
Service sector growth has been shown to be more driven by final consumption demand and exports as compared
to intermediate demand during its rapid growth phase (Talreja; 2018).
<b>6. The Demand Regime: Domestic Absorption, Exports and Import dependence </b>
<b> Until the previous section the evolution of the productivity regime of the Indian manufacturing sector </b>
was the focus of enquiry within the framework envisaged in section III. As discussed in Section III, that demand
expansion stimulates productivity as output expansion takes place in response to the demand generation. Output
expansion further leads to increased productivity. The analysis of the productivity regime of the Indian
manufacturing sector shows that intra sectoral structural change within the manufacturing sector has led to
widened gap between the workforces engaged in low technology and medium & high technology sectors. This is
based on the distribution value added shares between the technology groups as compared to the employment.
Growth in labour productivity did not involve a sustained process of employment generation. Increased capital
intensity has reflected labour substitution instead of technological upgradation. The productivity regime impacts
the demand generation in the economy through the channels of consumption, investment and exports as
</div>
<span class='text_page_counter'>(24)</span><div class='page_container' data-page=24>
absorption (consumption plus investment) and exports. Domestic absorption and exports together constitute the
effective demand or the realised demand for the domestic production. This is akin to the explanation provided by
Bhaduri (1986). He explains that the actual demand faced by the producers in a capitalist economy reflects the
size of the market. The principle of effective demand determines the size of the market in a capitalist economy as
a part of the production process. The role of imports is crucial in the principle of domestic demand as they
reduce the home market for domestic produce. The impact of the productivity regime on the demand regime in
this framework works through the principle of effective demand. In case of improved export demand through
increased productivity, the size of the market tends to be determined by the distribution of gains from export
among various classes and the import demand generated domestically for consumption and exports. This
conceptual understanding based on this principle of effective demand motivates the methods of analysis in this
section.
Without even looking at the exact distribution of value added that accrued to different classes in the
production process, it is clear from the previous analysis of the productivity regime that intra-sectoral
distribution of value added has worsened in the Indian manufacturing during the post-reforms period. This
analysis involves looking at aggregate demand metrics to understand the nature of the demand regime in the
Indian manufacturing. The analysis begins by looking at the ratio of effective demand to domestic absorption for
the Indian manufacturing sector.
</div>
<span class='text_page_counter'>(25)</span><div class='page_container' data-page=25>
Table 9 below depicts the structure of Indian manufacturing demand in based on the discussion arising from
equations (1) and (2) above.
<b>Table 9 </b>
<b>Components of Indian Manufacturing Final Demand (As a percentage of Effective Demand) </b>
S No.
Components of Manufacturing
Demand/Years 1993-94 1998-99 2003-04 2007-08 2013-14
1 PFCE 61 72 62 52 55
2 GFCE 6 5 4 4 1
3 GFCF 42 37 42 44 30
Domestic Absorption (1+2+3)
4 Valuables 0 0 0 0 4
5 CIS -1 -1 3 19 18
6 Export 25 28 32 30 42
7 Import Demand 32 42 42 49 51
8 Effective Demand 100 100 100 100 100
9
(Effective Demand/Domestic
Absorption)*100; (ED/DA) 92 88 93 100 115
Source: Same as Table 8
</div>
<span class='text_page_counter'>(26)</span><div class='page_container' data-page=26>
down, with build up of inventories and improved export share. In the entire period the import demand for
manufacturing as a share of effective demand rose steeply and consistently from 32 percent in 1993-94 to 51
percent in 2013-14. As the share of manufactured exports increased, the import demand continued to increase
and surpass the exports by an average of 11 percent of the effective demand during the entire period. The most
peculiar finding here is that the period after 1998-99, saw a fall in the importance of private consumption and
decline in relative importance of domestic absorption, significant build up of inventories and increased export
share, but the imports continued to expand its relative importance in the home market. Ghose (2016) argues that
rapid service sector growth in India during the post-reforms period has led to income patterns that have
generated greater demand for manufactured imports. Further, the study shows that in the organized
manufacturing 1999-2000 and 2011-12 became increasingly dependent on imported inputs for production. He
also shows that growth in the organised manufacturing was explained by imported input intensity irrespective
capital or labour intensive industrial classification. These claims can be further verified for the manufacturing
sector as a whole (organised and unorganised manufacturing) in Table 10 and Table 11 below.
<b>Table 10 </b>
<b>Net Imports as a percentage of Domestic Absorption in Indian Manufacturing </b>
S No.
Manufacturing Industries/Years
Technological
Classification
1993-94
1998-99 2003-04
2007-08
2013-14
1 Food Products, Beverages &
Tobacco LT -7 1 -2 -5 0
2 Textiles, Textile Products, Leather
and Footwear LT -35 -49 -46 -36 -36
3 Wood and Products of Wood, Pulp,
Paper, Paper Products, Printing and
Publishing LT 30 45 42 29 123
4 <sub>Manufacturing, n.e.c.; recycling </sub> <sub>LT </sub> <sub>8 </sub> <sub>4 </sub> <sub>67 </sub> <sub>17 </sub> <sub>-47 </sub>
5 <sub>Rubber and Plastic Products </sub> <sub>MLT </sub> <sub>-15 </sub> <sub>-4 </sub> <sub>-25 </sub> <sub>-7 </sub> <sub>72 </sub>
6 Coke, Refined Petroleum Products
and Nuclear Fuel MLT 104 109 20 -19 -53
7 Other Non-Metallic Mineral
Products MLT -404 -864 -32 0 58
8 Basic Metals and Fabricated Metal
Products MLT 31 120 61 89 2760
9 <sub>Ships and boats </sub> <sub>MLT </sub> <sub>16 </sub> <sub>28 </sub> <sub>132 </sub> <sub>399 </sub> <sub>95 </sub>
10 <sub>Chemicals and Chemical Products </sub> <sub>MHT </sub> <sub>71 </sub> <sub>78 </sub> <sub>40 </sub> <sub>124 </sub> <sub>198 </sub>
11 <sub>Machinery, n.e.c. </sub> <sub>MHT </sub> <sub>31 </sub> <sub>41 </sub> <sub>15 </sub> <sub>42 </sub> <sub>30 </sub>
12 <sub>Electrical machinery </sub> <sub>MHT </sub> <sub>14 </sub> <sub>23 </sub> <sub>6 </sub> <sub>16 </sub> <sub>20 </sub>
13 Rail Road, motor vehicles and
</div>
<span class='text_page_counter'>(27)</span><div class='page_container' data-page=27>
14 <sub>Drugs and medicines </sub> <sub>HT </sub> <sub>-71 </sub> <sub>-412 </sub> <sub>-133 </sub> <sub>-226 </sub> <sub>-61 </sub>
15 Radio, TV and Communication
equipments HT 11 32 44 95 123
16 <sub>Other high-tech manufacturing </sub> <sub>HT </sub> <sub>3 </sub> <sub>-5 </sub> <sub>51 </sub> <sub>82 </sub> <sub>31 </sub>
17 <sub>Manufacturing </sub> <sub>7 </sub> <sub>12 </sub> <sub>9 </sub> <sub>19 </sub> <sub>10 </sub>
Source: Same as Table 9
Table 10 above depicts the ratio of net imports (excess of imports over exports) to domestic absorption
in the Indian manufacturing. A negative percentage shows the excess of exports over imports in the Table 10
above. As a broad observation, the Indian manufacturing witnessed a penetration of imports in the home market
throughout the post-reforms period. This is depicted by a large and positive net import share of the domestic
absorption in all the years shown in Table 10. It is noteworthy to see that in 2007-08 and 2013-14 when the share
of private consumption in effective demand went down, inventory accumulation share went up significantly
(Table 9), the import penetration as depicted in Table 10 continued to be higher than 1993-94. Further of the six
medium high and high technology industries only Drugs and medicines was a net exporter.
The idea of import dependence can be further analysed by observing the imported input intensity of the
Indian manufacturing sector. The imported input intensities have been computed for the IOTTs in the following
manner:
(∑
∑<sub> </sub> )
<i>In equation (1) A is the original input output coefficient matrix where each aij depicts the value of input </i>
<i>procured by sector j from sector i and expressed as a ratio of gross value of output of sector j denoted by Xj. The </i>
<i>coefficient of input aij consists of both imported and domestic inputs. Ad is the coefficient matrix of domestic </i>
<i>inputs. The Ad matrix is not provided by the CSO and has been estimated using the methodology suggested by </i>
Bhattacharya & Rajeev (2014) and Veeramani (2016) for the Indian IOTTs (See Appendix C for the
</div>
<span class='text_page_counter'>(28)</span><div class='page_container' data-page=28>
<b>Table 11 </b>
<b>Imported input intensity of manufacturing sub-sectors (Percentage of imported inputs to total input cost) </b>
S No. Manufacturing Sectors/Years
Technological
Classification
1993-94
1998-99
2003-04
2007-08
2013-14
1
Food Products, Beverages &
Tobacco LT 2 4 3 3 5
2
Textiles, Textile Products,
Leather and Footwear LT 4 5 5 6 12
3
Wood and Products of Wood,
Pulp, Paper, Paper Products,
Printing and Publishing LT 7 11 9 8 12
4 Manufacturing, n.e.c.; recycling LT 10 14 29 16 19
5 Rubber and Plastic Products MLT 9 11 9 13 13
6
Coke, Refined Petroleum
Products and Nuclear Fuel MLT 34 36 51 58 53
7
Other Non-Metallic Mineral
Products MLT 17 21 15 16 32
8
Basic Metals and Fabricated
Metal Products MLT 10 16 19 23 24
9 Ships and boats MLT 11 13 41 62 21
10 Chemicals and Chemical Products MT 12 14 12 19 24
11 Machinery, n.e.c MT 12 16 13 19 21
12 Electrical machinery MT 9 14 12 18 18
13
Rail Road, motor vehicles and
transport equipment MT 11 11 9 14 17
14 Drugs and medicines HT 6 8 7 9 19
15
Radio, TV and Communication
equipments HT 9 15 13 24 27
</div>
<span class='text_page_counter'>(29)</span><div class='page_container' data-page=29>
17 Average Imported input intensity 10 14 16 21 21
18 Manufacturing 10 12 15 20 25
Source: Same as Table 9
A clear pattern that emerges from Table 11 is the consistent and considerable rise in the imported-input
intensity of the manufacturing sector in aggregate terms (Row 18). At the level of sub-sectors also there has been
a consistent upward movement of imported input intensity across the technological spectrum. In the
low-technology category all the sectors except Manufacturing, n.e.c.; recycling, the imported input intensity has been
considerably lower than the other sectors of the Indian manufacturing. Moreover, except Manufacturing, n.e.c.;
recycling, the imported input intensity of the low technology sector has been consistently lower than the average
imported input intensity (except in the benchmark IOTT year 2003-04) of the 16 classified manufacturing
sub-sectors. In the medium low technology category except Rubber and Plastic Products, all the sectors displayed
much higher intensity of imported inputs during the entire period as compared to all the other sectors and the
average imported input intensity. Within the medium technology and high technology category Rail Road, motor
vehicles and transport equipment and drugs and medicines showed relatively low imported input intensity of
production. The other sectors in the high technology category i.e. Radio, TV and Communication equipments
and other high-tech manufacturing were either close to or higher than the average imported input intensity across
sectors. The low technology sectors were less imported-input intensive than resource based medium low
technology sectors and high skill medium and high technology sectors in general.
</div>
<span class='text_page_counter'>(30)</span><div class='page_container' data-page=30>
Rakshit (2007), Nayyar (2012), Ghose (2015) and Talreja (2018) have shown that final demand has been more
important driver of service sector demand as compared to intermediate demand. Further, Talreja (2018) has
shown that private consumption and exports have been two most important sources of service sector demand.
Moreover, the previous section shows that manufacturing dependence on service sector inputs did not increase
during the post-reform period. In relation to this finding Kucera and Jiang (2019) show that developed
manufacturing sector dependence on service sector in terms of its share in manufacturing production has been
much higher than for manufacturing in emerging economies which includes India between 1995 and 2009. These
findings suggest that the nature of service sector growth in India is different from the developed economies.
More specifically, because of its lack of integration with the production in different sectors specially
manufacturing of the Indian economy as compared to its rapid growth in India and the pattern of manufacturing
dependence on services observed in various developed economies by various studies like Park (1989), Park
(1994), Francois & Reinert (1996), Guerrieri & Meliciani (2005), Driemeier & Nayyar (2018) Kucera & Jiang
(2019). Studies like Rakhsit (2007), Nayyar (2012) and Ghose (2015) have suggested that rapid services sector
growth has accompanied greater inequality in India. This has happened through both changing demand pattern
that has fuelled the growth of services and service sector growth itself benefitting relatively small section of the
Indian population. Talreja (2018) and the present analysis of manufacturing sector show that value added
composition within manufacturing and services has disproportionately shifted towards high skill and less
employment intensive sectors during this period. This indicates towards a crude evidence of production related
inequality in the Indian workforce. The claims and arguments made so far by analysing the aggregate figures can
be further verified by a detailed analysis of the household consumption across various classes. This will help in
understanding if the principle of effective demand has worked in determining the aggregate demand through the
pattern of demand at the level of households belonging to different classes.
</div>
<span class='text_page_counter'>(31)</span><div class='page_container' data-page=31>
added medium and high technology manufacturing has become more important during the post reform period. It
needs to be seen if this has also changed the export orientation of the Indian economy.
Table 12 below looks at the export diversification and concentration indices for the Indian
manufacturing during the post-reform period. The export diversification index is based on Moneta and
Stepanova (2018) index of diversification of commodities in household food expenditure.
∑
Where Si is the share of ith commodity in total manufactured exports and n is the total number of
commodities. A greater value of D indicates greater diversity ranging between 0 and 1. The index of
concentration is based on the Herfindahl-Hirschmann Index using the UNCTAD definition of the index. This is
as follows:
(√∑ ( <sub> )</sub> ) √
√
Where xi is the value of ith commodity exports, X is the total value of exports and n is the total number of
commodities. A higher value of H ranging between 0 and1 depicts greater concentration of exports towards lesser
commodities.
<b>Table 12 </b>
<b>Indian Manufacturing Exports Diversity and Concentration index over years </b>
Index/Year 1993-94 1998-99 2003-04 2007-08 2013-14
Exports
Diversity
Index 0.85 0.85 0.87 0.88 0.88
Exports
Concentration
Index
0.11 0.11 0.17 0.13 0.11
Source: Same as Table 9
</div>
<span class='text_page_counter'>(32)</span><div class='page_container' data-page=32>
sector is export oriented if the ratio of net exports to domestic output is greater than five percent. This method
has been used to identify export oriented sectors in the Indian manufacturing in Table 13 below.
<b>Table 13 </b>
<b>Export orientation of manufacturing sub-sectors (Net Exports as a percentage of Domestic Gross Output) </b>
S No. Manufacturing Sectors/Years
Technological
Classification*
1993-94
1998-99 2003-04
2007-08
2013-14
1 Food Products, Beverages & Tobacco LT 5 -1 2 3 0
2
Textiles, Textile Products, Leather and
Footwear LT 18 24 23 16 19
3
Wood and Products of Wood, Pulp,
Paper, Paper Products, Printing and
Publishing LT -8 -14 -11 -9 -11
4 Manufacturing, n.e.c.; recycling LT -5 -3 -60 -6 14
5 Rubber and Plastic Products MLT 5 1 6 2 -17
6
Coke, Refined Petroleum Products and
Nuclear Fuel MLT -37 -40 -4 5 11
7 Other Non-Metallic Mineral Products MLT 27 27 3 0 -3
8
Basic Metals and Fabricated Metal
Products MLT -5 -17 -11 -15 -19
9 Ships and boats MLT -21 -31 -374 -122 -255
10 Chemicals and Chemical Products MT -10 -11 -6 -16 -19
11 Machinery, n.e.c MT -34 -47 -10 -26 -34
12 Electrical machinery MT -11 -15 -3 -9 -11
13
Rail Road, motor vehicles and transport
equipment MT -21 2 4 -1 5
14 Drugs and medicines HT 5 10 12 18 23
15
Radio, TV and Communication
equipments HT -11 -37 -26 -99 -170
16 Other high-tech manufacturing HT -2 3 -83 -207 -36
</div>
<span class='text_page_counter'>(33)</span><div class='page_container' data-page=33>
Source: Author‟s calculation based on IOTT 1993-94, 1998-99, 2003-04 and 2007-08, CSO, MOSPI, GOI and IOTT
2013-14 Kanhaiya and Saluja (2016)
*LT- Low-technology; MLT: Medium-low technology; MHT: Medium high technology; HT: High technology
Note: The sector “Other high tech manufacturing” is not strictly comparable the definition in1993-94 and 1998-99 on
one hand and 2003-4, 2007-08 and 2013-14 on the other hand. The former definition contains “watches and clocks”
and “office computing machinery” and the latter definition is “watched and clocks”, “medical, optical and precision
instruments” and “aerospace”.
Table 13 above shows the ratio of net exports by domestic gross output for each sector for the
benchmark IOTT years during the post-liberalization period. All the negative values in Table 13 reflect sectors
where the value of imports has been greater than value of exports. The only two sectors that consistently
remained export oriented during the post-reform period are Textiles, Textile Products, Leather and Footwear and
Drugs and medicines. The former being a low-technology sector and the latter being a high technology sector.
Analysing the IOTTs it has been seen that across the benchmark years the share of the former in manufacturing
value added declined from 17 percent to 12 percent but remained constantly much larger than the latter which
hovered around 3 percent across the IOTT years. A relatively much smaller segment of high technology
manufacturing has been export-oriented during this period while a much larger low technology sector saw a
decline in the value added share despite being export oriented18. Another, clear and noteworthy pattern here is
the consistently high degree of import penetration faced by medium and high technology sectors like Chemicals
and Chemical Products, Machinery, n.e.c. and Electrical machinery during this period. High tech sectors like
Radio, TV and Communication equipments saw a steep rise in the share of net imports during this period. Wood
and Products of Wood, Pulp, Paper, Paper Products, Printing and Publishing which is low technology sector also
faced considerable degree of import penetration during this period but also saw steep decline in its value added
share in manufacturing. Ships and boats sector belonging to medium low-technology also faced clear and
consistently high level of net import but remained below one percent in terms of value added share in
manufacturing across IOTT benchmark years19. The broader understanding that emerges from this analysis
suggests that the structural adjustment of value added shares within manufacturing during post-liberalization era
from low technology sector towards higher spectrum of technology did not translate into an export oriented
demand regime, but an import-dependent demand regime. The structure of export orientation did not change as
18<sub> India KLEMS database also shows a similar decline in the value added share of Textiles, Textile Products, Leather and Footwear and Wood </sub>
and Products of Wood, Pulp, Paper, Paper Products, Printing and Publishing during this period both in real and nominal terms. The data on drugs
and medicines and ships and boats is not separately available in India KLEMS database.
</div>
<span class='text_page_counter'>(34)</span><div class='page_container' data-page=34>
only the same two broad sub-sectors remained export-oriented. The manufacturing sector as a whole was far
from being export oriented as net exports were in the negative zone as depicted by all the benchmark years.
Clearly, the structural inertia in the export orientation of the Indian economy suggests that the domestic demand
pattern has been an important factor in determining the structural change within Indian manufacturing.
<b>V. </b> <b>SUMMARY AND DISCUSSION </b>
The global manufacturing has witnessed important structural changes since the 1970s, both in terms of
geographical re-location of production and composition in terms increase in output share of technologically
sophisticated groups of manufacturing sectors. As discussed in Section II, there has been structural shift of
manufacturing production from developed to the developing world, a trend which has been dominated by Asian
economies and more specifically the East Asian economies. This period also saw a global increase in the share of
service sector, as services became fundamentally more important in the global structure of production (Felipe et.
al. 2013 and Driemeier & Nayyar 2018). At the same time, the post-liberalisation era after 1991, in India
witnessed a stagnation of output and employment in the manufacturing sector share, accompanied by a rapid rise
in service sector output share and modest increase in its employment share. As discussed in Section II, there are
various studies that have analysed the trajectory of Indian manufacturing sector output and employment growth
during the post-reform period. But there has been an absence of an analysis of structural change in the Indian
manufacturing sector anchored to the global change in manufacturing sector production and an analytical
framework that can explain industrial transition towards higher levels of economic development through
manufacturing sector led success. This paper has presented an analytical framework to assess the structural
change within the Indian manufacturing sector during the post-reforms period. This framework identifies that
mutually reinforcing demand and productivity regimes in the manufacturing sector lead to a virtuous growth
process in the economy with both employment and labour productivity expansion. The important ingredients of
the process that lead to this mutually reinforcing relationship like technological upgradation, capital deepening,
use of modern service inputs and export expansion and diversification have been the focus of enquiry in this
paper.
</div>
<span class='text_page_counter'>(35)</span><div class='page_container' data-page=35>
The sectors in this analysis were classified into technology groups based on technological sophistication from
low technology to medium and high technology groups. Such an analysis of structural change of the Indian
manufacturing against the global structural change in manufacturing has been absent. This paper provides some
useful insights in understanding the implications of the post-reforms structural change and growth process of the
Indian economy. The analysis of compositional change within Indian manufacturing finds that during the period
from 1990-91 to 2014-15 also the post-liberalization era witnessed an adjustment in composition of value added
in favour of medium & high technology groups of manufacturing at the expense of low technology
manufacturing. The share of the former increased from 25 percent to 35 percent and that of the latter fell from 45
percent to 35 percent. Despite this, low technology manufacturing continued to support bulk of manufacturing
employment. The share of low technology group fell from 70 percent to 65 percent of manufacturing
employment during this period. This shows a persistent and widened presence of large labour productivity gaps
within the manufacturing sub-sectors across technology groups. This observation indicates worsened
intra-sectoral distribution of value added in the Indian manufacturing. The analysis of the interplay of the productivity
regime, demand regime and employment growth of the manufacturing sector shows that there was an
improvement of employment elasticity of output in the aggregate terms. But the analysis at the level of
technology groups shows that periods of high employment elasticity were an outcome of extremely low or
negative labour productivity growths in different technology groups in different periods. The aggregate outcome
does not reflect the lack of sustained labour productivity and employment generating growth within the
</div>
<span class='text_page_counter'>(36)</span><div class='page_container' data-page=36>
happens elsewhere in the economy through introduction of new production processes. In terms of capital
deepening, the analysis of capital intensity growth and capital productivity growth shows that the low technology
group and medium low technology group also faced a sustained increase in capital intensity during this period.
This increase reflected labour substitution as opposed to technological upgradation. This is depicted by negative
capital productivity growth in these technology groups. This process depicts a change which has been
unfavourable for low skill and low productivity employment within the manufacturing sector. Another important
analysis in this paper has been the study of structure of dependence of manufacturing sector on modern and
traditional services, given the increased role of services in global productivity regime and their rapid growth in
India. This analysis shows that the Indian manufacturing sector was much more dependent on traditional services
as opposed to modern services during the entire period. Additionally, it was found that there were greater
synergies and inter-dependence between medium and high technology group and modern services as compared
to low technology manufacturing. But the overall dependence of the manufacturing on modern services did not
intensify during this period. This structural inertia in dependence pattern has been a peculiar finding about
India‟s productivity regime which has been quite distinct from global evidence and rapid growth of services in
the domestic economy.
The analysis of the demand regime has been to understand the nature of effective demand faced by the
Indian manufacturing during the post-reforms period. The principle of effective demand contextualises the
channel through which production process affects aggregate demand and output expansion. The distribution of
productive gains to different classes in the production process determines the composition and size of aggregate
demand in this framework. Looking at the domestic absorption and export orientation of the Indian
</div>
<span class='text_page_counter'>(37)</span><div class='page_container' data-page=37>
The main insight of that these analyses convey is that the productivity and demand regimes of the
Indian manufacturing could not sustainably create a productivity enhancing, employment generating structural
change within the manufacturing sector. The structural change towards higher share of high technology
manufacturing production did not alter the export structure as compared to the economies like Japan, South
Korea and Taiwan which simultaneously altered their production and export structures. India continued to stay a
net importer of manufactured products as the value added composition changed. From the point of view of
inclusiveness this change was skill biased and the gains from this change were skewed towards smaller sections
of the workforce. Moreover, the demand regime progressively became more import-dependent. This calls for a
serious enquiry of the demand structure of the Indian economy, specifically the pattern of consumption demand,
which is an important element of the demand regime. An important issue that this study did not look at is the
environmental sustainability of the structural change through manufacturing development, as this study looked at
a more conventional analytical framework of economic development. The economic development paradigm
remains incomplete without internalising environmental sustainability of growth with inclusiveness in its
analytical framework. Inclusiveness and sustainability taken together are the important challenges facing
economic development.
<b>VI. </b> <b>APPENDIX </b>
<b>1. Appendix A </b>
<b>Classification of manufacturing sectors based on technology intensity </b>
The classification of manufacturing sectors into technology groups has been provided in Table 11
below:
<b>Table 11 </b>
<b>OECD Classification of Manufacturing Industries based on Technology </b>
S No.
Technological
Classification
Industries
1
Low-Technology
</div>
<span class='text_page_counter'>(38)</span><div class='page_container' data-page=38>
Textiles, textile products, leather and footwear
2
Medium-low
technology
Building and repairing of ships and boats
Rubber and plastics products
Coke, petroleum products and nuclear fuel
Other non-metallic mineral products
Basic metals and fabricated metal products
3
Medium-high
technology
Electrical machinery and apparatus, nec.
Motor vehicles, trailers and semitrailers
Chemicals excluding pharmaceuticals
Railroad equipment and transport equip, nec.
Machinery and equipment, nec.
4
High technology
Aircraft and spacecraft
Pharmaceuticals
Office, accounting and computing machinery
Radio, TV and communications equipment
Medical, precision and optical instruments
Source: OECD (2011,
The technology group 3 Medium-high technology has been referred to as Medium technology in this
paper. The India KLEMS database does not provide data separately on any of the high technology group 4
sub-sectors. These sub-sectors in India KLEMS database are part of the sectors provided in group 3. In India
KLEMS database, “Aircraft and spacecraft” is a part of “Motor vehicles, trailers and semitrailers” compositely
called “transport equipment”, “Pharmaceuticals” is a part of “Chemicals and chemical products”, “Office,
accounting and computing machinery” is a part of “Machinery and equipment, nec.” and “Radio, TV and
communications equipment” and “Medical, precision and optical instruments” are parts of “Electrical
</div>
<span class='text_page_counter'>(39)</span><div class='page_container' data-page=39>
previously. The UNIDO website
/>
also provides a similar 3 technology group classification specifically for developing regions where sometimes
the high technology industries are not well developed or absent.
<b>2. Appendix B </b>
Employment elasticity, labour productivity growth, output growth and employment growth have been
computed using the following methodological basis provided by Upender (1998) and Kapsos (2005).
Generalized computation of output growth, employment growth and labour productivity growth:
Where for each variable of gross value added/output denoted by Y, employment denoted by L and
labour productivity given by Y/L and equation (1) is separately estimated for each of these variables,
respectively for five year intervals. T denotes time trend in equation (1). The estimated for each variable gives
<i>the growth rate of each variable. Employment elasticity is denoted by ε is estimated as n/gy where n denotes </i>
<i>employment growth rate and gy denotes output growth rate. </i>
The interpretation of employment elasticities under different scenarios has been borrowed from Kapsos
(2011) and is presented in Table 12 below:
<b>Table 12 </b>
<b>Interpreting employment elasticities </b>
GDP growth
Employment
elasticity
Positive GDP
growth
Negative GDP
growth
< 0
(-) employment
growth
(+) productivity
growth
(+) employment
growth
(-) productivity
growth
0 ≤ ≤1
(+) employment
growth
(+) productivity
</div>
<span class='text_page_counter'>(40)</span><div class='page_container' data-page=40>
growth growth
> 1
(+) employment
growth
(-) productivity
growth
(-) employment
growth
(+) productivity
growth
Source: Kapsos (2005)
<b>3. Appendix C </b>
<i>The methodology for estimating matrix Ad of domestic input coefficients for the Indian IOTTs based on </i>
Bhattacharya & Rajeev (2014) and Veeramani (2016)
<sub> </sub>
(
)
<i>Where Ii depicted in equation (1) is the ratio of total intermediate use of input i denoted by IIUSEi in all </i>
<i>the n sectors of the economy to the sum of total domestic gross value of output of sector i denoted by GVOi and </i>
<i>total value of imports of sector i. The total IIUSEi is the sum of all the intermediate use of sector i in all the n </i>
sectors of the economy from domestic and imported sources. Equation (2) depicts the estimation of the total
<i>intermediate use of sector i in all the n sectors of the economy denoted by DIIUSEi. In equation (4) Matrix D is </i>
<i>the n*n diagonal matrix with ri as the diagonal elements, where ri as depicted in equation (3) denote the ratio of </i>
<i>DIIUSEi to IIUSEi for each sector i. Finally, equation (5) gives the n*n Ad matrix of domestic input coefficients </i>
<i>where each element is denoted by dij, where each dij=Dij/Xj, Dij is the domestically sourced use of intermediate </i>
<i>use of sector i as an input in sector j and Xj is the total gross value of output of sector j. Matrix A is the n*n </i>
matrix of total input coefficients sourced from both domestic and imported sources, where each element is
<i>denoted by aij=Aij/Xj and Aij is the intermediate use of sector i in sector j as an input. </i>
</div>
<span class='text_page_counter'>(41)</span><div class='page_container' data-page=41>
<b>Table 13 </b>
<b>Indirect Employment generated by broad sectors of the Indian economy (as a percentage of total </b>
<b>indirect employment generated in the economy) </b>
Sectors/Year 1993-94 1998-99 2003-04 2007-08 2013-14
Agriculture,
Forestry and
Fishing 6 4 4 3 2
Mining &
Quarrying 0.04 0.02 0.11 0.09 0.05
Manufacturing 57 60 60 55 61
Construction 13 10 12 17 16
Utilities* 1 1 0.5 0.3 1
Services 23 25 24 24 20
Source: Author‟s calculation using India KLEMS database and IOTTs, various years
*Electricity, Gas and Water Supply
<b>Table 14 </b>
<b>Manufacturing sub-sector indirect employment (in millions) </b>
S No. Manufacturing Sectors/Years
Technological
classification
1993-94
1998-99
2003-04
2007-08
2013-14
1
Food Products, Beverages and
Tobacco LT
25.4
38.5
44.6
41.8
56.5
2
Textiles, Textile Products,
Leather and Footwear LT
11.0
9.9
13.1
16.6
14.5
3 Wood and Products of wood LT
0.2
0.2
0.3
0.8
3.1
4
Pulp, Paper,Paper
products,Printing and Publishing LT
0.7
0.7
0.9
1.6
0.4
5 Manufacturing, nec; recycling LT
1.6
2.7
1.6
5.0
7.2
6
Coke, Refined Petroleum
Products and Nuclear fuel MLT
1.2
1.1
1.4
2.8
1.8
7 Rubber and Plastic Products MLT
0.5
0.5
0.7
1.7
3.8
8
Other Non-Metallic Mineral
Products MLT
0.6
0.5
0.3
0.5
0.3
9
Basic Metals and Fabricated
Metal Products MLT
1.1
0.8
1.5
2.9
2.1
</div>
<span class='text_page_counter'>(42)</span><div class='page_container' data-page=42>
Products 2.3 2.0 3.7 3.4 3.4
11 Machinery, nec. MHT
1.6
1.6
2.0
3.1
3.7
12 Electrical and Optical Equipment MHT
2.0
1.9
3.6
2.9
1.8
13 Transport Equipment MHT
1.9
1.6
2.4
3.4
4.9
14 Manufacturing
50.4 61.9 76.0 86.4 103.4
Source: Author‟s calculation based on India KLEMS database and IOTTs 1993-94, 1998-99, 2003-04 and 2007-08,
CSO, MOSPI, GOI and IOTT 2013-14 Kanhaiya and Saluja (2016)
<b>References </b>
Astorga, R., Cimoli, M. and Porcile, G., (2014),“The role of industrial and exchange rate policies in
<i>promoting structural change, productivity and employment” Transforming economies: Making industrial </i>
<i>policy work for growth, jobs and development, pp.79-112. </i>
Banga, R., and Goldar, B. (2004), “Contribution of services to output growth and productivity in Indian
<i>manufacturing: pre-and post-reforms”, Working Paper No. 139, Indian Council For Research On </i>
<i>International Economic Relations, New Delhi. </i>
<i>Bhat, T.P. (2014).“India, Structural Changes in the Manufacturing Sector and Growth Prospect”, Working </i>
<i>Paper No.173, Institute for Studies in Industrial Development, New Delhi.</i>
Bhattacharya, T. and Rajeev, M. (2014), “Identifying the High-linked Sectors for India: An Application of
<i>Import-adjusted Domestic Input-output Matrix”, Working Paper 329, Institute for Social and Economic </i>
Change, Bangalore.
<i>Chaudhuri, S. (2002). “Economic reforms and industrial structure in India”. Economic and Political Weekly, </i>
Vol. 37, No. 2, pp.155-162.
Chandrasekhar, C. P. (2015), “Promise Belied: India‟s Post-Independence Industrialization
<i>Experience”, Indian Industrialisation, ICSSR Research Survey and Explorations: Economics, edited by CP </i>
<i>Chandrasekhar, Volume 1. </i>
Dasgupta, S. and Singh, A., (2005),” Will services be the new engine of Indian economic
<i>growth?” Development and Change, Vol. 36, No. 6, pp.1035-1057.</i>
</div>
<span class='text_page_counter'>(43)</span><div class='page_container' data-page=43>
<i>Datta, M. (2015), “Stagnant Manufacturing and Baumol‟s Disease: Indian Economy since 1968-69” ICRA </i>
<i>Bulletin, Money and Finance (July 2015), pp 69-97. </i>
Dietzenbacher, E., Albino, V. and Kuhtz, S. (2005), “The fallacy of using US-type input-output tables”
<i>INTERNATIONAL CONFERENCE ON INPUT-OUTPUT TECHNIQUES, Vol. 15, pp. 277-299. </i>
<i>Driemeier, M.H. and Nayyar, G. (2018), “Trouble in the making? The future of manufacturing-led </i>
<i>development”, The World Bank, Washington, DC. </i>
<i>Eichengreen, B. and Gupta, P. (2011), “The two waves of service-sector growth” Oxford Economic </i>
<i>Papers, Vol .6, No.1, pp. 96-123. </i>
<i>Felipe, J., Briones, R., Brooks, D.H., Mehta, A. and Verspagen, H., (2013) “Asia’s Economic </i>
<i>Transformation Where to, How, and How Fast?” Key indicators for Asia and the Pacific. Manila: ADB. </i>
http://www. adb. org/sites/default/files/publication/30358/ki2013-special-chapter. pdf.
Francois, J. and Reinert, K., (1996), “The role of services in the structure of production and trade: stylized
<i>facts from a cross-country analysis”, Asia-Pacific Economic Review, Vol. 2, No.1, pp.35-43.</i>
<i>Ghani, E., and O‟Connell, S.D. (2014), “Can Service Be a Growth Escalator in Low Income Countries?”, </i>
<i>Policy Research Working Paper 6971, Macroeconomics and Fiscal Management Global Practice Group, </i>
The World Bank.
Ghani, E., Grover, A.G., and Kerr, W.R. (2016), “Spatial development and agglomeration economies in
<i>services--lessons from India” Working paper No. 7741, The World Bank. </i>
<i>Goldar, B. (2000),“Employment growth in organised manufacturing in India”, Economic and Political </i>
<i>weekly, Vol. 35, No. 14, pp.1191-1195. </i>
<i>Ghose, A.K. (2000),”Trade liberalization and manufacturing employment”, Employment paper 2000/03, </i>
International Labour Office, Geneva.
---<i>(2015), “Services-led Growth and Employment in India”, in Ramaswamy, K.V. (eds.) Labour, </i>
<i>Employment and Economic Growth in India, Cambridge University Press, Cambridge, UK. </i>
<i>--- (2016) “India Employment Report 2016: Employment Challenge and the Imperative of </i>
<i>Manufacturing-Led Growth”, Oxford University Press, New Delhi. </i>
Guerrieri, P., and Meliciani, V. (2005), “Technology and international competitiveness: The
<i>interdependence between manufacturing and producer services”, Structural change and economic </i>
<i>dynamics, Vol. 16, No. 4, pp. 489-502.</i>
<i>Hirschman, A.O. (1958), “The Strategy of Economic Development”, Yale University Press, New Haven. </i>
<i>Jones, L.P. (1976), “The Measurement of Hirschmanian Linkages”, The Quarterly Journal of Economics, </i>
Vol. 90, No. 3, pp. 323-333.
</div>
<span class='text_page_counter'>(44)</span><div class='page_container' data-page=44>
Kapsos, S. (2005), “Employment Intensity of Growth: The Trends and Macroeconomic Determinants”
<i>Employment Strategy Papers 2005/12, International Labour Organization. </i>
Kochhar, K., Kumar, U., Rajan, R., Subramanian, A., and Tokatlidis, I. (2006),“India's pattern of
<i>development: What happened, what follows?”, Journal of Monetary Economics, Vol.53, No.5, pp. </i>
981-1019.
Kucera, D., and Roncolato, L. (2016), “The manufacturing–services dynamic in economic
<i>development”, International Labour Review, Vol. 155, No.2, pp. 171-199. </i>
Kucera, D., & Jiang, X. (2019),“ Structural transformation in emerging economies: leading sectors and the
<i>balanced growth hypothesis” Oxford Development Studies, Vol. 47, No. 2, pp. 188-204. </i>
Lall, S. (2000), “The Technological structure and performance of developing country manufactured exports,
1985‐98”, Oxford development studies, Vol. 28, No. 3, pp.337-369.
<i>Lavopa, A., and Szirmai, A. (2015), “Industrialisation in Time and Space”, Working Paper No. 039, </i>
UNU-MERIT Working Papers.
<i>Nayyar, G. (2012),“The Service Sector in India’s Development” Cambridge University Press, Cambridge, </i>
UK.
Mehrotra, S., Sinha, S., Parida, J.K. and Gandhi, A. (2014), “Why a jobs turnaround despite slowing
<i>growth?”, IAMR Occasional paper No. 1/2014, Institute of Applied Manpower Research, New Delhi.</i>
Palma, J.G., (2009), “Flying-geese and waddling-ducks: the different capabilities of East Asia and Latin
America to „demand-adapt‟and „supply-upgrade‟their export productive capacity”
in M Cimoli, G Dosi
<i>and J Stiglitz (eds.), The Political Economy of Capabilities Accumulation: the Past and Future of </i>
<i>Policies for Industrial Development</i>
<i> , OUP</i>.Papola, T.S. (2006), “Emerging Structure of the Indian Economy: Implications of Growing Inter Sectoral
<i>Imbalances”, Indian Economic Journal, Vol. 54, No. 1, pp. 5-25. </i>
Park, S.H. (1989), “Linkages Between Industry And Services And Their Implications For Urban
<i>Employment Generation In Developing Countries”, Journal of Development Economics, Vol. 30, pp. </i>
359-379.
---(1994), “Intersectoral relationships between manufacturing and services: new evidence from selected
<i>Pacific Basin countries” ASEAN Economic Bulletin, Vol. 10, pp.245-263. </i>
Rani, U., and Unni, J. (2004), “Unorganised and organised manufacturing in India: Potential for
<i>employment generating growth”, Economic and Political Weekly,</i> Vol. 39, No. 41 pp.4568-4580.
<i>Rakshit, M. (2007), “Services-led Growth: The Indian Experience”, Money and Finance, Vol. 3, No. 1, pp. </i>
91-126.
</div>
<span class='text_page_counter'>(45)</span><div class='page_container' data-page=45>
<i>Singh, K. and Saluja, M.R. (2016), “Input-Output Table for India: 2013-14”, Working Paper No.111, </i>
National Council for Applied Economic Research, New Delhi.
Storm, S. and Naastepad, C.W.M., (2005), “Strategic factors in economic development: East Asian
<i>industrialization 1950–2003” Development and Change, Vol. 36, No. 6, pp.1059-1094. </i>
Szirmai, A. (2012), “Industrialisation as an engine of growth in developing countries, 1950–
<i>2005”, Structural change and economic dynamics, Vol. 23, No. 4, pp.406-420. </i>
Talreja, C. (2018) “Exploring India‟s Economic Structure: The case of manufacturing services
<i>inter-linkages” paper presented at the 26th<sub> International Input-Output Conference, Juiz De Fora, Brazil, 25</sub>th<sub> to </sub></i>
<i>29th June, 2018. </i>
Upender, M. (1998), “Elasticities of Employment with Respect to Output and Wage Rate in Organised
<i>Sector”, Indian Journal of Industrial Relations, Vol. 33, No.4, pp. 537-544. </i>
<i>Vashisht, P. (2016), “Creating manufacturing jobs in India: Has openness to trade really helped?”, Working </i>
<i>Paper 303, Indian Council for Research on International Economic Relations, New Delhi.</i>
<i>Veeramani, C. (2016), “Inter-linkages between Exports and Employment in India”, Occasional paper no. </i>
<i>179, EXIM Bank, New Delhi. </i>
Weiss, J., (2005) “Export growth and industrial policy: Lessons from the East Asian miracle experience”,
</div>
<!--links-->
<a href=' />