The Zeta Potential Measurements in Sandpacks Saturated with Monovalent Electrolytes
Bạn đang xem bản rút gọn của tài liệu. Xem và tải ngay bản đầy đủ của tài liệu tại đây (454.89 KB, 12 trang )
<span class='text_page_counter'>(1)</span><div class='page_container' data-page=1>
8
The Zeta Potential Measurements in Sandpacks Saturated
with Monovalent Electrolytes
Luong Duy Thanh
*<i>Thuy Loi University, 175 Tay Son, Dong Da, Hanoi, Vietnam </i>
Received 16 October 2017
Revised 15 November 2017; Accepted 16 January 2018
<b>Abstract: Measurements of the zeta potential in sandpacks saturated with monovalent electrolytes </b>
at six different electrolyte concentrations have been reported. The values we record are classified
into two groups based on the magnitude of the zeta potential: group 1 (samples S1 and S2) and
group 2 (samples S3 and S4). The measured zeta potential in magnitude in group 1 is much
smaller than that in group 2 and in literature at the same electrolyte concentration. The reason for a
big variation of the zeta potential between group 1 and group 2 may be due to the difference in
technique of making sand particles of different size leading to change of particle surface
properties. Consequently, the zeta potential that depends on the surface properties would vary. The
results show that there is a gradual decrease in the zeta potential with increase in monovalent
electrolyte concentration (from 10−4 M to 10−2 M). Additionally, the empirical expressions
between the zeta potential and electrolyte concentration are obtained in this work for both group 1
and group 2. The obtained expression for group 2 is in good agreement with those available in
literature. From the experimental data in combination with a theoretical model, the binding
constants for Na+ and K+ cations are obtained for the samples of group 2 and they are in the same
range reported in literature for silica-based samples.
<i><b>Keywords: Streaming potential, zeta potential, porous media, sands, electrolytes </b></i>
<b>1. Introduction</b>
The streaming potential is induced by the relative motion between the fluid and the solid surface.
In porous media such as rocks, sands or soils, the electric current density, linked to the ions within the
fluid, is coupled to the fluid flow. Streaming potential plays an important role in geophysical
applications. For example, the streaming potential is used to map subsurface flow and detect
subsurface flow patterns in oil reservoirs [e.g., 1]. Streaming potential is also used to monitor
_______
Tel.: 84-936946975.
</div>
<span class='text_page_counter'>(2)</span><div class='page_container' data-page=2>
subsurface flow in geothermal areas and volcanoes [e.g., 2, 3]. Monitoring of streaming potential
anomalies has been proposed as a means of predicting earthquakes [e.g., 4, 5] and detecting of seepage
through water retention structures such as dams, dikes, reservoir floors, and canals [6].
The zeta potential is one of the key parameters in streaming potential. The zeta potential of
liquid-rock systems depends on many parameters such as mineral composition of liquid-rocks, fluid properties,
temperature etc [7]. At a given porous media, the most influencing parameter is the fluid conductivity.
Therefore, it is useful to have an empirical relation between the zeta potential and fluid conductivity or
electrolyte concentration. For example, by fitting experimental data for quartz and NaCI or KCI at pH
= 7 and temperature of 25°C, Pride and Morgan [8] obtain an empirical relation between the zeta
potential and electrolyte concentration. Similarly, Vinogradov et al. [9] obtain another relation
between the zeta potential and electrolyte concentration based on published zeta potential data for
quartz, silica, glass beads, sandstone, Stainton and Fontainebleau in NaCl at pH = 6-8. However,
experimental data sets they used for fitting are from different sources with dissimilar fluid
conductivity, fluid pH, temperature, mineral composition of porous media. All those dissimilarities
may cause the empirical expressions less accurate. To critically seek empirical expressions to estimate
the zeta potential from electrolyte concentration, we have carried out zeta potential measurements for a
set of four sandpacks (denoted as S1, S2, S3 and S4) saturated by four monovalent electrolytes (NaCl,
NaI, KCl and KI) at six different electrolyte concentrations (10−4 M, 5.0×10⁻⁴ M, 10−3 M, 2.5×10⁻³ M,
5.0×10⁻³ M, and 10−2 M).
The measured values of the zeta potential are classified into two groups based on the magnitude:
group 1 (samples S1 and S2) and group 2 (samples S3 and S4). The magnitude of the zeta potential in
group 1 is much smaller than that in group 2 and in literature at the same electrolyte concentration.
The reason for a big variation of the zeta potential between samples may be due to the difference in
technique of making sand particles of different size leading to change of particle surface properties.
Consequently, the zeta potential that depends on the surface properties would vary. The results also
show that there is a decrease in the zeta potential with increase in monovalent electrolyte
concentration. Additionally, the empirical expressions between the zeta potential and electrolyte
concentration are obtained in this work for both group 1 and group 2. The obtained expression for
group 2 is in good agreement with those available in literature. From the experimental data in
combination with the theoretical model, the binding constants for Na+ and K+ cations are obtained for
the samples of group 2 and they are in the same range reported in literature for silica-based samples.
<b>2. Theoretical background of streaming potential </b>
<i>2.1. Physical chemistry of the electric double layer </i>
Streaming potential is the result of a coupling between fluid flow and electric current flow in a
porous medium which is formed by mineral solid grains such as silicates, oxides, carbonates. It is
directly related to the existence of an electric double layer (EDL) that exists at the solid-liquid
interface. Most substances acquire a surface electric charge when brought into contact with aqueous
systems. To understand the origin of surface charge, the physical chemistry at a silica surface in the
presence of the aqueous fluids is presented. The discussion of the reactions at a silica surface in
contact with aqueous fluids has been introduced [7, 10]. It is stated that there are two types of neutral
surface group for silica: doubly coordinated siloxal >Si2O
0
and singly coordinated silanol >SiOH0
(where > refer to the mineral lattice and the superscript “0” means no charge). The siloxal group
(>Si2O
0
</div>
<span class='text_page_counter'>(3)</span><div class='page_container' data-page=3>
produce positive surface sites (>SiOH2
+
) at very acid pH < pHpzc = 2-3 and negative surface sites
(>SiO−) at pH > pHpzc where pHpzc is the pH at the point of zero charge (at which concentration of
>SiOH2
+
is equal to that of >SiO−). The surface mineral reactions at the silanol surfaces in contact with
1:1 electrolyte solutions with the fluid pH limited to a range of 6-8 are:
To simplify the problem, silica grains in contact with 1:1 electrolyte solutions (i.e., monovalent
electrolytes with one cation and one anion) such as NaCl is considered with the fluid pH limited to a
range of 6-8. The surface mineral reactions at the silanol surface sites are:
for deprotonation of silanol groups
>SiOH0
>SiO− + H+, (1)for cation adsorption on silica surfaces
>SiOH0 + Me+
>SiOMe0 + H+, (2)where Me+ stands for monovalent cations in the solutions such as Na+ or K+. Note that the positive
surface site (>SiOH2
+
) does not exist at the silica-electrolyte interface for pH > 6. Therefore, three
types of sites are present at the silica surfaces, one negative (>SiO−) and two neutral ones (>SiOH0 and
>SiOMe0).
The law of mass action at equilibrium is used to calculate the equilibrium constants for those
reactions in the following manner
0
0
0
)
(
.
<i>SiOH</i>
<i>H</i>
<i>SiO</i>
<i>K</i>
, (3)
and
0
0
0
0
.
.
<i>Me</i>
<i>SiOH</i>
<i>H</i>
<i>SiOMe</i>
<i>Me</i>
<i>K</i>
, (4)
<i>where K</i>(−)<i> is the disassociation constant for deprotonation of silanol surface sites, KMe</i> is the
binding constant for cation adsorption on the silica surfaces,
<i><sub>i</sub></i>0 is the surface site density of surface<i>species i (sites/m</i>2) and
<i>i</i>0<i> is the activity of an ionic species i at the closest approach of the mineral </i>surface (no units).
The total surface site density (
<i>S</i>0) is0
0
0
0
<i>SiOMe</i>
<i>SiO</i>
<i>SiOH</i>
<i>S</i>
(5)Eq. (5) is a conservation equation for mineral surface groups. From Eq. (3), Eq. (4) and Eq. (5), the
surface site density of sites
<i><sub>SiO</sub></i>0 and
<i><sub>SiOMe</sub></i>0 are obtained. The mineral surface charge density0
<i>S</i>
<i>Q</i>
inC/m2 can be found by summing the surface densities of charged surface groups (only one charged
surface group of
0 <i>SiO</i> in this problem) as
0
0
.
<i><sub>SiO</sub></i><i>S</i>
<i>e</i>
<i>Q</i>
(6)<i>where e is the elementary charge. </i>
</div>
<span class='text_page_counter'>(4)</span><div class='page_container' data-page=4>
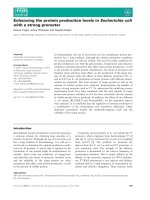
charge distribution known as the electric double layer (EDL) (see Fig. 1). The EDL is made up of the
Stern layer, where cations are adsorbed on the surface and are immobile due to the strong electrostatic
attraction, and the diffuse layer, where the ions are mobile. The distribution of ions and the electric
potential within the diffuse layer is governed by the Poisson-Boltzman (PB) equation which accounts
for the balance between electrostatic and thermal diffusional forces [11]. The solution to the linear PB
equation in one dimension perpendicular to a broad planar interface is well-known and produces an
electric potential profile that decays approximately exponentially with distance as shown in Fig. 1. In
the bulk liquid, the number of cations and anions is equal so that it is electrically neutral. The closest
plane to the solid surface in the diffuse layer at which flow occurs is termed the shear plane or the
slipping plane, and the electrical potential at this plane is called the zeta potential (ζ) as shown in Fig. 1.
Figure 1. Stern model for the charge and electric potential distribution in the EDL
at a solid-liquid interface [12, 13].
<i>2.2. Zeta potential </i>
According to a theoretical model for the zeta potential that has been well described by [7, 10], the
<i>electrical potential distribution φ in the EDL has, approximately, an exponential distribution as </i>
follows:
)
exp(
<i>d</i>
<i>d</i>
<sub></sub>
, (7)<i>where φd</i> is the Stern potential (V) given by
<sub></sub> <sub></sub>
<i>f</i>
<i>pK</i>
<i>pH</i>
<i>pH</i>
<i>f</i>
<i>S</i>
<i>f</i>
<i>Me</i>
<i>pH</i>
<i>b</i>
<i>r</i>
<i>o</i>
<i>b</i>
<i>d</i>
<i>C</i>
<i>C</i>
<i>K</i>
<i>e</i>
<i>C</i>
<i>K</i>
<i>TN</i>
<i>k</i>
<i>e</i>
<i>T</i>
<i>k</i> <sub>10</sub> <sub>10</sub> <i>w</i>
2
)
10
(
10
.
8
ln
3
2
)
(
0
3
(8)<i>and χd</i> is the Debye length (m) given by
<i>f</i>
<i>b</i>
<i>r</i>
<i>o</i>
<i>d</i>
<i>C</i>
<i>Ne</i>
<i>T</i>
<i>k</i>
2
2000
, (9)</div>
<span class='text_page_counter'>(5)</span><div class='page_container' data-page=5>
)
exp(
<i>d</i>
<i>d</i>
<sub></sub>
<sub></sub> <sub></sub> , (10)
where
<sub></sub> is the shear plane distance - the distance from the mineral surface to the shear plane(m). There is currently no method to evaluate the shear plane distance. In the work reported by [7], the
shear plane distance was taken as 2.4×10⁻¹⁰ m to compare the theoretical model with experimental
datasets of 17 different solid-fluid combinations. It was shown that the theoretical model fits the
experimental data well. Therefore, the shear plane distance (
<sub></sub> ) is taken as 2.4×10⁻¹⁰ m in this workfor modeling.
<i>In Eq. (8) and Eq. (9), kb</i> is the Boltzmann’s constant (1.38×10
-23
<i>J/K [14]), ε0</i> is the dielectric
permittivity in vacuum (8.854×10⁻¹² <i>F/m [14]), εr is the relative permittivity (no units), T is </i>
<i>temperature (in K), e is the elementary charge (1.602×10</i>-19 <i>C [14]), N is the Avogadro’s number </i>
(6.022 ×10²³ <i>/mol [14]), Cf is the electrolyte concentration (mol/L), pH is the fluid pH, K</i>Me is the
<i>binding constant for cation adsorption (no units), K</i>(−) is the disassociation constant for
dehydrogenization of silanol surface sites (no units),
<i><sub>S</sub></i>0 is the surface site density (sites/m2<i>) and Kw</i> isthe disassociation constant of water (no units).
<i>2.3. Streaming potential </i>
In a porous medium the electric current density and the fluid flux are coupled, so that the
streaming potential is generated by fluids moving through porous media. The parameter that quantifies
this coupling is the streaming potential coefficient (SPC) and is defined as
,
<i>eff</i>
<i>o</i>
<i>r</i>
<i>S</i>
<i>P</i>
<i>V</i>
<i>C</i>
(11)<i>where ∆V is the measured streaming potential (V), ∆P is the applied pressure difference (Pa), η is </i>
<i>the dynamic viscosity of the fluid (Pa.s), σeff is the effective conductivity (S/m), and ζ is the zeta </i>
potential (V). The effective conductivity includes the fluid conductivity and the surface conductivity.
The SPC can also be written as ([15] and reference therein)
,
<i>r</i>
<i>o</i>
<i>r</i>
<i>S</i>
<i>F</i>
<i>C</i>
(12)
<i>where σr</i> (S/m) is the electrical conductivity of the sample saturated by a fluid with a conductivity
<i>of σf (S/m) and F is the formation factor (no units). </i>
<b>3. Experiment </b>
</div>
<span class='text_page_counter'>(6)</span><div class='page_container' data-page=6>
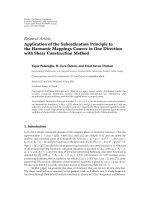
Figure 2. Experimental setup for streaming potential measurements.
The experimental setup and the way used to collect the SPC is similar to that described in [15] and
re-shown in Fig. 2. The values of the SPC for all samples at different electrolyte concentrations are
already reported in [15] and re-shown in Table 1 except for two samples S1 and S2 at electrolyte
concentration of 10-2 M. Because these samples are very permeable, they need a very large flow rate to
generate measurable electric potentials at high electrolyte concentration. It is found that the SPC is
negative for all samples and all electrolytes.
<i>The electrical conductivity of the samples saturated by electrolytes (σr</i>) is obtained from the
resistance measured by an impedance analyzer (Hioki IM3570) with the knowledge of the geometry of
the sample (the length, the diameter). In order to measure the resistance of saturated samples, two
silver meshes acting as two electrodes are used. The electrodes are placed on both sides against the
<i>sample. Based on the measured SPC, the measured electrical conductivity of the samples (σr</i>),
formation factors that are measured and re-shown in Table 1, the viscosity and dielectric constant of
<b>water, the zeta potential is deduced from equation 2. The zeta potential at different electrolyte </b>
concentrations is reported in Table 2. The maximum error of measured zeta potential is 12%. The
result shows that for a given sample the zeta potential in magnitude increase with decreasing electrolyte
concentration for all electrolytes. The observation is in good agreement literature [e.g., 7, 16].
Table 1. The streaming potential coefficient (mV/bar) for different electrolyte concentrations and the formation
<i>factor of the samples F already reported in [15] </i>
<i>Sample Size (μm) F </i> Electrolyte 10−4 M 5×10⁻⁴ M 10−3 M 2.5×10⁻³ M 5×10⁻³ M 10−2 M
S1
300-400
4.2
NaCl -1250 -202 -120 -41 -20
NaI -1275 -206 -125 -44 -22
KCl -1033 -183 -91 -30 -11
KI -1233 -200 -118 -38 -19
S2
200-300
4.0
NaCl -1950 -380 -179 -70 -32
NaI -2067 -403 -185 -87 -35
</div>
<span class='text_page_counter'>(7)</span><div class='page_container' data-page=7>
S3
90-150
4.2
NaCl -2100 -625 -357 -145 -63 -31
NaI -2466 -763 -400 -160 -77 -34
KCl -1567 -570 -313 -120 -65 -25
KI -1665 -573 -330 -123 -58 -26
S4
0-50 4.3
NaCl -4021 -842 -429 -149 -69 -33
NaI -4067 -850 -435 -151 -81 -36
KCl -2333 -576 -290 -106 -71 -29
KI -3933 -836 -430 -147 -75 -31
<b>4. Results and discussion </b>
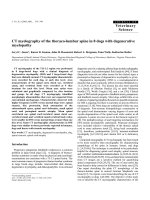
From Table 2, the dependence of the zeta potential on types of electrolyte is shown in Fig. 3 for a
representative sample (for example, sample S3). Fig. 3 shows that the magnitude of the zeta potential
decreases with increasing electrolyte concentration for all electrolytes as reported in literature [e.g., 7,
16]. This behavior is similar to other samples. As stated in [15], it is seen that that the zeta potential
mostly depend on types of cation in electrolytes. This can be qualitatively explained by the difference
in the binding constant of cations. For example, the binding constant of K+ is larger than Na+ [7].
Therefore, at the same ionic strength more cations of K+ are absorbed on the negative solid surface
than cations of Na+. This makes the electric potential on the shear plane (the zeta potential) smaller in
the electrolyte containing cations of K+ than that in the electrolyte containing cations of Na+.
<b>Table 2. Zeta potential for four monovalent electrolytes at different concentrations </b>
Sample Electrolyte 10−4 M 5×10⁻⁴ M 10−3 M 2.5×10⁻³ M 5×10⁻³ M 10−2 M
S1
NaCl -23 -19 -16 -16 -14
NaI -24 -20 -19 -18 -16
KCl -16 -15 -16 -13 -9
KI -19 -16 -17 -13 -12
S2
NaCl -22 -19 -18 -18 -14
NaI -23 -20 -19 -19 -16
KCl -17 -16 -16 -13 -10
KI -21 -17 -17 -13 -12
S3
NaCl -86 -80 -78 -73 -64 -47
NaI -96 -91 -86 -70 -66 -48
KCl -55 -57 -54 -50 -40 -24
KI -68 -63 -59 -52 -51 -33
S4
NaCl -77 -73 -70 -56 -52 -48
NaI -80 -78 -74 -59 -64 -55
KCl -56 -55 -52 -51 -48 -41
</div>
<span class='text_page_counter'>(8)</span><div class='page_container' data-page=8>
Figure 3. The variation of the zeta potential in magnitude with electrolyte concentration for different electrolytes
and for the sample S3.
Fig. 4 shows the variation of the zeta potential with samples for electrolyte NaI, for example. It is
seen that at a given electrolyte concentration, the samples can be classified into two groups based on
the magnitude of the zeta potential: group 1 (larger sand particle group) includes samples S1 and S2
and group 2 (smaller sand particle group) includes samples S3 and S4. This can be explained by the
difference in technique used to produce sand particles leading to the change of particle surface
properties.
Figure 4. The magnitude of the zeta potential as a function of electrolyte concentration for different samples
saturated by electrolyte NaI.
</div>
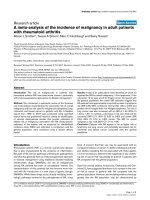
<span class='text_page_counter'>(9)</span><div class='page_container' data-page=9>
experimental data of the group 1 (the red solid line in Fig.5), the empirical relation between the zeta
potential and electrolyte concentration for the group 1 is obtained as
),
(
10
log
2
.
5
63
.
0 <i>Cf</i>
(13)and the empirical relation the group 2 (the black solid line in Fig. 5) is obtained as
),
(
10
log
12
27 <i>C<sub>f</sub></i>
(14)where
is in mV and<i>C</i>
<i>f</i> is the electrolyte concentration (in mole/lit).Expressions in Eq. (13) and Eq. (14) are similar to ones available in literature. For example, by
fitting experimental data for quartz and NaCI and KCI at pH = 7 and temperature of 25°C, Pride and
Morgan [8] obtain the empirical relation between the zeta potential and electrolyte concentration as
).
(
10
log
26
8 <i>C<sub>f</sub></i>
(15)Figure 5. Zeta potential in magnitude as a function of electrolyte concentration for group 1 (lower part) and
group 2 (upper part) and different electrolytes (NaCl, NaI, KCl and KI). Symbols are experimental data. The
solid lines are the fitting ones. The dashed lines are predicted from [8, 9].
Vinogradov et al. [9] obtain the another relation between the zeta potential and electrolyte
concentration based on published zeta potential data for quartz, silica, glass beads, sandstone, Stainton
and Fontainebleau in NaCl at pH = 6-8 as
).
(
10
log
02
.
19
67
.
9 <i>Cf</i>
(16)The prediction of zeta potential as a function of electrolyte concentration from the empirical
expressions of [8, 9] is also shown in Fig. 5 (see the upper dashed lines). It is seen that the empirical
expressions obtained [8, 9] can predict the variation of the measured zeta potential with electrolyte
concentration for group 1. The reason for the deviation between the empirical expressions may be
due to dissimilarities of fluid conductivity, fluid pH, mineral composition of porous media,
temperature etc.
</div>
<span class='text_page_counter'>(10)</span><div class='page_container' data-page=10>
shear plane distance,
<sub></sub> is taken as 2.4×10⁻¹⁰ m. The surface site density
<i><sub>S</sub></i>0 is taken as 5×10¹⁸site/m2<i>. The disassociation constant of water, Kw</i>, at 22
o
C is 9.22×10⁻¹⁵. The fluid pH is taken as 6.5.
The binding constant for cation adsorption on silica varies according to which are the dominant
<i>cations in the electrolyte and it is not well known. For example, K</i>Me(Na
+
) = 10−3.25<i> and K</i>Me(K
+
) =
10−2.8<i> given by [7]; K</i>Me(Li
+
) = 10−7.8<i> and K</i>Me(Na
+
) = 10−7.1<i> for silica given by [17]; K</i>Me(Li
+
) = 10−7.7,
<i>K</i>Me(Na
+
) = 10−7.5<i> and K</i>Me(Cs+) = 10−7.2 given by [18].
Figure 6. Zeta potential in magnitude as a function of electrolyte concentration for group 2 (samples S3 and
S4) for electrolytes containing Na+ cations (NaCl, NaI). Symbols are experimental data. The solid line is the
fitting one predicted from the theoretical model in [7].
Figure 7. Zeta potential in magnitude as a function of electrolyte concentration for group 2 (samples S3 and
S4) for electrolytes containing K+ cations (KCl, KI). Symbols are experimental data. The solid line is the
</div>
<span class='text_page_counter'>(11)</span><div class='page_container' data-page=11>
By fitting the experimental data of the measured zeta potential (see Fig. 6 for electrolytes
containing Na+ cations and Fig. 7 for electrolytes containing K+ cations), the binding constants for
<i>cations are obtained as K</i>Me(Na
+
) = 10−4.0<i>, K</i>Me(K
+
) = 10−3.5 for the samples of group 2 and they are in
the same range reported in literature for silica-based samples. It should be noted that we only use the
experimental data of group 2 for fitting because the measured zeta potential of group 1 is far from
<b>those available in literature as shown in Fig. 5. </b>
<b>5. Conclusions </b>
Measurements of the zeta potential in unconsolidated samples saturated with monovalent
electrolytes (NaCl, NaI, KCl and KI) at six different electrolyte concentrations have been reported.
The values we recorded are classified into two groups based on the magnitude: group 1 (samples S1
and S2) and group 2 (samples S3 and S4). The measured zeta potential in magnitude in group 1 is
much smaller than that in group 2 and in literature at the same electrolyte concentration (about three
times smaller). The reason for a big variation of the zeta potential between samples may be due to the
difference in technique of making sand particles of different size leading to change of particle surface
properties. Consequently, the zeta potential that depends on the surface properties would vary. The
results show that there is a gradual decrease in the zeta potential with increase in monovalent
electrolyte concentration (from 10−4 M to 10−2 M). For any sample, the zeta potential in magnitude is
larger in the electrolyte containing cations of Na+ than that in the electrolyte containing cations of K+.
This is qualitatively explained by the difference in the binding constant for cation adsorption on the
silica surfaces. Additionally, the empirical expressions between the zeta potential and electrolyte
concentration are obtained in this work for both group 1 and group 2. The obtained expression for
group 2 is quite suitable with those available in literature. From the experimental data in combination
with the theoretical model, the binding constants for Na+ and K+ cations are also obtained for the
samples of group 2 and they are in the range reported in literature for silica-based samples.
<b>Acknowledgments </b>
This research is funded by Vietnam National Foundation for Science and Technology
Development (NAFOSTED) under grant number 103.99-2016.29. Additionally, the author would like
to thank Dr. Rudolf Sprik for granting a three month visit at University of Amsterdam and for his
helpful comments and suggestions.
<b>References </b>
[1] B. Wurmstich, F. D. Morgan, Geophysics 59 (1994) 46–56.
[2] R. F. Corwin, D. B. Hoovert, Geophysics 44 (1979) 226–245.
[3] F. D. Morgan, E. R. Williams, T. R. Madden, Journal of Geophysical Research 94 (1989) 12.449–12.461.
[4] H. Mizutani, T. Ishido, T. Yokokura, S. Ohnishi, Geophys. Res. Lett. 3 (1976).
[5] M. Trique, P. Richon, F. Perrier, J. P. Avouac, J. C. Sabroux, Nature (1999) 137–141.
[6] A. A. Ogilvy, M. A. Ayed, V. A. Bogoslovsky, Geophysical Prospecting 17 (1969) 36–62.
[7] P. W. J. Glover, E. Walker, and M. D. Jackson, Geophysics 77 (2012) D17–D43.
</div>
<span class='text_page_counter'>(12)</span><div class='page_container' data-page=12>
[9] Vinogradov, J., M. Z. Jaafar, and M. D. Jackson, Journal of Geophysical Research Atmospheres 115 (2010)
B12204.
[10] O. Stern, Z. Elektrochem 30 (1924) 508–516.
[11] T. Ishido, H. Mizutani, Journal of Geophysical Research 86 (1981) 1763– 1775.
[12] H. M. Jacob, B. Subirm, Electrokinetic and Colloid Transport Phenomena, Wiley-Interscience, 2006.
[13] Revil A. and P. W. J. Glover, Physical Review B 55 (1997) 1757-1773.
[14] Lide, D.R., 2009, Handbook of chemistry and physics, 90th ed., CRC Press.
[15] Luong Duy Thanh, Rudolf Sprik, VNU Journal of Science: Mathematics – Physics, (2017) streaming potential
<b>coefficient in unconsolidated samples saturated with monovalent electrolytes (accepted). </b>
[16] B. J. Kirby, E. J. Hasselbrink, Electrophoresis 25 (2004) 187–202.
[17] Dove, P. M., and J. D. Rimstidt, Reviews in Mineralogy and Geochemistry 29 (1994) 259-308.
</div>
<!--links-->