Chỉ số giá năm 2001
Bạn đang xem bản rút gọn của tài liệu. Xem và tải ngay bản đầy đủ của tài liệu tại đây (28.13 KB, 3 trang )
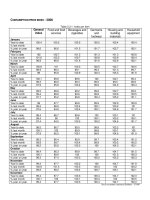
CONSUMPTION PRICE INDEX - 2001
Table 2.3.1: Index per item
General
index
Food and food
services
Beverages and
cigarettes
Garments
and
footwear
Housing and
building
materials
Household
equipment
January
Year to date 100.3 100.1 101.4 100.9 100.2 100.5
% last month
% year on year 99.4 97.5 101.2 100.8 104.4 102.3
February
Year to date 100.7 100.7 101.7 100.5 100.3 100.6
% last month 100.4 100.6 100.3 99.6 100.1 100.1
% year on year 98.2 95.9 100.8 99.6 103.5 102
March
Year to date 100 99.5 102 100.3 100.5 100.4
% last month 99.3 98.8 100.2 99.8 100.2 99.8
% year on year 98.6 96.3 101.9 100.1 102.4 102.1
April
Year to date 99.5 98.8 101.5 100.5 100.5 100.3
% last month 99.5 99.3 99.5 100.2 100 99.9
% year on year 98.8 96.7 102.1 100.8 102.9 103.1
May
Year to date 99.3 98.5 101.7 100.5 100.4 100.4
% last month 99.8 99.7 100.2 100 99.9 100.1
% year on year 99.2 97.5 102.7 101 102.2 102.7
June
Year to date 99.3 98.4 101.8 100.3 100.4 100.8
% last month 100 99.9 100.1 99.8 100 100.4
% year on year 99.7 98.5 102.4 100.7 102 102.1
July
Year to date 99.1 98.1 101 100.5 100.4 100.8
% last month 99.8 99.7 99.2 100.1 100 100
% year on year 100.5 99.7 100.7 101.2 103.1 101.3
August
Year to date 99.1 98.5 100.8 99.9 100 100.9
% last month 100 100.4 99.8 99.4 99.6 100.1
% year on year 100 99.6 101.7 100.5 101.5 102.2
September
Year to date 100.7 100.4 100.3 100.7 101.4 102.2
% last month 99,6 99.1 101.1 100.6 100.2 101
% year on year 100.5 100.6 101.5 101.2 100.2 100.1
October
Year to date 99.6 99 100.1 100.6 100.4 100.9
% last month 100 99.9 100 100 100.2 100
% year on year 100.4 100.4 101.4 101.2 100.4 101.7
November
Year to date 99.8 99.8 101.2 100.7 100.8 100.9
% last month 100.2 100.8 100.1 100.1 100.4 100
% year on year 99.7 99.7 101.2 101 100.8 101.5
December
Year to date 100.8 101.7 101.1 100.8 100.8 100.9
% last month 101 101.9 99.9 100.1 100 100
% year on year 100.8 101.7 101.1 100.8 100.8 100.9
Table 2.3.1: Index per item - continued
General
index
Pharmaceutic
al products
and medical
services
Means of
transport and
post services
Education Culture,
sports and
entertainment
Other goods
and
services
January
Year to date 100.3 99.8 100.1 100.7 100.3 100.5
% last month
% year on year 99.4 102.2 102.5 104.1 101 103.9
February
Year to date 100.7 99.5 100 100.6 100.5 100.7
% last month 100.4 99.7 99.9 99.9 100.2 100.2
% year on year 98.2 101.4 101.1 103.9 100.0 103.0
March
Year to date 100 99.6 99.7 100.4 100.5 100.7
% last month 99.3 100.1 99.7 99.9 100 99.9
% year on year 98.6 101.1 100.4 103.8 100.8 103.3
April
Year to date 99.5 99.8 99.3 100.5 100.2 100.2
% last month 99.5 100.2 99.6 100.1 99.7 99.5
% year on year 98.8 101.7 99.8 104 99.9 103.3
May
Year to date 99.3 100 99 100.6 100.3 100.4
% last month 99.8 100.2 99.7 100.1 100.1 100.2
% year on year 99.2 102.2 99.3 103.7 99.7 103.1
June
Year to date 99.3 100.2 98.8 101.5 100.3 100.2
% last month 100 100.2 99.8 100.9 100 99.8
% year on year 99.7 101.5 98.8 103.9 100.4 102.8
July
Year to date 99.1 98.4 99 102.5 100.1 100.6
% last month
(1)
99.8 98.3 100.2 101 99.8 100.3
% year on year
(2)
100.5 104 98.1 104.4 100.2 102.5
August
Year to date 99.1 98 98.9 102.4 99.7 100.6
% last month 100 99.6 99.9 99.9 99.6 100
% year on year 100 98.9 99.4 104 99.6 103.6
September
Year to date 99.6 99.1 99 103.3 100.4 101
% last month 100.5 100.6 100.1 100.8 100.7 100.4
% year on year 100.7 100.4 99.7 104.2 100.5 103.7
October
Year to date 99.6 99.6 98 103.2 100.1 100.9
% last month 100 100.9 99 99.9 99.7 99.9
% year on year 100.4 98.7 98.1 103.3 100.2 103.3
November
Year to date 99.8 99.6 95.6 103.4 100 101.2
% last month 100.2 100 97.6 100.2 99.9 100.3
% year on year 99.7 98.6 95.5 103.3 99.9 102.9
December
Year to date 100.8 99.8 95.3 103.6 100.2 101.4
% last month 101 100.2 99.7 100.2 100.2 100.2
% year on year 100.8 99.8 95.3 103.6 100.2 101.4
Socio-economic statistical bulletin - UNDP
Chart 2.3.1: Consumption price index per item
Socio-economic statistical bulletin – UNDP
Socio-economic statistical bulletin - UNDP
Consumption Price Index 2001
Dec 2000: base 100
96
97
98
99
100
101
102
103
Jan Feb Mar Apr May Jun Jul Aug Sept Oct Nov Dec
CPI Food and food services
Beverages and cigarettes Garments, footwear and headwear
Housing and building materials Household equipment
Consumption Price Index 2001 - Continued
Dec. 2000: base 100
90
92
94
96
98
100
102
104
106
Jan Feb Mar Apr May Jun Jul Aug Sept Oct Nov Dec
CPI Pharmaceutical products
Means of transport and post services Education
Culture, sports and entertainments Other goods and services