Báo cáo y học: "Different effect of exercise on left ventricular diastolic time and interventricular dyssynchrony in heart failure patients with and without left bundle branch block"
Bạn đang xem bản rút gọn của tài liệu. Xem và tải ngay bản đầy đủ của tài liệu tại đây (514.82 KB, 8 trang )
Int. J. Med. Sci. 2008, 5
333
International Journal of Medical Sciences
ISSN 1449-1907 www.medsci.org 2008 5(6):333-340
© Ivyspring International Publisher. All rights reserved
Research Paper
Different effect of exercise on left ventricular diastolic time and interven-
tricular dyssynchrony in heart failure patients with and without left bun-
dle branch block
Gunnar Plehn
, Julia Vormbrock, Thomas Butz, Martin Christ, Hans-Joachim Trappe and Axel
Meissner
Department of Cardiology and Angiology, Marienhospital Herne, University of Bochum, Germany
Correspondence to: Gunnar Plehn, MD, Department of Cardiology and Angiology, Marienhospital Herne, University of Bochum,
Hölkeskampring 40, 44625 Herne, Germany. Tel.: (0049)-2323-4995617; Fax: (0049)-2323-499301; Email: gunnar.plehn@ruhr-uni-
bochum.de
Received: 2008.10.01; Accepted: 2008.11.03; Published: 2008.11.04
Background: In patients with idiopathic dilated cardiomyopathy (IDCM) a prolongation of left ventricular (LV)
systole at the expense of diastolic time was demonstrated. Our study was aimed to evaluate the effect of exercise
on heart rate corrected diastolic time in controls, IDCM with and without LBBB, and patients with LBBB and
normal LV function.
Methods: 47 patients with IDCM, 30 without LBBB, and 17 with LBBB as well as 11 with isolated LBBB were
studied during exercise using a combined hemodynamic-radionuclide angiographic approach. The phases of the
cardiac cycle were derived with high temporal resolution from the ventricular time-activity curve. The loss of
diastolic time per beat (LDT) was quantified using a regression equation obtained from a control group (n=24).
Results: A significant LDT was demonstrated at rest and during peak exercise in IDCM patients with LBBB
(39.1±32 and 37.3±30 ms; p < 0.001). In IDCM patients with normal activation LDT was unaffected at baseline, but
elevated during peak exercise. This response was paralleled by an increase in interventricular mechanical
dyssynchrony.
Conclusion:
During exercise an abnormal shortening of LV diastolic time is a common characteristic of heart
failure patients which can be explained by the high prevalence of mechanical dyssynchrony.
Key words: diastolic time, heart failure, left bundle branch block, exercise test, interventricular dyssynchrony
Introduction
The introduction of cardiac resynchronization
therapy has recently renewed the clinical interest in the
analysis of specific phases of the cardiac cycle and their
temporal relationship (1). In heart failure patients two
major abnormalities of the gross time course of cardiac
contraction were demonstrated: a prolongation of total
isovolumic time (t-IVT) which represents the time
wasted within the cardiac cycle and a disproportionate
shortening of left ventricular (LV) diastolic time which
suggests an impaired temporal relation between LV
systole and diastole (2,3,4). Whether left bundle branch
block (LBBB) has a similar, consistent effect on the
systolic-diastolic phase proportion at rest and during
stress has not been thoroughly investigated. Therefore,
our study sought to separate the effects of LBBB and
ventricular disease on the relative duration of LV sys-
tole and diastole in heart failure patients during peak
incremental exercise.
Methods
Patients
All NYHA class III patients undergoing invasive
hemodynamic exercise testing for clinical reasons were
consecutively screened as potential candidates. Inclu-
sion criteria were: idiopathic dilated cardiomyopathy
(IDCM) diagnosed on the basis of the exclusion of
other causes of LV dysfunction, such as of evidence of
myocarditis in endomyocardial biopsy, significant
coronary artery stenoses revealed by angiography,
valvular heart disease except of functional mitral re-
gurgitation. Only patients with an echocardiographic
ejection fraction (EF) < 40% were included. Patients
with atrial fibrillation, QRS prolongation with
Int. J. Med. Sci. 2008, 5
334
non-LBBB pattern and disorders other than cardiac
disease that limit exercise performance were excluded.
According to QRS duration the selected patients
(n =47) were divided into two groups: 30 patients with
normal QRS duration (< 120 ms; IDCM-na) and 17 pa-
tients with prolonged QRS duration (≥ 120 ms) and
LBBB activation pattern (IDCM-LBBB).
Additional 11 patients with isolated LBBB were
retrospectively selected from a larger cohort of patients
evaluated in our hemodynamic laboratory. All of these
patients had a normal left ventricular cavity size and
baseline ejection fraction as evaluated by radionuclide
angiography. Coronary artery disease was excluded
by angiography. All of these patients had a limited
exercise tolerance classified as NYHA II.
The control group consisted of 24 patients re-
ferred for ventricular function assessment with ra-
dionuclide angiography before cardiotoxic cancer
treatment. None of these patients had a history of car-
diac disease, diabetes or hypertension.
All patients included in the overall study gave
their written informed consent prior to the examina-
tion.
Exercise hemodynamics
The patients performed supine bicycle exercise
beginning at a load of 25 watt with increases of 25 watt
every 5 min
until the development of fatigue or
limiting dyspnoea
. Rest and exercise hemodynamics
were measured with a pulmonary artery balloon flota-
tion right heart catheter. Resting measurements were
obtained twice, once 15 min before and again imme-
diately before the exercise. Peak and mean pulmonary
arterial pressure (MPA) as well as mean pulmonary
arterial wedge (PCWP) pressure were recorded. Right
atrial pressure was measured at baseline and immedi-
ately after cessation of exercise. The brachial arterial
systolic and diastolic pressures were measured by
sphygmomanometer. Forward cardiac output was
measured by the thermodilution technique both at rest
and during exercise immediately after the pressure
measurements. Between three and five thermodilution
cardiac output measurements were carried out at each
exercise stage for calculation of the mean value. Car-
diac index (CI), stroke volume index (SVI) and sys-
temic vascular resistance (SVR) were calculated ac-
cording to standard formulae. LV end-diastolic vol-
umes (EDVI) was calculated by dividing thermodilu-
tion stroke volume index by the respective ejection
fraction.
Echocardiography
Two-dimensional echocardiography was per-
formed in all patients using an ultrasonic device
equipped with a 2.5-MHz transducer. The left ven-
tricular diastolic and systolic dimensions were meas-
ured in the parasternal long-axis view according to the
standard recommendations (5). The left ventricular
ejection fraction was calculated according to the for-
mula established by Quinones et al. (6)
Radionuclide angiography
Simultaneously with hemodynamic measure-
ments, equilibrium radionuclide angiography was
performed using a high sensitivity, low-energy paral-
lel hole collimator interfaced to a computer system
(Sopha-DS7-gammacamera) as previously described
(7). Acquisition was carried out at LAO 20°-30° angu-
lation and 15° caudal tilting to achieve a precise sepa-
ration of the interventricular septum. Data were reg-
istered in a 64 x 64 matrix at 32 frames per cardiac cycle
at rest and during exercise and time-activity curves
were constructed. As usual, the R-wave of the electro-
cardiograph was used to identify the onset of each new
cardiac cycle. A dynamic filtration acquisition mode
was used, with rejection of cardiac cycles beyond ±10%
of the mean R-R interval. The data were further proc-
essed and analyzed by a semi-automated computer
routine (8). Right- and left-ventricular regions of in-
terest were traced simultaneously on diastolic images
and functional images obtained by Fourier amplitude
and phase analysis to provide a clear definition of the
septum and the atrio-ventricular junction. Left ven-
tricular ejection fraction (LVEF) was calculated as
(end-diastolic counts-end-systolic counts)/end-diasto-
lic counts.
Duration of left ventricular systole and diastole
(method of calculation)
The absolute duration of left ventricular systole
was defined as the time interval between the onset of
the R-wave and the minimal volume on the
time-activity curve (end-systole). The relative duration of
left ventricular systole was derived as the product of absolute
systolic time and heart rate and expressed in seconds per
minute. Diastolic time was calculated as the cardiac
length (RR interval) minus the duration of systole. To
define diastolic duration during exercise more pre-
cisely, diastolic time in IDCM patients was compared
with its predicted value obtained from putting each
heart rate of IDCM patients into a regression equation
obtained from the control group. The loss of diastolic
time per beat (LDT) was defined as the difference be-
tween and calculated and individually observed dia-
stolic time values.
Interventricular mechanical dyssynchrony (method
of calculation)
Phase image analysis was applied to the scinti-
graphic data using the above mentioned computer
Int. J. Med. Sci. 2008, 5
335
routine. The phase program assigns a phase angle to
each pixel of the phase image, derived from the first
Fourier harmonic of time. The phase angle corre-
sponds to the relative sequence and pattern of ven-
tricular contraction during the cardiac cycle. The mean
phase angles were computed for right ventricular (RV)
and LV blood pools as the arithmetic mean phase an-
gle for all pixels in the ventricular region of interest.
Interventricular mechanical dyssynchrony was evalu-
ated as the difference between LV and RV mean phase
angles (RV-LV-delay). Phase data were expressed in
degrees between 0° and 360°.
Statistical analysis
All data are given in terms of the mean ± SD.
Differences in group means were analyzed with the
two tailed unpaired t-test. For comparison of the indi-
vidually observed and predicted time values and for
comparison of within-group changes a repeated
measures analysis
of variance was used. If analysis of
variance showed an overall difference, pairwise com-
parison was performed with a paired t-test. Correla-
tion was performed by linear regression analysis.
Analyses were performed using the software package
“SPSS for Windows 12.0.1“.
Results
Systolic and diastolic time intervals
The clinical characteristics and time interval de-
tails of the patient groups and the control group are
presented in Table 1. Medical treatment was similar in
both patient groups with IDCM. In those with normal
activation, 27 of 30 were receiving a beta-blocking
agent, 30 an angiotensinconverting enzyme inhibitor
or angiotensin receptor blocker, and 19 a diuretic. In
patients with conduction disturbance, 13 of 17 patients
were receiving a beta-blocking agent, 15 an angio-
tensinconverting enzyme inhibitor or angiotensin re-
ceptor blocker, and 10 a diuretic. 8 of 11 patients with
isolated LBBB had beta-blocker therapy. All groups
had similar baseline heart rates. During peak exercise
heart rates were slightly lower in all three patient
groups. To better separate the effect of heart rate from
cardiac function time intervals diastolic time was
plotted against the corresponding heart rate of each
exercise stage and regression analysis was performed.
An inverse, nonlinear relation between heart rate and
LV diastolic time was found in either normal subjects
and both patient groups with IDCM. The equations
were: diastolic time = 101905xHR
-1.23
; r = 0.97, p < 0.001
for normal subjects, 187663xHR
-1.38
; r = 0.92 for
IDCM-na patients; p < 0.001 and 174925xHR
-1.38
; r =
0.90 for IDCM-LBBB patients; p < 0.001. The regression
equation obtained from the control group was used to
quantify the loss of diastolic time per beat in all three
patient groups. When predicted and observed values
of diastolic time were compared a significant LDT was
demonstrated at rest (20.1±29 ms; p = 0.003) and dur-
ing peak exercise (21.8±16 ms; p < 0.001) in patients
with isolated LBBB. In IDCM-LBBB patients the altera-
tion was even more pronounced (39.1±32 ms at rest
and 37.3±30 ms at peak exercise; p < 0.001). In
IDCM-na patients LDT was not significant at baseline
(5.4±31 ms; ns), however during exercise a significant
LDT was observed (28.1 ± 36 ms; p = 0.03). Within this
subgroup of patients a significant exercise-related in-
crease in LDT was demonstrated (5.4 ± 31 ms vs. 28.1 ±
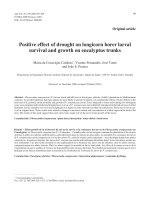
36 ms; p = 0.02) (Figure 1).
SVR at peak exercise did not correlate with LDT
at peak exercise, nor did its exercise related change
correlate with the corresponding change in SVR. Al-
though a significant left ventricular chamber dilatation
from rest to exercise was evident in IDCM-na and
IDCM-LBBB patients (188 ± 57 vs. 211 ± 92 ml/m
2
; p =
0.04 and 193 ± 39 vs. 225± 88 ml/m
2
; p = 0.02), no cor-
relations between the absolute values of EDVI at rest
or during exercise or the exercise-related increase in
EDVI and the corresponding LDT values were found
in both IDCM subgroups.
Figure 1 Loss of diastolic time per beat at rest and during peak
exercise in the different subgroups of patients. *p < 0.05 sig-
nificant LDT when observed and predicted time values were
compared.
#
p < 0.05 increase in LDT from rest to peak exercise
within a study group.
Int. J. Med. Sci. 2008, 5
336
Table 1.
Clinical characteristics, hemodynamic data and the time interval details of the entire patient group and the control group.
Controls
n = 24
IDCM-na
n = 30
IDCM-LBBB
n = 17
LBBB
n = 11
Age 49 ± 12 52 ± 15 54 ± 12 41 ± 16*
Male/ female ratio 20 : 4 24 : 6 14 : 3 9 : 2
Hypertension/ Diabetes melli-
tus (n)
0 : 0 7 : 2 3 : 2 3 : 0
Baseline LV end-diastolic di-
ameter (cm)
- ± - 7.0 ± 0.8 7.1 ± 1.0 5.3 ± 1.1
†
Duration of exercise (min) 19 ± 6 12 ± 4* 11 ± 5* 16 ± 6*
,†
Ejection fraction (%)
rest 60 ± 7 23 ± 7* 20 ± 7* 61 ± 10
†
peak exercise 71 ± 10 24 ± 8* 18 ± 10* 66 ± 11
†
Heart rate (beats/min)
rest 73 ± 14 73 ± 11 80 ± 9 67 ± 6
peak exercise 127 ± 23 114 ± 17* 122 ± 17 117 ± 17*
Systolic blood pressure (mmHg)
rest 120 ± 15 123 ± 16 122 ± 20 129 ± 24
peak exercise 168 ± 20 155 ± 24 159 ± 26 173 ± 26
Diastolic blood pressure
(mmHg)
rest 83 ± 13 81 ± 9 84 ± 12 88 ± 14
peak exercise 87 ± 8 85 ± 7 89 ± 10 93 ± 14
Duration of systole (ms)
rest 299 ± 45 308 ± 48 325 ± 45 337 ± 32*
,†
peak exercise 217 ± 42 258 ± 55* 254 ± 42* 245 ± 18*
Relative duration of systole
(s/min)
rest 21.5 ± 3.2 22.4 ± 3.6
#
25.9 ± 3.4* 22.6 ± 2.1
peak exercise 26.7 ± 3.2 29.4 ± 4.1 30.9 ± 3.4* 28.6 ± 2.9
Relative duration of diastole
(s/min)
rest 38.5 ± 3.2 37.6 ± 3.6
#
34.1 ± 3.4* 37.4 ± 2.1
peak exercise 33.3 ± 3.2 30.6 ± 4.1 29.1 ± 3.4* 31.4 ± 2.9
RV-LV delay (°)
rest -0.4 ± 6.8 1.5 ± 6.4
#
9.3 ± 7.3* 8.6 ± 6.7*
,†
peak exercise -1.3 ± 6.1 5.1 ± 7.7* 10.4 ± 7.5* 7.9 ± 9.5*
Loss of diastolic time per beat
(ms)
rest
5.4 ± 31
#
39.1 ± 32* 20.1 ± 29*
,†
peak exercise 28.1 ± 36* 37.3 ± 30* 21.8 ± 16*
Cardiac index (l/min/m
2
)
rest -
- 2.9 ± 0.9 2.9 ± 0.6 3.3 ± 0.5
peak exercise -
- 5.0 ± 1.1 4.8 ± 2.0 7.1 ± 1.4
†
Stroke volume index (ml/m
2
)
rest -
- 41.0 ± 15 38.0 ± 8 51.6 ± 9
†
peak exercise -
- 44.1 ± 11 40.5 ± 12 63.2 ± 12
†
End-diastolic volume index
(ml/m
2
)
rest -
- 188 ± 57 193 ± 39 85 ± 27
†
peak exercise -
- 211 ± 92 225 ± 88 97 ± 33
†
Systemic vascular resistance
(dyn*s*cm
-5
)
rest
1417 ± 311 1455 ± 281 1367 ± 310
peak exercise -
- 903 ± 212 951 ± 195 717 ± 223
†
Mean pulmonary artery pres-
sure (mmHg)
rest -
- 21.9 ± 9 18.8 ± 7 12.8 ± 2
†
peak exercise -
- 42.5 ± 11 38.1 ± 11 33.5 ± 9
†
IDCM-na = patients with idiopathic dilated cardiomyopathy and normal activation pattern; IDCM-LBBB = IDCM patients with left bundle
branch block; LBBB = patients with isolated left bundle branch block
* p < 0.05 compared with controls
#
p < 0.05 IDCM-na vs. IDCM-LBBB
†
p < 0.05 LBBB vs. IDCM-na
Int. J. Med. Sci. 2008, 5
337
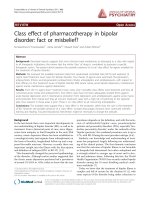
Interventricular mechanical dyssynchrony
At baseline a significant RV-LV delay was de-
monstrable in LBBB patients, but not in IDCM patients
with normal QRS duration. During peak exercise,
however, all three subgroup of patients showed a sig-
nificant RV-LV delay compared to control subjects
(Table 1, Figure 2). Within IDCM-na patients a signifi-
cant increase of RV-LV delay from rest to peak exercise
was observed (1.5 ± 6.4 vs. 5.1 ± 7.7°; p < 0.001).
In patients with LBBB no significant correlation
between the rest or exercise values of RV-LV delay and
the corresponding LDT was found. In addition, there
was no significant correlation between the exer-
cise-related change of RV-LV-delay and LDT within
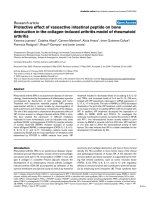
these subgroups. In IDCM-na, however, there was a
weak correlation between the exercise related change
of both parameters (r = 0.34; p = 0.04). Furthermore, a
moderate correlation between the exercise-related
change in RV-LV delay and LDT at peak exercise was
demonstrable (Figure 3).
Figure 2 Interventricular mechanical dyssynchrony (RV-LV delay) at rest and during peak exercise in the different subgroups of
patients. *p < 0.05 significant RV-LV delay compared to controls.
#
p < 0.05 significant increase in RV-LV delay from rest to peak
exercise within a study group.
Figure 3 Correlation between the loss of diastolic time at peak exercise in IDCM-na patients and the exercise-related increase in
interventricular mechanical dyssynchrony.