Modeling of methane multiple reforming in biogas fuelled SOFC and its application to operation analyses
Bạn đang xem bản rút gọn của tài liệu. Xem và tải ngay bản đầy đủ của tài liệu tại đây (8.21 MB, 174 trang )
Modeling of Methane Multiple Reforming
in Biogas-Fuelled SOFC
and Its Application to Operation Analyses
by
Tran Dang Long
Department of Hydrogen Energy Systems
Graduate School of Engineering
Kyushu University
SUBMITTED TO THE GRADUATE SCHOOL OF ENGINEERING IN
PARTIAL FULFILLMENT OF THE REQUIREMENTS FOR THE DEGREE
OF DOCTOR OF ENGINEERING
AT THE KYUSHU UNIVERSITY
JUNE 2017
Approved by:
Assoc.Prof. Yusuke Shiratori, advisor/examiner
Graduate School of Engineering, Kyushu University
Prof. Kazunari Sasaki, co-examiner
Graduate School of Engineering, Kyushu University
Prof. Kohei Ito, co-examiner
Graduate School of Engineering, Kyushu University
Prof. Takuya Kitaoka, co-examiner
Graduate School of Bioresource and Bioenvironmental Sciences, Kyushu
University
Fukuoka, Japan
ABSTRACT
This research focuses on solid oxide fuel cell (SOFC) operated at high temperature
(700–800 oC) with the direct feed of biogas, a gaseous mixture of 55–70 vol% CH4 and
30–45 vol% CO2 obtained from the anaerobic fermentation of organic matters such as
garbage, livestock manure and agricultural residues. When the biogas is supplied
directly to SOFC, CH4 dry and steam reforming simultaneously occur in a porous Nibased anode material to produce syngas (Methane multiple-reforming (MMR) process).
This type of operation is called direct internal reforming (DIR) operation. Biogasfuelled DIR-SOFC is a promising technology for sustainable development of a rural
area abundant in biomass resources.
For the realization of this technology, prior to system development, operating
behavior of it has to be fully understood. However, how to model the complex kinetics
of MMR process was a big challenge. In this study, from the reforming data obtained in
the series of systematic experiments using Ni-based anode-supported cells (ASCs), a
MMR model (model parameters) was inductively generated using the approach of
artificial neural network (ANN). The developed MMR model can provide the net
consumption and production rates of gaseous species (CH4, CO2, H2O, H2 and CO)
involved in the MMR process at arbitrary temperatures and gas compositions. And, it
can be applied for different types of Ni-based catalysts by adjusting a correction factor
to compensate the differences in catalytically-active surface area.
Computational fluid-dynamics (CFD) calculations, in which mass and heat
transports, MMR and electrochemical processes occurring inside the cell were taken
into consideration, were conducted for the DIR-SOFC fuelled by biogas. Consistency of
the CFD calculation incorporating the MMR model developed in this study (MMR
model-incorporated CFD) with the measured performance of SOFC fuelled by CH4-CO2
mixture was confirmed through a three-step model validation process consisting of two
model-parameter-tuning steps (model fitting steps with the data experimentally obtained
under non-DIR and DIR operations) followed by a validity check whether the
established-model can reproduce a performance of DIR-SOFC under an arbitrary
i
operating condition. The consistency was not achieved by the conventional approach in
literature considering MMR as a sum of CH4 dry and steam reforming (ignoring the
concurrent effect of CO2 and H2O on the catalytic CH4 conversion). The MMR model
developed in this study was proved to be able to provide more realistic and meaningful
estimations for the DIR-SOFCs.
In order to enhance thermomechanical stability and output power of DIR-SOFC
fuelled by biogas, internal reforming rates have to be properly controlled. For this
purpose, two advanced DIR concepts, with the anode gas-barrier mask (Concept-I) and
with the in-cell reformer using paper-structured catalyst (PSC) (Concept-II), were
investigated by the MMR model-incorporated CFD calculation. Two types of 20
50
mm2 ASC, ASC-A and ASC-B, with different thicknesses of anode substrate (Nistabilized zirconia) of 950 and 200
m, respectively, were considered, providing
guidelines for selecting a proper cell design depending on the thickness of the anode
substrate (in other words the amount of metallic Ni) to obtain a mechanically stable
operation with higher power density in the direct feed of simulated biogas mixture
(CH4/CO2 = 1) at 800 oC.
For both ASC-A and ASC-B, by adopting Concept-I which can control mass flux of
fuel getting into the porous volume of the anode along fuel flow direction, rapid syngas
production at the fuel inlet region was suppressed to have homogeneous temperature
distribution over the cell. In comparison to the normal ASCs (Normal), about 20%
decrease in the maximum thermally-induced stress was estimated with a slight loss
(about 8%) of maximum power density for both ASC-A and ASC-B, indicating that the
use of anode gas-barrier mask is effective to reduce the risk of electrolyte fracture.
Concept-I was confirmed to be a good choice for getting stable operation of DIRSOFCs.
For the feed of 200 mL min–1 simulated biogas, in the cases of Normal and ConceptI, maximum power densities (
) with thinner anode substrate (ASC-B) were 1.03
and 0.95 W cm–2, respectively, lower than those with thicker one (ASC-A), 1.17 and
1.08 W cm–2, respectively, reflecting that the degree of catalytic CH4 conversion is a
predominant factor of the performance. In fact, by the application of Concept-II,
of ASC-A and ASC-B were boosted up to 1.25 and 1.45 W cm–2, respectively, although
ii
the risk of electrolyte fracture was increased. The effect of Concept-II was more
pronounced for ASC-B with thinner anode substrate, from which H2O (product of the
anodic reaction) was easily drained. As a result, buildup of partial pressure of H2O
within the anode functional layer under high current densities, leading to the decrease in
electromotive force, could be suppressed.
This study provided a powerful numerical tool for creating highly efficient and
robust DIR-SOFCs operating with biogas.
This dissertation is mainly divided in six parts: overviews of SOFC and
conventional modeling approaches for DIR-SOFCs are summarized in General
Introduction. Investigation on electrochemical behavior of DIR-SOFC operating with
biogas is presented in Chapter 2. In Chapter 3, detailed description of the ANN/FISbased MMR model is given. CFD model of DIR-SOFC considering MMR and strategy
of model validation are described in Chapter 4. The effectiveness of advanced DIR
concepts is discussed in Chapter 5. Finally, important findings and outlook for future
work are summarized in Chapter 6.
iii
ACKNOWLEDGEMENTS
The study was conducted under the excellent supervision of Assoc. Prof. Yusuke
Shiratori whom I gratefully acknowledge for his enthusiasm and many hours of helpful
discussion throughout the progress of my thesis.
I wish to express my deep gratitude to Prof. Kazunari Sasaki for giving me the
opportunity to realize this thesis in his laboratory. In particular, I greatly appreciate his
valuable scientific comments and suggestions in my research. It is an honor for me that
he is one of examiners of my thesis.
I am also deeply grateful to Prof. Kohei Ito and Prof. Takuya Kitaoka for being
committee members of my thesis.
I would also like to thank Assoc. Prof. Hironori Nakajima and Assist. Prof. Yuya
Tachikawa for their helpful supports in using COMSOL Multiphysics software and
valuable discussions on SOFC calculations.
I wish to thank to Prof. Akari Hayashi and Assoc. Prof. Masamichi Nishihara for
their helpful comments and suggestions in my research.
I would like to express my appreciation to Dr. Tran Quang Tuyen for teaching me
fundamentals on SOFCs and skills on conducting experiments, as well as accompanying
me during my stay in Japan.
I especially thank Ms. Mio Sakamoto, Mr. Atsushi Kubota and Mr. Go Matsumoto,
who assisted me to collect experimental results; Ms. Nguyen Thi Giang Huong and Dr.
Pham Hung Cuong who encouraged me all the time; Ms. Tomomi Uchida, who
supported me in many things; and all other officemates and students for their support.
I also appreciate Saga Ceramic Research Laboratory (Japan) for their supporting the
anode-supported half-cells.
I gratefully acknowledge to Japan International Cooperation Agency (JICA) and
ASEAN University Network/Southeast Asia Engineering Education Development
Network (AUN/SEED-Net) for awarding me a scholarship to study in Kyushu
iv
University; and Japan Science and Technology Agency (JST) and Science and
Technology Research Partnership for Sustainable Development (SATREPS) program
for financial support on my research. I greatly appreciate Ms. Akiko Sakono in JICA
Kyushu International Center (JICA Kyushu) for helpful supports during my PhD period.
Finally, my highest appreciation is addressed to my family: my parents, my sisters
and brothers who believe in me and give me any supports without hesitation; my wife,
Thuy Ha, who always makes me proud and has never complained for my absence at
home; and my beloved children, Vinh Khang and Khanh An, who are my motivation in
all circumstances.
v
TABLE OF CONTENTS
Abstract ..................................................................................................................... i
Acknowledgments ..................................................................................................... iv
Table of contents ....................................................................................................... vi
List of figures ............................................................................................................ ix
List of tables .............................................................................................................. xvii
List of symbols .......................................................................................................... xviii
List of abbreviations ................................................................................................. xx
Chapter 1: General introduction ............................................................................. 1
1.1
Motivation .................................................................................................. 1
1.2
Solid Oxide Fuel Cells (SOFCs) ................................................................ 3
1.3
1.4
1.2.1
Overview ........................................................................................ 3
1.2.2
Working principle ........................................................................... 4
1.2.3
Components .................................................................................... 6
1.2.4
Direct internal reforming (DIR) operation ..................................... 10
Overview of modeling approaches for DIR-SOFCs................................... 13
1.3.1
Mass transport................................................................................. 16
1.3.2
Heat transport ................................................................................. 17
1.3.3
Chemical reactions ......................................................................... 18
1.3.4
Electrochemical reactions ............................................................... 19
1.3.5
Model validation ............................................................................. 20
Research objectives .................................................................................... 21
Chapter 2: Electrochemical behavior of DIR-SOFCs operating with biogas ..... 28
2.1
Electrochemical characteristics of Ni-based anodes with H2 and CO ........ 28
2.2
Experiment.................................................................................................. 29
2.3
2.2.1
Cell fabrication ............................................................................... 29
2.2.2
Experimental setup ......................................................................... 31
2.2.3
Experimental procedure .................................................................. 32
Results and discussion ................................................................................ 32
2.3.1
Internal reforming behavior under open-circuit condition ............. 32
vi
2.4
2.3.2
Electrochemical impedance for simulated biogas mixtures ........... 35
2.3.3
- characteristics ........................................................................... 37
Conclusions ................................................................................................ 39
Chapter 3: Modeling of methane multiple-reforming within the Ni-based anode of
an SOFC ................................................................................................. 41
3.1
Model description ....................................................................................... 41
3.2
Determination of model parameters ........................................................... 48
3.2.1
3.2.2
Experiments .................................................................................... 49
3.2.1.1
Experimental setup .......................................................... 49
3.2.1.2
Experimental procedure ................................................... 50
Data post-processing....................................................................... 50
3.3
Model validation ......................................................................................... 58
3.4
Conclusions ................................................................................................ 62
Chapter 4: Modeling and simulation of a DIR-SOFC operating with biogas ..... 64
4.1
4.2
4.3
A comprehensive CFD model for DIR-SOFCs considering methane
multiple-reforming (MMR) ........................................................................ 64
4.1.1
Cell description ............................................................................... 65
4.1.2
Sub-model of mass transport .......................................................... 66
4.1.3
Sub-model of chemical reactions ................................................... 67
4.1.4
Sub-model of electrochemical reactions......................................... 68
4.1.5
Sub-model of heat transport ........................................................... 70
Model validation ......................................................................................... 72
4.2.1
Strategy of model validation........................................................... 72
4.2.2
Experiments .................................................................................... 75
4.2.3
SOFC parameters ............................................................................ 77
4.2.4
Numerical methods ......................................................................... 79
Results and discussion ................................................................................ 82
4.3.1
Model validation ............................................................................. 82
4.3.2
Behavior of a DIR-SOFC fuelled by biogas ................................... 84
4.3.2.1
Distribution of gaseous species ....................................... 85
4.3.2.2
Heat balance .................................................................... 89
4.3.2.3
Distributions of temperature and thermal stress .............. 90
vii
4.4
Imperfection of conventional modeling approaches of MMR ................... 93
4.5
Conclusions ................................................................................................ 97
Chapter 5: Advanced DIR concepts for SOFCs operating with biogas ............... 100
5.1
Introduction ................................................................................................ 100
5.2
Results and discussion ................................................................................ 102
5.3
5.2.1
Case study for the thick anode substrate (ASC-A,
= 950 m) .. 102
5.2.2
Case study for the thin anode substrate (ASC-B,
= 200 m) .... 111
5.2.3
Effect of anode thickness ................................................................ 116
Conclusions ................................................................................................ 118
Chapter 6: Conclusions............................................................................................. 121
6.1
Conclusions ................................................................................................ 121
5.2
Outlook for future work .............................................................................. 124
Appendix A:
Effects of H2O and CO2 on the electrochemical oxidation of Nibased SOFC anodes with H2 and CO as a fuel ............................. 127
Appendix B:
Overview of Artificial Neural Network (ANN) ............................. 134
Appendix C:
Overview of Fuzzy Inference System (FIS) ................................... 140
viii
LIST OF FIGURES
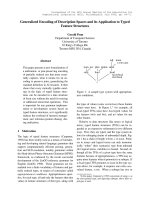
Fig. 1.1
Biogas-fuelled SOFC as a sustainable power generator.
2
Fig. 1.2
Operating mechanism of a SOFC with H2 as a fuel.
5
Fig. 1.3
Typical - characteristics of an SOFC.
6
Fig. 1.4
Schematic illustrations of (a) tubular and (b) planar SOFCs [28].
8
Fig. 1.5
Schematic illustrations of SOFC single cell configurations [14].
9
Fig. 1.6
Carbon formation boundary for humidified biogas mixtures
(CH4:CO2:H2O = 0.6:0.4: ( = 0–1.15)) calculated by HSC
Chemistry 9.0 (Outotec, Finland), showing the effect of the degree
of humidification on coking prevention within the operating
temperature range of SOFCs.
11
Fig. 1.7
Calculated electromotive force under open-circuit condition in
DIR-SOFC operating with humidified biogas mixtures
(CH4:CO2:H2O = 0.6:0.4:
(
= 0–1.15)) without carbon
deposition, showing the effect of the degree of humidification on
power generation.
12
Fig. 1.8
Physical and chemical phenomena in the DIR-SOFC operating with
CH4-based fuels.
14
Fig. 2.1
Button-type ESC prepared in this study to investigate the
electrochemical behaviour of DIR-SOFC operating with the direct
feed of simulated biogas mixtures; (a) illustration of cell
configuration and (b) photograph of the cell unit. WE – working
electrode (anode); CE – counter electrode (cathode); and RE –
reference electrode.
30
Fig. 2.2
Electrochemical measurement setup for DIR-SOFC fuelled by a
simulated biogas mixture; (a) schematic drawing and (b)
photograph.
31
Fig. 2.3
Internal reforming behavior of ESC with Ni-10ScSZ anode (total
anode thickness of about 38 m, surface area of 8 8 mm2) with
80 mL min–1 of simulated biogas mixtures (CH4:CO2:N2 =
20:
:(60 –
)) measured at 800 oC; (a) total CH4 conversion,
(b) net production rates of H2, CO and H2O and (c) H2/CO molar
ratio of reformate gas with respect to CO2 inlet flow rate (
).
33
ix
Fig. 2.4
Thermodynamically-calculated partial pressure of oxygen in anode
side (
) with respect to CO2 inlet flow rate (
) at 800 oC for
80 mL min–1 of simulated biogas mixtures (CH4:CO2:N2 =
20:
:(60 –
)).
34
Fig. 2.5
Anode-side impedance spectra at 800 oC for the ESC with Ni10ScSZ measured under open-circuit condition with 80 mL min–1
of different CH4-CO2-N2 mixtures. Spectra for dry and humidified
H2 were also plotted for the comparison. Number in the box
indicates the value of power.
35
Fig. 2.6
Polarization resistances of Ni-10ScSZ anode at 800 oC obtained in
the EIS under open-circuit condition with 80 mL min–1 of simulated
biogas mixtures (CH4:CO2:N2 = 20:
:(60 –
)); (a) masstransfer resistance (
, (b) charge-transfer resistance (
and
(c) polarization resistance (
=
+
) with respect to
CO2 inlet flow rate,
.
36
Fig. 2.7
- curves of ESC with Ni-10ScSZ anode measured at 800 oC with
80 mL min–1 of simulated biogas mixtures (CH4:CO2:N2 =
20:
:(60 –
)). - curves for dry and humidified H2 were
also plotted for the comparison.
38
Fig. 2.9
Activation overvoltage (
) of Ni-10ScSZ measured at 800 oC
with 80 mL min–1 of simulated biogas mixtures (CH4:CO2:N2 =
20:
:(60 –
)).
for dry and humidified H2 were also
plotted for the comparison.
38
Fig. 3.1
Calculation flow to obtain the net consumption rate of CH4 (
)
at arbitrary temperatures and gas compositions (CH4-CO2-H2O-H2CO) in MMR.
43
Fig. 3.2
Schematic illustration of
45
(
) for generating
and
at an arbitrary gas composition: (a) a schematic of the network,
( function.
and (b) illustration of
Fig. 3.3
Schematic illustration of the interpolating process to determine the
net consumption rate of CH4 (
) from the set of [
]
and the net production rate of H2 ( ) from the [
an arbitrary temperature ( ) between and by FIS.
Fig. 3.4
] set at
CH4 reforming tests using a Ni-8YSZ anode-supported half-cell (20
mm in diameter): (a) a picture of the catalyst material (anode side),
(b) schematic drawing of the experimental setup, and (c) the
experimental matrix showing six testing programs indicated by
x
48
49
green arrows. CH4 reforming tests were performed for the
compositions, as indicated by the blue (basic molar ratio) and red
dots.
Fig. 3.5
Net reaction rates of MMR within the porous Ni-YSZ anode
material at 700 C for a fuel flow rate of 100 mL min–1 (fuel is the
CH4-CO2-H2O-N2 mixture). (a): The profile of
as a function of
obtained in Step-I. (b–g): Profiles of
as a function of
or
obtained in Step-II. ■ and ▲ are measured
and
, respectively. □ and △ are
and
estimated from the
experimental trends by extrapolation using a power law. Solid lines
are the net reaction rates predicted by the black-box model using
; for (a) a power function was applied.
53
Fig. 3.6
The rate ratio surfaces of (a) CH4 and (b) H2 generated by
,
characterizing the concurrent effects of CO2 and H2O in the MMR
within the porous Ni-YSZ anode material at 700 C.
54
Fig. 3.7
Net reaction rates of MMR within the porous Ni-YSZ anode
material at 750 C for a fuel flow rate of 100 mL min–1 (fuel is the
CH4-CO2-H2O-N2 mixture). (a): The profile of
as a function of
obtained in Step-I. (b–g): Profiles of
as a function of
or
obtained in Step-II. ■ and ▲ are measured
and
, respectively. □ and △ are
and
estimated from the
experimental trends by extrapolation using a power law. Solid lines
are the net reaction rates predicted by the black-box model using
; for (a) a power function was applied.
56
Fig. 3.8
Net reaction rates of MMR within the porous Ni-YSZ anode
material at 800 C for a fuel flow rate of 100 mL min–1 (fuel is the
CH4-CO2-H2O-N2 mixture). (a): The profile of
as a function of
obtained in Step-I. (b–g): Profiles of
as a function of
or
obtained in Step-II. ■ and ▲ are measured
and
, respectively. □ and △ are
and
estimated from the
experimental trends by extrapolation using a power law. Solid lines
are the net reaction rates predicted by the black-box model using
; for (a) a power function was applied.
57
Fig. 3.9
The rate ratio surfaces of (a) CH4 and (b) H2 generated by
,
characterizing the concurrent effects of CO2 and H2O in the MMR
within the porous Ni-YSZ anode material at 750 C.
58
Fig. 3.10
The rate ratio surfaces of (a) CH4 and (b) H2 generated by
,
characterizing the concurrent effects of CO2 and H2O in the MMR
58
xi
within the porous Ni-YSZ anode material at 800 C.
Fig. 3.11
PSC-based planar-type reactor simulating SOFC configuration
(visualization system of reforming reaction using infrared camera)
[15]: (a) structure of paper-structured catalyst (PSC), (b) schematic
illustration and (c) photograph of the test bench.
59
Fig. 3.12
3D-CFD model of the planar-type PSC reformer.
60
Fig. 3.13
Temperature profile in the planar-type PSC reformer during CH4
dry reforming at GHSV of 2880 h–1. Blue line is the measured
profile [13]. Red line is the calculated one using the MMR-modelincorporated CFD.
indicates the total CH4 conversion rate.
61
Fig. 4.1
3D-CFD model of an anode-supported SOFC considered in this
study.
65
Fig. 4.2
Calculation flow to obtain net consumption and production rates of
gaseous species ( = CH4, CO2, H2O, H2 and CO) involved in
chemical reactions occurring within SOFC anode.
68
Fig. 4.3
Three-step strategy of model validation for the comprehensive CFD
model of DIR-SOFC applied in this study.
74
Fig. 4.4
ASC fabricated in this study; (a) schematic illustration and (b)
photograph.
76
Fig. 4.5
Test bench for the electrochemical measurement of DIR-SOFC
fuelled by simulated biogas.
77
Fig. 4.6
Illustrations of (a) geometry and (b) calculating mesh for the MMR
model-incorporated CFD calculation used in the model validation.
80
Fig. 4.7
- curves of the 14 14 mm2 reference ASC under the operating
conditions listed in Table 4.8. (a) 100 mL min–1 flow of H2 (3 vol%
H2O) (Case-I (red)), 80 mL min–1 flow of CH4/CO2 = 1 (Case-II
(blue)), and (b) 40 mL min–1 flow of CH4/CO2 = 1 (Case-III).
Scatter and line plots show the measured and calculated results,
respectively.
83
Fig. 4.8
Test bench of the electrochemical measurement for the 20 50
mm2 DIR-SOFC fuelled by simulated biogas. The prepared ASC
was placed on the alumina housing to, and then, the outer perimeter
of the cell was sealed with ceramic bond.
83
Fig. 4.9
- curves of the 20 50 mm2 reference ASC at 800 oC with
100 mL min–1 flow of H2 (3 vol% H2O) (red) and 40 mL min–1 flow
of CH4/CO2 = 1 (blue). Scatter and line plots show the measured
84
xii
and calculated results, respectively.
Fig. 4.10
Cross sectional distributions of (a,b) CH4, (c,d) CO2, (e,f) H2O,
(g,h) H2, (i,j) CO concentrations along the center-line of the fuel
flow for the 14 14 mm2 reference ASC of Case-III (40 mL min–1
of CH4/CO2 = 1); (a,c,e,g,i) under open-circuit condition and
(b,d,f,h,j) at 2 A cm–2. and indicate the minimum and
maximum values of mole fraction, respectively.
86
Fig. 4.11
Calculated distribution of fuel composition along fuel flow
direction in the 14 14 mm2 reference ASC for Case-III. (a) and
(b) are the mole fraction profiles of gaseous species under opencircuit condition and at 2 A cm–2, respectively.
88
Fig. 4.12
Heat source as a function of current density for the 14 14 mm2
reference ASC for Case-III: (a) chemical and electrical heat sources
(
and
, respectively) and (b) total heat source (
=
+
). Negative value of heat source indicates
endothermicity.
indicates CH4 conversion.
90
Fig. 4.13
Calculated spatial variation of temperature within the anode side of
the 14 14 mm2 reference ASC of Case-III (40 mL min–1 of
CH4/CO2 = 1) (a) under open-circuit condition and (b) at 2 A cm–2,
showing temperature distributions in the electrolyte surface and in
the direction vertical to the electrolyte surface along fuel flow
direction. and indicate the minimum and maximum values of
temperature, respectively.
91
Fig. 4.14
Calculated distributions of thermally-induced stress (first principal
stress ( )) generated in the electrolyte plane of the 14 14 mm2
reference ASC of Case-III (40 mL min–1 of CH4/CO2 = 1) (a) under
open-circuit condition and (b) at 2 A cm–2. and indicate the
minimum and maximum values of , respectively.
91
Fig. 4.15
Calculated temperature profiles of the electrolyte and the ACCL
along fuel flow direction of the 14 14 mm2 reference ASC of
Case-III (40 mL min–1 of CH4/CO2 = 1) (a) under open-circuit
condition and (b) at 2 A cm–2. Rectangle indicates the position
where the maximum thermally-induced stress (first principal stress
(
)) occurs.
92
Fig 4.16
Distribution of fuel composition in fuel channel along fuel flow
direction under open-circuit condition in the 20
50 mm2
reference ASC operating at 800 oC with 40 mL min–1 simulated
biogas (CH4/CO2 = 1) calculated with (a) the ANN/FIS-based
MMR model (this study) and (b) the parallel-reforming approach
[20].
95
xiii
Fig. 4.17
Comparison of calculated and measured - curves for the 20 50
mm2 reference ASC operating at 800 oC with 40 mL min–1
simulated biogas (CH4/CO2 = 1); Green: Calculated - curve with
the ANN/FIS-based MMR model, Red: Calculated - curve with
the parallel-reforming approach [20]. Scatter plots: Measured curve.
95
Fig. 4.18
Distribution of fuel composition in AFL along fuel flow direction at
0.5 A cm–2 in the 20 50 mm2 reference ASC operating at 800 oC
with 40 mL min–1 simulated biogas (CH4/CO2 = 1) calculated with
(a) the ANN/FIS-based MMR model (this study) and (b) the
parallel-reforming approach [20].
96
Fig. 5.1
Schematic illustrations and photographs of DIR-concepts studied in
this study.
101
Fig. 5.2
Calculated net consumption rate of CH4 (
) for the cases of (a)
Normal, (b) Concept-I and (c) Concept-II with ASC-A under opencircuit condition at 800 oC with the feed of 200 mL min–1 simulated
biogas (CH4/CO2 = 1 mixture). and in (a)–(c) indicate the
minimum and maximum values of
, respectively.
103
Fig. 5.3
Profiles of CH4 and H2 mole fractions in fuel channel along fuel
flow direction for the cases of Normal, Concept-I and -II calculated
for ASC-A under open-circuit condition at 800 oC with the feed of
200 mL min–1 simulated biogas (CH4/CO2 = 1 mixture).
104
Fig. 5.4
Calculated temperature distribution for the cases of (a) Normal, (b)
Concept-I and (c) Concept-II with ASC-A, and (d) the profiles of
electrolyte temperature along fuel flow direction under open-circuit
condition at 800 oC with the feed of 200 mL min–1 simulated biogas
(CH4/CO2 = 1 mixture). and in (a)–(c) indicate the minimum
and maximum temperatures, respectively. Rectangles in (d)
indicate the positions where the maximum thermally-induced stress
(first principal stress (
) occurs.
105
Fig. 5.5
Calculated - characteristics for the cases of Normal, Concept-I
and -II with ASC-A at 800 oC with the feed of 200 mL min–1
simulated biogas (CH4/CO2 = 1 mixture).
106
Fig. 5.6
Calculated CH4 conversion (
) of internal dry reforming (Fuel:
CH4/CO2 = 1 mixture) for the cases of Normal, Concept-I and -II
with ASC-A at 800 oC under open-circuit condition in the
range of 40–200 mL min–1. Dash line indicates
calculated at
equilibrium condition.
107
Fig. 5.7
Profiles of H2 mole fractions in fuel channel along fuel flow
direction for the cases of (a) Normal, (b) Concept-I and (c)
Concept-II calculated for ASC-A at 800 oC under open-circuit
108
xiv
condition in the
range of 40–200 mL min–1.
Fig. 5.8
Calculated profiles of electrolyte temperature along fuel flow
direction for the cases of (a) Normal, (b) Concept-I and (c)
Concept-II with ASC-A under open-circuit condition at 800 oC in
the
range of 40–200 mL min–1.
109
Fig. 5.9
Calculated maximum thermally-induced stress (
) for the
cases of Normal, Concept-I and -II with ASC-A under open-circuit
condition at 800 oC in the
range of 40–200 mL min–1.
110
Fig. 5.10
Maximum power density,
, ((a)) for the cases of Normal,
Concept-I and -II calculated for ASC-A under open-circuit
condition at 800 oC in the
range of 40–200 mL min–1. (b) is
the fuel utilization at
(
).
111
Fig. 5.11
Profiles of (a) CH4 and H2 mole fractions and (b) electrolyte
temperature along fuel flow direction under open-circuit condition
at 800 oC with the feed of 200 mL min–1 simulated biogas
(CH4/CO2 = 1 mixture) calculated for ASC-B. Rectangles in (b)
indicate the positions where the maximum thermally-induced stress
(first principal stress (
)) occurs.
112
Fig. 5.12
Calculated - characteristics of ASC-B at 800 oC with the feed of
200 mL min–1 simulated biogas (CH4/CO2 = 1 mixture).
112
Fig. 5.13
Calculated CH4 conversion (
) of internal dry reforming (Fuel:
CH4/CO2 = 1 mixture) for the cases of Normal, Concept-I and -II
with ASC-B at 800 oC under open-circuit condition in the
range of 40–200 mL min–1. Dash line indicates
calculated at
equilibrium condition.
113
Fig. 5.14
Profiles of H2 mole fractions in fuel channel along fuel flow
direction for the cases of (a) Normal, (b) Concept-I and (c)
Concept-II calculated for ASC-B at 800 oC under open-circuit
condition in the
range of 40–200 mL min–1.
114
Fig. 5.15
Calculated profiles of electrolyte temperature along fuel flow
direction for the cases of (a) Normal, (b) Concept-I and (c)
Concept-II with ASC-B under open-circuit condition at 800 oC in
the
range of 40–200 mL min–1.
115
Fig. 5.16
Calculated maximum thermally-induced stress (
) for the
cases of Normal, Concept-I and -II with ASC-B under open-circuit
condition at 800 oC in the
range of 40–200 mL min–1.
116
Fig. 5.17
Maximum power density,
, ((a)) for the cases of Normal,
Concept-I and -II calculated for ASC-B under open-circuit
condition at 800 oC in the
range of 40–200 mL min–1. (b) is
the fuel utilization at
(
).
116
xv
Fig. 5.18
Calculated maximum power densities (
) at 800 oC with the
–1
feed of 200 mL min simulated biogas (CH4/CO2 = 1 mixture),
showing the effects of Concept-I and Concept-II for different
thicknesses of anode substrate.
117
Fig. 5.19
Calculated profiles of Nernst voltage (electromotive force) and
within the AFL along fuel flow direction at the total
polarization (
) of 0.6 V for the Concept-II with ASC-A and
o
ASC-B at 800 C with the feed of 200 mL min–1 simulated biogas
(CH4/CO2 = 1 mixture).
is the average output current density.
118
xvi
LIST OF TABLES
Table 1.1
Typical composition of practical biogas [3].
1
Table 1.2
SOFC components [27].
7
Table 1.3
Comparison of tubular and planar SOFC [14].
8
Table 1.4
Features of single cell configurations [14].
9
Table 1.5
Possible overall reactions in the DIR-SOFC operating with CH4based fuels.
14
Table 3.1
Parameters determined by power-law fitting and ANN training to
describe MMR.
51
Table 3.2
Physical properties of the PSC.
60
Table 3.3
Operating condition.
61
Table 4.1
The numerical sub-models for a biogas-fuelled SOFC considered in
this study.
72
Table 4.2
Materials and thicknesses of the ASC components used in this
study.
76
Table 4.3
Dimensions of the cell components.
78
Table 4.4
Physical properties of the cell components.
78
Table 4.5
Numbers of mesh elements in computational domains for a 14
mm2 planar ASC.
Table 4.6
Operating conditions.
81
Table 4.7
Kinetic model used in the Meng Ni’s parallel-reforming approach
[20].
94
xvii
14
80
LIST OF SYMBOLS
active specific surface area / m–1
specific heat capacity / J kg–1 K–1
binary diffusion / m2 s–1
Nernst voltage / V
Faraday constant / C mol–1
heat transfer coefficient / J m2 s–1 K–1
current density / A m–2
exchange current density / A m–2
gaseous species flux / mol m–2 s–1
thermal conductivity / W m–1 K–1
partial pressure / Pa
gas constant / J mol–1 K–1
reaction rate ratio
heat flux vector
universal gas constant / J mol–1 K–1
net reaction rate, net production or consumption rate / mol m–3 s–1
temperature / K
velocity / m s–1
mole fraction / -
xviii
Greek letters
charge transfer coefficient / porosity / emissivity / permeability / m2
viscosity / kg m–1 s–1
density / kg m–3
conductivity / S m–1, thermally-induced stress / MPa
tortuosity / mass fraction / -
Subscripts
anode
cathode
electrolyte
,
gaseous species index
xix
LIST OF ABBREVIATIONS
AFC
Alkaline Fuel Cell
AFL
Anode Functional Layer
ACCL
Anode Current Collector Layer
ANN
Artificial Neural Network
ASC
Anode-Supported Cell
CCCL
Cathode Current Collector Layer
CFL
Cathode Functional Layer
CG
Coal Gasification
CP
Methane (CH4) pyrolysis
FIS
Fuzzy Inference System
-
Current-Voltage
MCFC
Molten Carbonate Fuel Cell
MMR
Methane (CH4) Multiple Reforming
OCV
Open-Circuit Voltage
PAFC
Phosphoric Acid Fuel Cell
PEMFC
Proton Membrane Exchange Fuel Cell
RB
Reverse-Boudouard
SOFC
Solid Oxide Fuel Cell
WGS
Water-Gas Shift
xx
CHAPTER 1
General introduction
Chapter 1 – General introduction
1.1
Motivation
Biogas is a gaseous mixture obtained from the anaerobic fermentation process of
organic matters from garbage, livestock manure, agricultural wastes, etc. It mainly contains
CH4 and CO2 and traces of H2S, N2, H2O as shown in Table 1.1. The calorific value of CH4
component is the useful part of biogas. For years, biogas has widely been used as one of
renewable energy sources for heating through gas burners and electricity generation
through gas engine systems [1]. Due to multiple-step energy conversion mechanism
(chemical thermal mechanical electrical energy), energy conversion efficiency of
heat engine-based generators is limited to about 25–30% [2].
Table 1.1: Typical composition of practical biogas [3].
Concentration
55–70 vol%
30–45 vol%
500–4000 ppm
100–800 ppm
< 1 vol%
< 1 vol%
< 1 vol%
< 1 vol%
CH4
CO2
H2S
NH3
H2
N2
O2
H2O
Solid oxide fuel cell (SOFC) is a high temperature energy conversion device generating
electricity via the electrochemical reaction between a fuel (H2, CO, hydrocarbons, etc.) and
oxygen. Due to single-step energy conversion mechanism (chemical electrical energy),
hydrocarbons-fuelled SOFCs are two times more efficient than conventional heat engines
[4]. Compared to hydrocarbons-fuelled power systems adopting proton membrane
exchange fuel cells (PEMFCs), alkaline fuel cells (AFCs), phosphoric acid fuel cells
(PAFCs), and molten carbonate fuel cell (MCFC), SOFC-based systems are superior due to
the elimination of external reformer, high quality waste heat, and high overall system
1
Chapter 1 – General introduction
efficiency. Therefore, biogas-fuelled SOFC power systems are attractive technology for
sustainable development (see Fig. 1.1).
Fig. 1.1: Biogas-fuelled SOFC system as a sustainable power generator.
The feasibility of SOFCs operating with the direct feed of biogas has been intensively
studied by many research groups [5–10]. In pursuit of realizing biogas-fuelled SOFC power
systems, several technical issues related to stable operation must be overcome such as the
risk of mechanical failures of cell components, and the degradation of cell performance
caused by carbon deposition and H2S poisoning. Numerical simulation is invaluable
approach to obtain insightful estimation during operation, evaluate effectiveness of various
cell/stack designs, and evaluate influences of operation parameters on SOFC performance.
The estimated results can be applied for optimizing cell/stack designs and operating
conditions, as a result, significantly lowering efforts, time and cost for developing SOFCbased power systems. This study aims to develop a comprehensive computational fluiddynamics (CFD) model for an SOFC single unit running with biogas. This model includes
2
Chapter 1 – General introduction
mass and heat transports, chemical reactions (the simultaneous CH4 conversions with CO2
and H2O) and electrochemical oxidations occurring simultaneously inside the cell.
1.2
Solid Oxide Fuel Cells (SOFCs)
1.2.1 Overview
The principle of fuel cell operation was first reported by Sir W. Grove in 1839 [11]. In
1897, W. Nernst found that a solid electrolyte in thin rod-shape could become electrically
conductive at high temperature [12], opening SOFC technology. The first operation of
SOFC was achieved at 1000 oC by E. Baur and H. Preis in 1937 using a ceramic material
composed of 85% zirconia and 15% yttria [13]. Since 1937, SOFC technology has rapidly
matured. At the present, the most common electrolyte materials used are yttria-stabilized
zirconia (YSZ) and scandia-stabilized zirconia (ScSZ) [14].
Large scale SOFC systems have been being developed aiming for distributed power
plants with high energy conversion efficiency. A 140 kW SOFC cogeneration system was
built by Siemens Wetinghouse in 1998, showing excellent performance [15]. Mitsubishi
Heavy Industries (Japan) has developed a 200 kW-level micro-gas turbine hybrid system
with a maximum efficiency of 52.1% LHV, and a rated ouput of 229 kW in AC was
achieved with natural gas as a fuel [16]. Rolls-Royce Fuel Cell Systems (England) has built
a stationary 1 MW SOFC power generation system based on their segmented-in-series cell
stack named Integrated-Planar SOFC technology [17, 18]. FuelCell Energy (The United
States) has developed SOFC power plants using SOFC stacks fabricated by Versa Power
Systems (Canada) [19]. In 2015, Mitsubishi Hitachi Joint Venture started to operate a
SOFC-Micro Gas Turbine (MGT) hybrid system installed at Kyushu University as a
demonstrated unit [20]. The system was designed to produce a rate output of 250 kW at
55% LHV from city gas, and to operate safely and properly at an outdoor location.
Small scale SOFCs of 1–2 kW class have also been being developed all over the world
for residential combined-heat-and-power (CHP) systems. City gas is generally used as a
3