GPS - đường dẫn quán tính và hội nhập P3
Bạn đang xem bản rút gọn của tài liệu. Xem và tải ngay bản đầy đủ của tài liệu tại đây (580.51 KB, 50 trang )
3
Signal Characteristics and
Information Extraction
Why is the GPS signal so complex? GPS was designed to be readily accessible to
millions of military and civilian users. Therefore, it is a receive-only passive system
for a user, and the number of users that can simultaneously use the system is
unlimited. Because there are many functions that must be performed, the GPS signal
has a rather complex structure. As a consequence, there is a correspondingly
complex sequence of operations that a GPS receiver must carry out in order to
extract desired information from the signal. In this chapter we characterize the signal
mathematically, describe the purposes and properties of the important signal
components, and discuss generic methods for extracting information from these
components.
3.1 MATHEMATICAL SIGNAL WAVEFORM MODELS
Each GPS satellite simultaneously transmits on two L-band frequencies denoted by
L
1
and L
2
, which are 1575.42 and 1227.60 MHz, respectively. The carrier of the L
1
signal consists of an in-phase and a quadrature-phase component. The in-phase
component is biphase modulated by a 50-bps data stream and a pseudorandom code
called the C=A-code consisting of a 1023-chip sequence that has a period of 1 ms
and a chipping rate of 1.023 MHz. The quadrature-phase component is also biphase
modulated by the same 50-bps data stream but with a different pseudorandom code
30
Global Positioning Systems, Inertial Navigation, and Integration,
Mohinder S. Grewal, Lawrence R. Weill, Angus P. Andrews
Copyright # 2001 John Wiley & Sons, Inc.
Print ISBN 0-471-35032-X Electronic ISBN 0-471-20071-9
called the P-code, which has a 10.23-MHz chipping rate and a one-week period. The
mathematical model of the L
1
waveform is
st
2P
I
p
dtct cosot y
2P
Q
q
dtpt sinot y; 3:1
where P
I
and P
Q
are the respective carrier powers for the in-phase and quadrature-
phase carrier components, dt is the 50-bps data modulation, ct and pt are the
respective C=A and P pseudorandom code waveforms, o is the L
1
carrier frequency
in radians per second, and y is a common phase shift in radians. The quadrature
carrier power P
Q
is approximately 3 dB less than P
I
.
In contrast to the L
1
signal, the L
2
signal is modulated with only the 50-bps data
and the P-code, although there is the option of not transmitting the 50-bps data
stream. The mathematical model of the L
2
waveform is
st
2P
Q
q
dtpt sinot y: 3:2
Figures 3.1 and 3.2 respectively show the structure of the in-phase and quadrature-
phase components of the L
1
signal. The 50-bps data bit boundaries always occur at
1
bit (20 ms)
1ms
1 chip (0.9775 µs)
d(t)
50
bps
data
2P
I
cos(ω t)
L
1
Carrier
c(t)
C/A code
Multiply Multiply
Transmitted
signal
Data
50 bps
1bit=20ms
C/A-code epochs
20 code periods
per bit
Oneperiod(1ms)
of C/A code
1023 chips/ period
L
1
Carrier
1575.42 MHz
1540 cycles/chip
1
0 2 3 4 5 6 7 17 18 19 20
Fig. 3.1 Structure of in-phase component of the L
1
signal.
3.1 MATHEMATICAL SIGNAL WAVEFORM MODELS
31
an epoch of the C=A-code. The C=A-code epochs mark the beginning of each period
of the C=A-code, and there are precisely 20 code epochs per data bit, or 20,460
C=A-code chips. Within each C=A-code chip there are precisely 1540 L
1
carrier
cycles. In the quadrature-phase component of the L
1
signal there are precisely
204,600 P-code chips within each 50-bps data bit, and the data bit boundaries always
coincide with the beginning of a P-code chip [42, 56].
3.2 GPS SIGNAL COMPONENTS, PURPOSES, AND PROPERTIES
3.2.1 50-bps Data Stream
The 50-bps data stream conveys the navigation message, which includes, but is not
limited to, the following information:
1. Satellite Almanac Data. Each satellite transmits orbital data called the
almanac, which enables the user to calculate the approximate location of
every satellite in the GPS constellation at any given time. Almanac data is not
accurate enough for determining position but can be stored in a receiver where
it remains valid for many months. It is primarily used to determine which
satellites are visible at a given location so that the receiver can search for those
satellites when it is ®rst turned on. It can also be used to determine the
1 bit (20 ms)
1 chip (0.09775 µs)
d(t)
50
bps
data
2P
Q
sin(ωt)
L
1
Carrier
ρ(t)
P(Y )-code
Multiply Multiply
Transmitted
signal
Data
50 bps
1bit=20ms
204,600 chips (20 ms)
of P(Y )-code
Period = 1 week
(≅ 6.19 × 10
12
chips)
L
1
carrier
1575.42 MHz
154 cycles/chip
Fig. 3.2 Structure of quadrature-phase component of the L
1
signal.
32
SIGNAL CHARACTERISTICS AND INFORMATION EXTRACTION
approximate expected signal Doppler shift to aid in rapid acquisition of the
satellite signals.
2. Satellite Ephemeris Data. Ephemeris data is similar to almanac data but
enables a much more accurate determination of satellite position needed to
convert signal propagation delay into an estimate of user position. In contrast
to almanac data, ephemeris data for a particular satellite is only broadcast by
that satellite, and the data is valid for only several hours.
3. Signal Timing Data. The 50-bps data stream includes time tagging, which is
used to establish the transmission time of speci®c points on the GPS signal.
This information is needed to determine the satellite-to-user propagation delay
used for ranging.
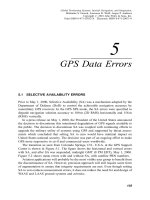
4. Ionospheric Delay Data. Ranging errors due to ionospheric effects can be
partially canceled by using estimates of ionospheric delay that are broadcast in
the data stream.
5. Satellite Health Message. The data stream also contains information regarding
the current health of the satellite, so that the receiver can ignore that satellite if
it is not operating properly.
Structure of the Navigation Message The information in the navigation
message has the basic frame structure shown in Fig. 3.3. A complete message
consists of 25 frames, each containing 1500 bits. Each frame is subdivided into ®ve
300-bit subframes, and each subframe consists of 10 words of 30 bits each, with the
most signi®cant bit (MSB) of the word transmitted ®rst. Thus, at the 50-bps rate it
takes 6 s to transmit a subframe and 30 s to complete one frame. Transmission of the
complete 25-frame navigation message requires 750 s, or 12.5 min. Except for
occasional updating, subframes 1, 2, and 3 are constant (i.e., repeat) with each
frame at the 30-s frame repetition rate. On the other hand, subframes 4 and 5 are
each subcommutated 25 times. The 25 versions of subframes 4 and 5 are referred to
as pages 1±25. Hence, except for occasional updating, each of these pages repeats
every 750 s, or 12.5 min.
A detailed description of all information contained in the navigation message is
beyond the scope of this text. Therefore, we only give an overview of the
fundamental elements. Each subframe begins with a telemetry word (TLM). The
®rst 8 bits of the TLM is a preamble that makes it possible for the receiver to
determine when a subframe begins. The remainder of the TLM contains parity bits
and a telemetry message that is available only to authorized users and is not a
fundamental item. The second word of each subframe is called the hand-over word
(HOW).
Z-Count Information contained in the HOW is derived from a 29-bit quantity
called the Z-count. The Z-count is not transmitted as a single word, but part of it is
transmitted within the HOW. The Z-count counts epochs generated by the X
1
register
of the P-code generator in the satellite, which occur every 1.5 s. The 19 LSBs of the
Z-count, called the time-of-week (TOW) count, indicate the number of X
1
epochs
3.2 GPS SIGNAL COMPONENTS, PURPOSES, AND PROPERTIES
33
that have occurred since the start of the current week. The start of the current week
occurs at the X
1
epoch, which occurs at approximately midnight of Saturday
night=Sunday morning. The TOW count increases from zero at the start of the
week to 403,199 and then rolls over to zero again at the start of the following week.
A TOW count of zero always occurs at the beginning of subframe 1 of the ®rst frame
(the frame containing page 1 of subcommutated subframes 4 and 5). A truncated
version of the TOW count, containing its 17 MSBs, comprises the ®rst 17 bits of the
HOW. Multiplication of this truncated count by 4 gives the TOW count at the start of
the following subframe. Since the receiver can use the TLM preamble to determine
precisely the time at which each subframe begins, a method for determining the time
of transmission of any part of the GPS signal is thereby established. The relationship
between the HOW counts and TOW counts is shown in Fig. 3.4.
GPS Week Number The 10 MSBs of the Z-count contain the GPS week number
(WN), which is a modulo-1024 week count. The zero state is de®ned to be that week
that started with the X
1
epoch occurring at approximately midnight on the night of
January 5, 1980=morning of January 6, 1980. Because WN is a modulo-1024 count,
an event called the week rollover occurs every 1024 weeks (a few months short of 20
years), and GPS receivers must be designed to accommodate it.
1
The WN is not part
of the HOW but instead appears as the ®rst 10 bits of the third word in subframe 1.
Fig. 3.3 Navigation message frame structure.
1
The most recent rollover occurred at GPS time zero on August 22, 1999, with little dif®culty.
34
SIGNAL CHARACTERISTICS AND INFORMATION EXTRACTION
Frame and Subframe Identi®cation Three bits of the HOW are used to identify
which of the ®ve subframes is being transmitted. The frame being transmitted
(corresponding to a page number from 1 to 25) can readily be identi®ed from the
TOW count computed from the HOW of subframe 5. This TOW count is the TOW at
the start of the next frame. Since there are 20 TOW counts per frame, the frame
number of that frame is simply (TOW=20) (mod 25).
Information by Subframe In addition to the TLM and HOW, which occur in
every subframe, the following information is contained within the remaining eight
words of subframes 1±5 (only fundamental information is described):
1. Subframe 1. The WN portion of the Z-count is part of word 3 in this subframe.
Subframe 1 also contains GPS clock correction data for the satellite in the
form of polynomial coef®cients de®ning how the correction varies with time.
Time de®ned by the clocks in the satellite is commonly called SV time (space
vehicle time); the time after corrections have been applied is called GPS time.
Thus, even though individual satellites may not have perfectly synchronized
SV times, they do share a common GPS time. Additional information in
subframe 1 includes the quantities t
0c
, T
GD
, and IODC. The clock reference
time t
0c
is used as a time origin to calculate satellite clock error, the
ionospheric group delay T
GD
is used to correct for ionospheric propagation
delay errors, and IODC (issue of date, clock) indicates the issue number of the
clock data set to alert users to changes in clock parameters.
2. Subframes 2 and 3. These subframes contain the ephemeris data, which is
used to determine the precise satellite position and velocity required by the
Fig. 3.4 Relationship between HOWcounts and TOWcounts.
3.2 GPS SIGNAL COMPONENTS, PURPOSES, AND PROPERTIES
35
navigation solution. Unlike the almanac data, this data is very precise, is valid
over a relatively short period of time (several hours), and applies only to the
satellite transmitting it. The components of the ephemeris data are listed in
Table 3.1, and the algorithm that should be used to compute satellite position
in WGS 84 coordinates is given in Table 3.2. The satellite position computa-
tion using these data is implemented in the Matlab m-®le ephemeris.m on the
accompanying diskette. The IODE (issue of date, ephemeris) informs users
when changes in ephemeris parameters have occurred. Each time new
parameters are uploaded from the GPS control segment, the IODE number
changes.
3. Subframe 4. The 25 pages of this subframe contain the almanac for satellites
with PRN (pseudorandom code) numbers 25 and higher, as well as special
messages, ionospheric correction terms, and coef®cients to convert GPS time
to UTC time. There are also spare words for possible future applications. The
components of an almanac are very similar to those of the ephemeris, and the
calculation of satellite position is performed in essentially the same way.
Table 3.1 Components of Ephemeris Data
Name Description Units
a
M
0
Mean anomaly at reference time semicircle
Dn Mean motion difference from computed value semicircle=s
e Eccentricity dimensionless
a
p
Square root of semimajor axis m
1=2
O
0
Longitude of ascending node of orbit plane at
weekly epoch
semicircle
i
0
Inclination angle at reference time semicircle
o Argument of perigee semicircle
_
O Rate of right ascension semicircle=s
IDOT Rate of inclination angle semicircle=s
C
uc
Amplitude of cosine harmonic correction term to the rad
argument of latitude
C
us
Amplitude of sine harmonic correction term to the rad
argument of latitude
C
rc
Amplitude of cosine harmonic correction term to the m
orbit radius
C
rs
Amplitude of sine harmonic correction term to the m
orbit radius
C
ic
Amplitude of cosine harmonic correction term to the rad
angle of inclination
C
is
Amplitude of sine harmonic correction term to the rad
angle of inclination
t
0e
Ephemeris reference time s
IODE Issue of data, ephemeris dimensionless
a
Units used in MATLAB m-®le ephemeris are different.
36
SIGNAL CHARACTERISTICS AND INFORMATION EXTRACTION
4. Subframe 5. The 25 pages of this subframe includes the almanac for satellites
with PRN numbers from 1 to 24.
It should be noted that since each satellite transmits all 25 pages, almanac data for all
satellites is transmitted by every satellite. Unlike ephemeris data, almanac data is
valid for long periods (months) but is much less precise. Additional data contained
in the navigation message is user range error (URE), which estimates the range error
due to errors in satellite ephemeris, timing errors, and selective availability (SA) and
¯ags to indicate the health status of the satellites.
Table 3.2 Algorithm for Computing Satellite Position
m 3:986005 Â 10
14
m
3
=s
2
WGS 84 value of earth's
universal gravitational parameter
_
O
e
7:292115167Â 10
À5
rad=s WGS 84 value of earth's rotation rate
a
a
p
2
Semimajor axis
n
0
m=a
3
p
Computed mean motion, rad=s
t
k
t À t
0e
a
Time from ephemeris reference epoch
n n
0
D
n
Corrected mean motion
M
k
M
0
nt
k
Mean anomaly
M
k
E
k
À e sin E
k
Kepler's equation for eccentric anomaly
f
k
cos
À1
cos E
k
À 1
1 À e cos E
k
True anomaly from cosine
f
k
sin
À1
1 À e
2
p
sin E
k
1 À e cos E
k
!
True anomaly from sine
E
k
cos
À1
e cos f
k
1 e cos f
k
Eccentric anomaly from cosine
f
k
f
k
o Argument of latitude
dm
k
C
mc
cos 2f
k
C
ms
sin 2f
k
Second-harmonic correction to argument of latitude
dr
k
C
rc
cos 2f
k
C
rs
sin 2f
k
Second-harmonic correction to radius
di
k
C
ic
cos 2f
k
C
is
sin 2f
k
Second-harmonic correction to inclination
m
k
f
k
dm
k
Corrected argument of latitude
r
k
a1 À e cos E
k
dr
k
Corrected radius
i
k
i
0
di
k
IDOTt
k
Corrected inclination
x
H
k
r
k
cos m
k
X coordinate in orbit plane
y
H
k
r
k
sin m
k
Y coordinate in orbit plane
O
k
O
0
_
O À
_
O
0
t
k
À
_
O
e
t
0e
Corrected longitude of ascending node
x
k
x
H
k
cos O
k
À y
H
k
cos i
k
sin O
k
ECEF X coordinate
y
k
x
H
k
sin O
k
y
H
k
cos i
k
cos O
k
ECEF Y coordinate
z
k
y
H
k
sin i
k
ECEF Z coordinate
a
t is in GPS system time at time of transmission, i.e., GPS time corrected for transit time (range=speed of
light). Furthermore, t
k
shall be the actual total time difference between the time t and the time epoch t
0e
and
must account for beginning or end of week crossovers. That is, if t
k
is greater than 302,400 s, subtract
604,800 s from t
k
.Ift
k
is less than À302; 400 s, add 604,800 s to t
k
.
3.2 GPS SIGNAL COMPONENTS, PURPOSES, AND PROPERTIES
37
3.2.2 C=A-Code and Its Properties
The C=A-code has the following functions:
1. To enable accurate range measurements and resistance to errors caused by
multipath. To establish the position of a user to within 10±100 m, accurate
user-to-satellite range estimates are needed. The estimates are made from
measurements of signal propagation delay from the satellite to the user. To
achieve the required accuracy in measuring signal delay, the GPS carrier must
be modulated by a waveform having a relatively large bandwidth. The needed
bandwidth is provided by the C=A-code modulation, which also permits the
receiver to use correlation processing to effectively combat measurement
errors due to thermal noise. Because the C=A-code causes the bandwidth of
the signal to be much greater than that needed to convey the 50-bps data
stream, the resulting signal is called a spread-spectrum signal.
Using the C=A-code to increase the signal bandwidth also reduces errors in
measuring signal delay caused by multipath (the arrival of the signal via
multiple paths such as re¯ections from objects near the receiver antenna) since
the ability to separate the direct path signal from the re¯ected signal improves
as the signal bandwidth is made larger.
2. To permit simultaneous range measurement from several satellites. The use of
a distinct C=A-code for each satellite permits all satellites to use the same L
1
and L
2
frequencies without interfering with each other. This is possible
because the signal from an individual satellite can be isolated by correlating
it with a replica of its C=A-code in the receiver. This causes the C=A-code
modulation from that satellite to be removed so that the signal contains only
the 50-bps data and is therefore narrow band. This process is called
despreading of the signal. However, the correlation process does not cause
the signals from other satellites to become narrow band, because the codes
from different satellites are orthogonal. Therefore the interfering signals can
be rejected by passing the desired despread signal through a narrow-band
®lter, a bandwith-sharing process called code division multiplexing (CDM) or
code division multiple access (CDMA).
3. To provide protection from jamming. The C=A-code also provides a measure
of protection from intentional or unintentional jamming of the received signal
by another man-made signal. The correlation process that despreads the
desired signal has the property of spreading any other signal. Therefore, the
signal power of any interfering signal, even if it is narrow band, will be spread
over a large frequency band, and only that portion of the power lying in the
narrow-band ®lter will compete with the desired signal. The C=A-code
provides about 20±30 dB of improvement in resistance to jamming from
narrowband signals.
We next detail important properties of the C=A-code.
38
SIGNAL CHARACTERISTICS AND INFORMATION EXTRACTION
Temporal Structure Each satellite has a unique C=A-code, but all of the codes
consist of a repeating sequence of 1023 chips occurring at a rate of 1.023 MHz with
a period of 1 ms, as previously shown in Fig. 3.1. The leading edge of a speci®c chip
in the sequence, called the C=A-code epoch, de®nes the beginning of a new period.
Each chip is either positive or negative with the same magnitude. The polarities of
the 1023 chips appear to be randomly distributed but are in fact generated by a
deterministic algorithm implemented by shift registers. The algorithm produces
maximal-length Gold codes, which have the property of low cross-correlation
between different codes (orthogonality) as well as reasonably small autocorrelation
sidelobes.
Autocorrelation Function The autocovariance
2
function of the C=A-code is
ct
1
T
T
0
ctct À t dt; 3:3
where ct is the idealized C=A-code waveform (with chip values of Æ1), t is the
relative delay measured in seconds, and T is the code period (1 ms). The auto-
correlation function is periodic in t with a period of 1 ms. A single period is plotted
in Fig. 3.5, which is basically a triangle two chips wide at its base with a peak
located at t 0 [in reality ct contains small-sidelobe structures outside the
triangular region, but these are of little consequence].
The C=A-code autocorrelation function plays a substantial role in GPS receivers,
inasmuch as it forms the basis for code tracking and accurate user-to-satellite range
Fig. 3.5 Autocorrelation functions of C=A- and P(Y)-codes.
2
Strictly speaking, the autocorrelation function ctct=c0 is the autocovariance function rescaled
by the signal variance [c0], but the terms autocorrelation and autocovariance are often interchanged in
engineering usage.
3.2 GPS SIGNAL COMPONENTS, PURPOSES, AND PROPERTIES
39
measurement. In fact, the receiver continually computes values of this function in
which ct in the above integral is the signal code waveform and ct À t is an
identical reference waveform (except for the relative delay t) generated in the
receiver. Special hardware and software enable the receiver to adjust the reference
waveform delay so that the value of t is zero, thus enabling determination of the time
of arrival of the received signal.
Power Spectrum The power spectrum C f of the C=A-code describes how the
power in the code is distributed in the frequency domain. It can be de®ned either in
terms of a Fourier series expansion of the code waveform or equivalently in terms of
the code autocorrelation function. Using the latter, we have
C f lim
T3I
1
2T
T
ÀT
cte
Àj2pf t
dt: 3:4
A plot of C f is shown as a smooth curve in Fig. 3.6; however, in reality C f
consists of spectral lines with 1-kHz spacing due to the 1-ms periodic structure of
ct. The power spectrum C f has a characteristic sin
2
x=x
2
shape with ®rst nulls
located 1.023 MHz from the central peak. Approximately 90% of the signal power is
located between these two nulls, but the smaller portion lying outside the nulls is
very important for accurate ranging. Also shown in the ®gure for comparative
purposes is a typical noise power spectral density found in a GPS receiver after
–– ––
Fig. 3.6 Power spectra of C=A- and P(Y)-codes.
40
SIGNAL CHARACTERISTICS AND INFORMATION EXTRACTION
frequency conversion of the signal to baseband (i.e., with carrier removed). It can be
seen that the presence of the C=A-code causes the entire signal to lie well below the
noise level, because the signal power has been spread over a wide frequency range
(approximately Æ1 MHz).
Despreading of the Signal Spectrum The mathematical model of the signal
modulated by the C=A-code is
st
2P
I
p
dtct cosot y3:5
where P
I
is the carrier power, dt is the 50-bps data modulation, ct is the C=A-
code waveform, o is the L
1
carrier frequency in radians per second, and y is the
carrier phase shift in radians. When this signal is frequency shifted to baseband and
tracked with a phase-lock loop, the carrier is removed and only the data modulation
and the C=A-code modulation remain. The resulting signal, which in normalized
form is
stdtct; 3:6
has a power spectrum similar to that of the C=A-code in Fig. 3.6. As previously
mentioned, the signal in this form has a power spectrum lying below the receiver
noise level, making it inacessible. However, if the signal is multiplied by a replica of
ct in exact alignment with it, the result is
stctdtctctdtc
2
tdt; 3:7
where the last equality arises from the fact that the values of the ideal C=A-code
waveform are Æ1 (in reality the received C=A-code waveform is not ideal due to
bandlimiting in the receiver; however, the effects are usually minor). This procedure,
called code despreading, removes the C=A-code modulation from the signal. The
resulting signal has a two-sided spectral width of approximately 100 Hz due to the
50-bps data modulation. From the above equation it can be seen that the total signal
power has not been changed in this process, but it now is contained in a much
narrower bandwith. Thus the magnitude of the power spectrum is greatly increased,
as indicated in Fig. 3.7. In fact, it now exceeds that of the noise, and the signal can be
recovered by passing it through a small-bandwidth ®lter (signal recovery ®lter) to
remove the wide-band noise, as shown in the ®gure.
Role of Despreading in Interference Suppression At the same time that
the spectrum of the desired GPS signal is narrowed by the despreading process, any
interfering signal that is not modulated by the C=A-code will instead have its
spectrum spread to a width of at least 2 MHz, so that only a small portion of the
interfering power can pass through the signal recovery ®lter. The amount of
interference suppression gained by using the C=A-code depends on the bandwidth
of the recovery ®lter, the bandwidth of the interfering signal, and the bandwidth of
3.2 GPS SIGNAL COMPONENTS, PURPOSES, AND PROPERTIES
41
the C=A-code. For narrow-band interferors whose signal can be modeled by a nearly
sinusoidal waveform and a signal recovery ®lter bandwidth of 1000 Hz or more, the
amount of interference suppression in decibels is given approximately by
Z 10 log
W
c
W
f
!
dB; 3:8
where W
c
and W
f
are respectively the bandwidths of the C=A-code (2.046 MHz) and
the signal recovery ®lter. If W
f
2000 Hz, about 30 dB of suppression can be
obtained for narrow-band interferors. When the signal recovery ®lter has a
bandwidth smaller than 1000 Hz, the situation is more complicated, since the
despread interfering sinusoid will have discrete spectral components with a 1000-
Hz spacing. As the bandwidth of the interfering signal increases, the C=A-code
despreading process provides a decreasing amount of interference suppression. For
interferors having a bandwidth greater than that of the signal recovery ®lter, the
amount of suppression in decibels provided by the C=A-code is approximately
Z 10 log
W
I
W
c
W
I
dB; 3:9
where W
I
is the bandwidth of the interferor. When W
I
) W
c
, the C=A-code provides
essentially no interference suppression at all compared to the use of an unspread
carrier.
Noise power
spectral density
Signal power spectrum
after despreading
Signal power spectrum
before despr
eading
Signal recovery filter
transfer function
f
Fig. 3.7 Despreading of the C=A-code.
42
SIGNAL CHARACTERISTICS AND INFORMATION EXTRACTION
Code Division Multiplexing Property The C=A-codes from different satel-
lites are orthogonal, which means that for any two codes c
1
t and c
2
t from
different satellites, the cross-covariance
1
T
T
0
c
1
tc
2
t À t dt 0 for all t: 3:10
Thus, when a selected satellite signal is despread using a replica of its code, the
signals from other satellites look like wide-band interferors which are below the
noise level. This permits a GPS receiver to extract a multiplicity of individual
satellite signals and process them individually, even though all signals are trans-
mitted at the same frequency. This process is called code division multiplexing
(CDM).
3.2.3 P-Code and Its Properties
The P-code, which is used primarily for military applications, has the following
functions:
1. Increased Jamming Protection. Because the bandwidth of the P-code is 10
times greater than that of the C=A-code, it offers approximately 10 dB more
protection from narrow-band interference. In military applications the inter-
ference is likely to be a deliberate attempt to jam (render useless) the received
GPS signal.
2. Provision for Antispoo®ng. In addition to jamming, another military tactic that
an enemy can employ is to radiate a signal that appears to be a GPS signal
(spoo®ng), but in reality is designed to confuse the GPS receiver. This is
prevented by encrypting the P-code. The would-be spoofer cannot know the
encryption process and cannot make the contending signal look like a properly
encrypted signal. Thus the receiver can reject the false signal and decrypt the
desired one.
3. Denial of P-Code Use. The structure of the P-code is published in the open
literature, so than anyone may generate it as a reference code for despreading
the signal and making range measurements. However, encryption of the P-
code by the military will deny its use by unauthorized parties.
4. Increased Code Range Measurement Accuracy. All other parameters being
equal, accuracy in range measurement improves as the signal bandwidth
increases. Thus, the P-code provides improved range measurement accuracy as
compared to the C=A-code. Simultaneous range measurements using both
codes is even better. Due to its increased bandwidth, the P-code is also more
resistant to range errors caused by multipath.
P-Code Characteristics Unlike the C=A-code, the P-code modulates both the
L
1
and L
2
carriers. Its chipping rate is 10.23 MHz, which is precisely 10 times the
3.2 GPS SIGNAL COMPONENTS, PURPOSES, AND PROPERTIES
43
C=A rate, and it has a period of one week. It is transmitted synchronously with the
C=A- code in the sense that each chip transition of the C=A-code always corresponds
to a chip transition in the P-code. Like the C=A-code, the P-code autocorrelation
function has a triangular central peak centered at t 0, but with one-tenth the base
width, as shown in Fig. 3.5. The power spectrum also has a sin
2
x=x
2
characteristic,
but with 10 times the bandwidth, as indicated in Fig. 3.6. Because the period of the
P-code is so long, the power spectrum may be regarded as continuous for practical
purposes. Each satellite broadcasts a unique P-code. The technique used to generate
it is similar to that of the C=A-code, but somewhat more complicated, and will not be
covered in this book.
Y-Code The encrypted form of the P-code used for antispoo®ng and denial of the
P-code to unauthorized users is called the Y-code. The Y-code is formed by
multiplying the P-code by an encrypting code called the W-code. The W-code is a
random-looking sequence of chips that occur at a 511.5-kHz rate. Thus there are 20
P-code chips for every W-code chip. Since both the P-code and the W-code have
chip values of Æ1, the resulting Y-code has the same appearance as the P-code, that
is, it also has a 10.23-MHz chipping rate. However, the Y-code cannot be despread
by a receiver replica P-code unless it is decrypted. Decryption consists of multi-
plying the Y-code by a receiver-generated replica of the W-code which is made
available only to authorized users. Since the encrypting W-code is also not known by
the creators of spoo®ng signals, it is easy to verify that such signals are not
legitimate.
3.2.4 L
1
and L
2
Carriers
The L
1
(or L
2
) carrier is used for the following purposes:
1. To provide very accurate range measurements for precision applications using
carrier phase.
2. To provide accurate Doppler measurements. The phase rate of the received
carrier can be used for accurate determination of user velocity. The integrated
Doppler, which can be obtained by counting the cycles of the received carrier,
is often used as a precise delta range observable that can materially aid the
performance of code tracking loops. The integrated Doppler history is also
used as part of the carrier phase ambiguity resolution process.
Dual-Frequency Operation The use of both the L
1
and L
2
frequencies
provides the following bene®ts:
1. Provides accurate measurement of ionospheric signal delay. A major source
of ranging error is caused by changes in both the phase velocity and group
velocity of the signal as it passes through the ionosphere. Range errors of 10±
20 m are commonplace and sometimes much larger. Because the delay
44
SIGNAL CHARACTERISTICS AND INFORMATION EXTRACTION
induced by the ionosphere is known to be inversely proportional to the square
of frequency, ionospheric range error can be estimated accurately by compar-
ing the times of arrival of the L
1
and L
2
signals. Details on the calculations
appear in Chapter 5.
2. Facilitates carrier phase ambiguity resolution. In high-accuracy GPS differ-
ential positioning, the range estimates using carrier phase measurements are
precise but highly ambiguous due to the periodic structure of the carrier. The
ambiguity is more easily resolved (by various methods) as the carrier
frequency decreases. By using L
1
and L
2
carrier frequencies, the ambiguity
resolution can be based on their frequency difference (1575:42 À 1227:6
MHz), which is smaller than either carrier frequency alone, and hence will
result in better ambiguity resolution performance.
3. Provides system redundancy (primarily for the military user).
3.3 SIGNAL POWER LEVELS
The L
1
C=A-code signal is transmitted at a minimum level of 478.63 W (26.8 dBW)
effective isotropic radiated power (EIRP), which means that the minimum received
power is the same as that which would be obtained if the satellite radiated 478.63 W
from an isotropic antenna. This effective power level is reached by radiating a
smaller total power in a beam approximately 30
wide toward the earth. The radiated
power level was chosen to provide a signal-to-noise ratio suf®cient for tracking of
the signal by a receiver on the Earth with an unobstructed view of the satellite.
However, the chosen power has been criticized as being inadequate in light of the
need to operate GPS receivers under less desirable conditions, such as in heavy
vegetation or in urban canyons where considerable signal attenuation often occurs.
For this reason, future satellites may have higher transmitted power.
As the signal propagates toward the earth, it loses power density due to spherical
spreading. The loss is accounted for by a quantity called the free-space loss factor
(FSLF), given by
FSLF
l
4pR
2
: 3:11
The FSLF is the fractional power density at a distance R meters from the transmitting
antenna compared to a value normalized to unity at the distance l=4p meters from
the antenna phase center. Using R 2 Â 10
7
and l 0:19 m at the L
1
frequency,
the FSLF is about 5:7 Â 10
À19
,orÀ182:4dB.
An additional atmospheric loss factor (ALF) of about 2.0 dB occurs as the signal
gets attenuated by the atmosphere. If the receiving antenna is assumed to be
isotropic, the received signal power is EIRP À FSLF À ALF 26:8 À 182:4 À
2:0 À157:6 dBW. Since a typical GPS antenna with right-hand circular polariza-
tion and a hemispherical pattern has about 3.0 dB of gain relative to an isotropic
3.3 SIGNAL POWER LEVELS
45
antenna, the minimum received signal power for such an antenna is about 3.0 dB
larger. These results are summarized in Table 3.3.
3.4 SIGNAL ACQUISITION AND TRACKING
When a GPS receiver is turned on, a sequence of operations must ensue before
information in a GPS signal can be accessed and used to provide a navigation
solution. In the order of execution, these operations are as follows:
1. Determine which satellites are visible to the antenna.
2. Determine the approximate Doppler of each visible satellite.
3. Search for the signal both in frequency and C=A-code phase.
4. Detect the presence of a signal and con®rm detection.
5. Lock onto and track the C=A-code.
6. Lock onto and track the carrier.
7. Perform data bit synchronization.
8. Demodulate the 50-bps navigation data.
3.4.1 Determination of Visible Satellites
In many GPS receiver applications it is desirable to minimize the time from receiver
turn-on until the ®rst navigation solution is obtained. This time interval is commonly
called time to ®rst ®x (TTFF). Depending on receiver characteristics, the TTFF might
range from 30 s to several minutes. An important consideration in minimizing the
TTFF is to avoid a fruitless search for those satellite signals that are blocked by the
earth, that is, below the horizon. A receiver can restrict its search to only those
satellites that are visible if it knows its approximate location (within several hundred
miles) and approximate time (within approximately 10 min) and has satellite
almanac data obtained within the last several months. The approximate location
can be manually entered by the user or it can be the position obtained by GPS when
the receiver was last in operation. The approximate time can also be entered
manually, but most receivers have a suf®ciently accurate real-time clock that
operates continuously, even when the receiver is off.
Table 3.3 Calculation of Minimum Received Signal Power
Minimum transmitted signal power (EIRP) 26.8
a
dBW
Free-space loss factor (FSLF) À182.4 dB
Atmospheric loss factor (ALF) À2.0 dB
Receiver antenna gain relative to isotropic (RAG) 3.0 dB
Minimum received signal power (EIRP À FSLF À ALF RAG) À154.6 dBW
a
Including antenna gain.
46
SIGNAL CHARACTERISTICS AND INFORMATION EXTRACTION
Using the approximate time, approximate position, and almanac data, the receiver
calculates the elevation angle of each satellite and identi®es the visible satellites as
those whose elevation angle is greater than a speci®ed value, called the mask angle,
which has typical values of 5
to 15
. At elevation angles below the mask angle,
tropospheric attenuation and delays tend to make the signals unreliable.
Most receivers automatically update the almanac data when in use, but if the
receiver is just ``out of the box'' or has not been used for many months, it will need
to search ``blind'' for a satellite signal to collect the needed almanac. In this case the
receiver will not know which satellites are visible, so it simply must work its way
down a predetermined list of satellites until a signal is found. Although such a
``blind'' search may take an appreciable length of time, it is infrequently needed.
3.4.2 Signal Doppler Estimation
The TTFF can be further reduced if the approximate Doppler shifts of the visible
satellite signals are known. This permits the receiver to establish a frequency search
pattern in which the most likely frequencies of reception are searched ®rst. The
expected Doppler shifts can be calculated from knowledge of approximate position,
approximate time, and valid almanac data. The greatest bene®t is obtained if the
receiver has a reasonably accurate clock reference oscillator.
However, once the ®rst satellite signal is found, a fairly good estimate of receiver
clock frequency error can be determined by comparing the predicted Doppler shift
with the measured Doppler shift. This error can then be subtracted out while
searching in frequency for the remaining satellites, thus signi®cantly reducing the
range of frequencies that need to be searched.
3.4.3 Search for Signal in Frequency and C=A-Code Phase
Why is a Signal Search Necessary? Since GPS signals are radio signals, one
might assume that they could be received simply by setting a dial to a particular
frequency, as is done with AM and FM broadcast band receivers. Unfortunately, this
is not the case.
1. GPS signals are spread-spectrum signals in which the C=A or P-codes spread
the total signal power over a wide bandwidth. The signals are therefore
virtually undetectable unless they are despread with a replica code in the
receiver which is precisely aligned with the received code. Since the signal
cannot be detected until alignment has been achieved, a search over the
possible alignment positions (code search) is required.
2. A relatively narrow post-despreading bandwidth (perhaps 100±1000 Hz) is
required to raise the signal-to-noise ratio to detectable and=or usable levels.
However, because of the high carrier frequencies and large satellite velocities
used by GPS, the received signals can have large Doppler shifts (as much as
Æ5 kHz) which may vary rapidly (as much as 1 Hz=s). The observed Doppler
3.4 SIGNAL ACQUISITION AND TRACKING
47
shift also varies with location on earth, so that the received frequency will
generally be unknown a priori. Furthermore, the frequency error in typical
receiver reference oscillators will typically cause several kilohertz or more of
frequency uncertainty at L-band. Thus, in addition to the code search, there is
also the need for a search in frequency.
Therefore, a GPS receiver must conduct a two-dimensional search in order to ®nd
each satellite signal, where the dimensions are C=A-code delay and carrier
frequency. A search must be conducted across the full delay range of the C=A-
code for each frequency searched. A generic method for conducting the search is
illustrated in Fig. 3.8 in which the received waveform is multiplied by delayed
replicas of the C=A-code, translated by various frequencies, and then passed through
a baseband correlator containing a low-pass ®lter which has a relatively small
bandwidth (perhaps 100±1000 Hz). The output energy of the detection ®lter serves
as a signal detection statistic and will be signi®cant only if both the selected code
delay and frequency translation match that of the signal. When the energy exceeds a
predetermined threshold b, a tentative decision is made that a signal is being
received, subject to later con®rmation. The value chosen for the threshold b is a
compromise between the con¯icting goals of maximizing the probability P
D
of
detecting the signal when it is actually present at a given Doppler and code delay and
minimizing the probability P
FA
of false alarm when it is not.
Searching in Code Delay For each frequency searched, the receiver generates the
same PRN code as that of the satellite and moves the delay of this code in discrete
steps (typically 0.5 chips) until approximate alignment with the received code (and
also a match in Doppler) is indicated when the correlator output energy exceeds
Sequence τ in
1
/
2
-chip increments
through full span of 1023 chips
Sequence frequency in 500-Hz increments
through span of 20 kHz centered at estimate
of received signal frequency
Detection threshold β
selected for:
Rece vied
signal
r(t)
Code
gen
OSC
90º
I
I
2
+Q
2
T
0
Q
∫
T
0
∫
T =3ms
P
FA
≅ 10
–3
Declare signal if Λ≥β
and no signal if Λ < β
Detection
sta tic
Λ
P
D
≅ 0.95
sit
Fig. 3.8 Signal search method.
48
SIGNAL CHARACTERISTICS AND INFORMATION EXTRACTION
threshold b. A step size of 0.5 code chip, which is used by many GPS receivers, is an
acceptable compromise between the con¯icting requirements of search speed
(enhanced by a larger step size) and guaranteeing a code delay that will be located
near the peak value of the code correlation function (enhanced by a smaller step
size). The best situation occurs when one of the delay positions is at the correlation
function peak, and the worst one occurs when there are two delay positions
straddling the peak, as indicated in Fig. 3.9. In the latter case, the effective SNR
is reduced by as much as 6 dB. However, the effect is ameliorated because, instead of
only one delay position with substantial correlation, there are two that can be tested
for the presence of signal.
An important parameter in the code search is the dwell time used for each code
delay position, since it in¯uences both the search speed and the detection=false-
alarm performance. The dwell time should be an integral multiple of 1 ms to assure
that the correct correlation function, using the full range of 1023 code states, is
obtained. Satisfactory performance is obtained with dwell times from 1 to 4 ms in
most GPS receivers, but longer dwell times are sometimes used to increase detection
capability in weak-signal environments. However, if the dwell time for the search is a
substantial fraction of 20 ms (the duration of one data bit), it becomes increasingly
probable that a bit transition of the 50-Hz data modulation will destroy the coherent
processing of the correlator during the search and lead to a missed detection. This
imposes a practical limit for a search using coherent detection.
The simplest type of code search uses a ®xed dwell time, a single detection
threshold value b, and a simple yes=no binary decision as to the presence of a signal.
Many receivers achieve considerable improvement in search speed by using a
sequential detection technique in which the overall dwell time is conditioned on a
ternary decision involving an upper and a lower detection threshold. Details on this
approach can be found in [125].
Fig. 3.9 Effect of
1
2
chip step size in code search.
3.4 SIGNAL ACQUISITION AND TRACKING
49