A study from gender perspective on actual condition of sharing housework in vietnam
Bạn đang xem bản rút gọn của tài liệu. Xem và tải ngay bản đầy đủ của tài liệu tại đây (1.06 MB, 66 trang )
VIETNAM NATIONAL UNIVERSITY, HANOI
VIETNAM JAPAN UNIVERSITY
NGUYEN THU HA
A STUDY FROM GENDER PERSPECTIVE
ON ACTUAL CONDITION OF SHARING
HOUSEWORK IN VIETNAM
MASTER'S THESIS
Hanoi, 2019
VIETNAM NATIONAL UNIVERSITY, HANOI
VIETNAM JAPAN UNIVERSITY
NGUYEN THU HA
A STUDY FROM GENDER PERSPECTIVE
ON ACTUAL CONDITION OF SHARING
HOUSEWORK IN VIETNAM
MAJOR: PUBLIC POLICY
CODE: PILOT
RESEARCH SUPERVISOR:
Prof. Dr. NAOHISA OKAMOTO
Dr. BUI HAI THIEM
Hanoi, 2019
Acknowledgement
First of all, I would like to express my sincere gratitude to my supervisors Prof.
Okamoto Naohisa and Dr. Bui Hai Thiem. Prof. Okamoto has patiently provided me
with wholeheartly support during my internship in University of Tsukuba and
insightful comments and comprehensive instruction. Also, Dr. Bui Hai Thiem has
provided me useful information related to Vietnamese context and introduced me a
number of gender experts for in-depth interviews. Their guidance and support have
greatly contribute to my Master thesis accomplishment.
I also would like to give special thanks to Dr. Nguyen Ngoc Anh, Director of the
Development and Polices Research Center (DEPOCEN) for allowing me to use data
of time-use survey conducted by the Center in 2017.
Finally, my sincere thanks also go to my colleagues at DEPOCEN, Mr. Kentaro
Takeda – my tutor at University of Tsukuba and Vietnam Japan University, especially
the Master program in Public Policy for support during my thesis writing progress.
i
Table of Contents
Acknowledgement....................................................................................................... i
List of tables ...............................................................................................................iv
List of figure ..............................................................................................................iv
List of abbreviations ................................................................................................... v
1.
2.
CHAPTER 1 – Background and Research Purpose .........................................6
1.1.
Background .................................................................................................6
1.2.
Research purpose .....................................................................................11
CHAPTER 2 – Literature review .....................................................................13
2.1.
Researches on unpaid care work in the world .......................................13
2.2.1. Understanding of unpaid care work/housework .....................................13
2.2.2. Unpaid care work and the issue of gender inequality.............................14
2.2.
3.
4.
5.
Researches on unpaid care work in Vietnam ........................................18
CHAPTER 3 – Methodology ............................................................................20
3.1.
Time use survey questionnaire ................................................................20
3.2.
Quantitative data collection .....................................................................22
3.3.
Description of sample ...............................................................................23
3.4.
Qualitative data collection .......................................................................27
CHAPTER 4 – Main Findings .........................................................................29
4.1.
Time spending on doing housework .......................................................29
4.2.
Time distribution on other rountine activities .......................................37
4.3.
Nexus between time spending on housework and life satisfaction ......41
CHAPTER 5: Policy Implications ...................................................................43
6.
CHAPTER 6: Conclusion ................................................................................48
REFERENCE LIST .................................................................................................50
ANNEX 1 – Time-use survey questionnaire ...........................................................54
ANNEX 2 – Interview questions ..............................................................................62
ANNEX 3 – T-test (DEPOCEN time-use data) .......................................................63
List of tables
Table 1.1. The gender divide in the labor market in advanced economies ............................ 7
Table 2.1. Time spent in unpaid work and paid work, by sex of OECD countries ............. 15
Table 3.1. Activity categories and code ............................................................................... 20
Table 3.2. Characteristics of respodents .............................................................................. 23
Table 3.3. Respondents by provinces and gender ................................................................ 27
Table 3.4. List of gender experts ......................................................................................... 27
Table 5.1. Differece in averange time on activity categories in female and male stata, by
geography, marital status and income.................................................................................. 40
Table 5.2. Respondents’ satisfaction level with the life by gender (%) .............................. 41
Table 5.3. Women’ satisfaction level with the life based on average time for homemaking
(%) ....................................................................................................................................... 42
Table 6.1. Vietnam’s legal framework for women’s rights and gender equality ................ 43
List of figure
Figure 1.1. Annual GDP growth in the period of 1986 to 2017(%) ...................................... 8
Figure 4.1. Average time spent doing housework by gender and by nations (min) ............ 30
Figure 4.2. Time spending on doing housework by gender and marital status (min) ......... 31
Figure 4.3. Time spending on doing housework by gender and marital status (min) ......... 32
Figure 4.4. Time spending on doing housework by gender and education level (min) ....... 33
Figure 4.5. Time spending on doing housework by gender and income groups (min) ....... 34
Figure 4.6. Time spending on doing housework by gender and urban-rural (min) ............. 35
Figure 4.7. Time spending on doing housework by gender and urban-rural (min) ............. 38
List of abbreviations
DEPOCEN Developement and Policies Research Center
GDP
Gross domestic product
GSO
General Statistics Office of Viet Nam
ILO
The International Labor Organization
OECD
The Organization for Economic Co-operation and Development
UNDP
The United Nations Development Programme
1.
CHAPTER 1 – Background and Research Purpose
1.1. Background
Building upon the Millennium Development Goals in 2015, 17 Sustainable
Development Goals in September was developed by the United Nations General
Assembly that culminated at a blueprint for peace and prosperity for human and
planet, now and into the future (McInnes, 2018). Among these goals, reduced
inequalities is deemed as one of the most pertinent global challenges. Numerous facts
show that we are living in “a world in which one percent of humanity controls as
much wealth as the other 99 percent”(Address et al., 2019). For instance, since 2015,
the richest 1% has accumulated more wealth than the rest of the planet (Shorrocks,
Davies, & Lluberas, 2016). Or, the incomes of the poorest 10% of the population has
increased by less than $3 a year between 1988 and 2011, while the incomes of the
richest 1% has increased 182 times as much (Hardoon, 2017). Under this context of
growing inequality, it is recognised that women are likely to fall into the bottom half
of the income distribution for the lower opportunities prevalent for women to
participate in the labor market than those for men (ILO, 2016). Women are also
reported to earn between 31% to 75% less than men for equal work of equal value
(UN Women, 2015). The World Economic Forum’s annual report in 2016 even
estimates that it will take 170 years for women to be paid the same as men (World
Economic Forum, 2016). According to recent statistics, even in advanced economies
which have succeeded in eliminating gender disparities in education, men continue
to dominate high-income groups while women remain disproportionately responsible
for carrying out unpaid housework in the home. Furthermore, the wealth and income
inequality trends become increasingly prominent internationally (Hardoon, 2017).
6
Table 1.1. The gender divide in the labor market in advanced economies
Spain 2010
Denmark 2013
Canada 2013
New Zealand
2013
Italy 2014
UK 2013
Australia 2012
Norway 2013
% of women in % of women in
the top 10%
the top 1%
income group
income group
33%
22%
31%
16%
30%
22%
29%
19%
29%
28%
25%
22%
20%
18%
22%
14%
Share of unpaid
care work done by
women (latest year)
63%
57%
61%
65%
75%
65%
64%
57%
Note: Reprinted from OECD stat Employment: Time spent in paid and unpaid work,
by
sex.
Retrived
from
/>
Working-Paper-5---Atkinson.pdf
Some studies ascertained that the primary factors causing the economic disparity
between men and women are skill and qualification (Bryan & Sevilla-Sanz, 2011).
And housework is listed as one of most significant factors explaining gender
economic gap (Becker, 1985). Becker argues that housework causes women to spend
less time on market work, lowering their investment in market human capital. Indeed,
he claims that housework indirectly lowers the wage rate of women. It could be said
that the disparity becomes a concern for ‘gender justice’ not only because the tasks
and the women who perform them are undervalued, but also because a
disproportionately higher level of care work restricts personal growth and
professional development (Marphatia & Moussié, 2013).
Viet Nam is located in the Eastern part of the Indochina peninsula, bordering China
to the North, Laos and Cambodia to the West. Historically, Vietnam fell under the
dominant rule of a series of Chinese dynasties for 1,000 years that resulted in the
heavy influence of Chinese culture and ideology. Subsequently, two bloody wars
against French colonization and American War ruined and pushed the country into
7
utter misery and underdevelopment. After gaining independence, and undergoing a
succession of policies known as the “Doi Moi” which enabled the development of a
market economy in 1986, Vietnam has undergone a vigorous change in both social
and economic aspects. Following over 30 years of reforms, Vietnam has spurred rapid
socio-economic growth and attained a lower middle-income country status (2011 per
capita income of US $1,260) (World Bank, 2013).
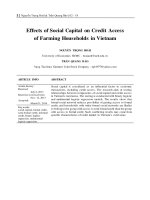
In terms of economic development, Vietnam’s growth rate has boomed under the
impact of the economic intergration policies. In general, Vietnam’s GDP rate
increased from 2.8 percent in 1986 to 6.8 percent in 2017 while those figures of other
lower middle-income economies are respectively 4.0 percent and 5.5 percent (see
Figure 1.1). Between 2008 and the present day, despite the global economic crisis,
Vietnam’s economic growth has still remained relatively stable with an annual GDP
growth rate of around 6 to 7 percent.
Figure 1.1. Annual GDP growth in the period of 1986 to 2017(%)
Note: Reprinted from World Bank national accounts data, and OECD National
Accounts
data
files.
Retrived
from
d-
ilibrary.org/economics/data/oecd-national-accounts-statistics_na-data-en
8
Alongside the rapid economic development, the poverty rate has significantly
decreased. Vietnam is recognized as a good model of remarkable progress on poverty
reduction by many reputable organizations such as the World Bank, United Nations
Development Programme (UNDP). The poverty headcount in Vietnam fell from 60
percent in the early 1990s to 20.7 percent in 2010 based on the new poverty line (A
new poverty line was estimated for 2010 by the General Statistical Office and World
Bank that better reflects living conditions of the poor. Based on the new poverty line
(equal to VND 653,000/person/month or $2.25/person/day, PPP 2005) and updated
monitoring system, the national poverty rate in 2010 is 20.7 percent vs. an official
poverty rate of 14.2 percent in 2010 using official MOLISA urban and rural poverty
lines of VND 500,000/person/month and VND 400,000/person/month, respectively.
(World Bank, Poverty Reduction in Vietnam: Remarkable Progress, Emerging
Challenges, 2013)), and only a mere less than 3 percent (equivalent to only 0.8
percent
of
Vietnam
population)
(The
World
Poverty
Clock.
living in extreme poverty using the old poverty
line indicators (Extreme poverty refers to people living on less than US $1/90 per
percent a day). In particular, the poverty decline among ethnic minorities during this
period was the most impressive for the past two decades, down from 57.8% to 44.6%
(World Bank, 2018).
The economic development led to an expansion of the middle-class and a more
dynamic civil society. It is reported that Vietnam has the highest increasing rate of
middle-class people in Southeast Asia (Yew Heng Lim , Mariam Jaafar, n.d.). There
were 8 million middle-class people in 2012 in Vietnam and this number is predicted
to increase to 44 million in 2020 and 95 million in 2030 (Niesel Analysis, it is number
of people who consume US $10 - $100 per person per day ) with an income of $5,00035,000 a year (Hakuhodo Institute of Life and Living ASEAN, 2015). The existence
of an already high and growing number of middle-class citizens is expected to bring
significant changes in economic and social development for Vietnam.
9
Additionally, Vietnam has attained a higher level of educational achievement. For
example, due to policy of compulsory primary education, the literacy level has
increased remarkably as the literacy rate of Vietnam in 2016 is 95 percent and the
school enrollment at all levels has also increased significantly. Although there are
differences between males and females and between urban and rural areas, the gaps
have narrowed significantly. Consequentially, the labor force qualification levels
have steadily improved as the percentage of trained employed workers aged 15 and
above has increased over the years. Following the higher qualified labor force, the
productivity of human resources has also dramatically improved. According to the
GSO, the productivity of employed population has increased from 55.2 million dong
per person in 2011 to 84.5 million dong per person in 2016.
Although moving to a middle-income country oriented by the market economy has
prompted a proliferation of job opportunities, women’s participation in the formal
economy has declined since the reforms (Asian Development Bank, 2002). Tran and
Le (1997) have argued that the Doi Moi economic restructuring has resulted in the
conceptualization of individual households as autonomous economic units, thereby
reinforcing Confucian ideals about appropriate male and female roles within the
household and society. Whilst a series of government initiatives have promoted
gender equality in certain areas, such as education and health care systems, this hasn’t
translated into any progress in regards to female involvement in the labor market.
Indeed, Higgins (2015) and Tran (2004) have both recognized in their studies that
although there have been considerable improvements in socio-economic aspects of
women’s lives, gender inequality continues to inversely impact them. According to
the Global Gender Gap reports, Vietnam regressed from ranking 42 globally in 2007,
to 77 in 2018 (Saadia, Thierry, & Robert, 2018). Viet Nam is also recorded among a
few countries in the world where the gender pay gap has been widening, while the
gap in most other nations has declined. In fact a 2 percent increase in the gap was
recorded in Viet Nam between 2008-2011 (ILO, 2012). According to a report
published by the World Bank, data from Vietnam’s Labor Force Surveys (LFS)
10
between 2011 and 2014 show that, on average, women earn VND 3,000,000 less than
men annually. Additionally, in both state and non-state, and agricultural and nonagricultural sectors, women earn less than men. This income gap “is present across
all age groups, widening around child-bearing age and spiking in the 55-59 age cohort,
around retirement age for women (at age 55) (Chowdhury, Johnson, Mannava, &
Perova, 2018). The report also revealed that female workers in Vietnam are, in fact,
more likely to choose to work in lower paid occupations and industries that offer
benefits like paid leave, health insurance, social insurance, and a formal contract.
Furthermore, the authors of the report found the reason “why women would choose
such low paid occupations” to be the unequal distribution of household labor in
Vietnam. Because they spend significantly more time than their male counterparts on
household work, women have less time to spend in a formal occupation, and are in
greater need of those non-monetary benefits they have such a tendency to seek out in
lieu of jobs that are higher paid.
1.2. Research purpose
Although researches and reports on issue of unpaid housework in all over the world
has provoked considerable debate amongst a scholars and politicians due to its
implications for development policy, it is undeniable that it disproportionately affects
women (Derock, 2019). In Vietnam, this issue is still a new sphere of knowledge
requiring further study due to a lack of reliable standard data. This paper is more
advanced than a couple of previous studies in Viet Nam because it employs data from
the first time-use survey in Vietnam that is a standard data used by OECD.
The study aims to measure time spending on doing domestic works and care tasks
carried by men and women in 5 provinces. Then, it will examine impact of
determinants including education level, income level, generation, marital status and
geographical location (urban-rual) on women’s time doing housework. Especially, it
will find whether a nexus between time women spend on housekeeping and their life
satisfaction level. Finally, from findings of time-use survey data, several policy
implications will be proposed under the Viet Nam context.
11
Three main research questions that will be discussed in this paper are:
➢ How many minutes are there women and men spend on housework everyday?
• Whether is there impact of determinants including education level, income
level, generation, marital status and geographical location (urban-rual) on time
doing housework?
• What is impact of the burden of housework tasks on other daily activities?
➢ Whether is there a nexus between the time spent on housework and life
satisfaction or not?
➢ Is there any policy gap in promoting gender equality in housework activities in
Vietnam and recommendations to address this gap?
In order to answer those research questions above, four hypotheses are put forward.
➢ Hypothesis 1: Regardless of geographical location, marital status, generation,
income, and education level, women spend more time conducting household
tasks than men.
➢ Hypothesis 2: Geographical location, marital status, generation, income, and
education level have impact on women’s time spending on doing housework.
➢ Hypothesis 3: Due to the time burden of household tasks, women’s time available
for personal care, working and relaxation is less than men.
➢ Hypothesis 4: There is a nexus between the time spent on housework and life
satisfactionn
12
2.
CHAPTER 2 – Literature review
2.1. Researches on unpaid care work in the world
2.2.1.
Understanding of unpaid care work/housework
Many economic theories were established without recognition of production,
reproduction and service activities in the informal, subsistence, or household sectors.
For example, the “production boundary” first establisted by the United Nations
System of National Accounts (UNSNA) in 1953 just counts all production if they are
exchanged for money and unduplicated by intermediate products (United Nations,
1953). Then, in 1993, the UNSNA revised the concept of the production boundary
that excluded the following domestic and personal services within households from
measured production in national accounts. They are (Statistical Commission of the
United Nations, 1993):
(a)
The cleaning, decoration and maintenance of the dwelling occupied by the
household, including small repairs of a kind usually carried out by tenants as
well as owners;
(b)
The cleaning, servicing and repair of household durables or other goods,
including vehicles used for household purposes;
(c)
The preparation and serving of meals;
(d)
The care, training and instruction of children;
(e)
The care of sick, infirm or old people;
(f)
The transportation of members of the household or their goods.
The latest version in 2008 (Statistical Commission of the United Nations, 2008) still
excluded all production of services for own final consumption within households.
Those excluded household production are:
(a)
The production of agricultural goods by household enterprises for own final
consumption;
(b)
The production of other goods for own final use by households: the construction
of dwellings, the production of foodstuffs and clothing, etc.;
13
(c)
The production of housing services for own final consumption by owner
occupiers;
(d)
The production of domestic and personal services for consumption within the
same household: the preparation of meals, care and training of children,
cleaning, repairs, etc.
All things considered, housework that is discounted in the country’s GDP is defined
by the UNDP as unpaid work. The are several reasons provided for excluding unpaid
work in GDP such as: (i) a lack of data, (ii) unpaid work does not affect important
factors such as employment and poverty, and (iii) a change in GDP accounting
method would make it difficult to compare trends over time.
2.2.2.
Unpaid care work and the issue of gender inequality
It is factually apparent that women perform the majority of unpaid labor and domestic
work globally. This ‘unpaid work’ includes activities such as cooking, cleaning,
looking after family members and voluntary community work (Elson, 2000). Many
studies conducted in different regions and nations all over the world concluded that
women spend between 2-10 times longer on unpaid work than men (OECD, 2014).
For example, a study in Turkey 2016 found that women in this nation spend 6 times
greater than men on domestic and care tasks, respectively 317 minutes and 51 minutes
per day (Ertugrul, 2016). Another study conducted in Philippines. Uganda and
Zimbabwe revealed that on average women work more hours of household care
responsibilities than men do, up to 11 to 12 hours per day (Rost & Koissy-Kpein,
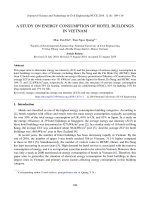
2017). The following table provides statistics of the difference between gender time
use pattern of OECD countries and 3 non-OECD countries. Generally, the average
time spent conducting unpaid work by women is higher than men, especially in Asian
countries. For example, Japan and Korea are two nations that have the largest amount
of difference between men and women on the time spent conducting unpaid work
among OECD countries, as women spend 5 times more time than men. Japan and
Korea also are nations whose men spend the least amount of time doing housework,
on average less than one hour per day.
14
Table 2.1. Time spent in unpaid work and paid work, by sex of OECD countries
Age Group 15-64
Latest year (2018)
Time
Time spent in
Time spent in
Time spent in
paid work, by
total work, by
Indicator unpaid work,
by sex
sex
sex
Sex
Unit
Country
Australia
Austria
Belgium
Canada
Denmark
Estonia
Finland
France
Germany
Greece
Hungary
Ireland
Italy
Japan
Korea
Latvia
Lithuania
Luxembourg
Mexico
Netherlands
New Zealand
Norway
Poland
Portugal
Slovenia
Spain
Sweden
Men Women
Minutes per
day
Men Women
Minutes per
day
Men Women
Minutes per
day
171.6
135.3
144.2
148.1
186.1
160.2
157.5
134.9
150.4
95.1
162.3
129.2
130.7
40.8
49.0
129.7
151.6
121.1
136.7
145.4
141.0
168.5
158.8
96.3
166.5
145.9
171.0
304.1
364.8
273.7
340.5
260.1
264.1
248.6
235.1
289.5
274.3
272.7
343.9
220.8
451.8
419.0
376.9
354.3
330.0
485.9
284.9
338.0
277.4
314.8
372.3
299.8
236.2
313.0
475.7
500.1
417.9
488.7
446.2
424.2
406.0
370.1
440.0
369.4
435.0
473.1
351.5
492.6
468.0
506.7
505.9
451.1
622.6
430.4
479.0
445.9
473.6
468.6
466.3
382.1
484.0
311.0
269.2
237.3
223.7
242.8
249.2
235.8
224.0
242.3
259.5
293.8
296.1
306.3
224.3
215.0
253.3
292.0
239.6
383.3
224.9
264.0
227.4
295.0
328.2
286.2
289.1
220.2
172.0
248.8
199.2
268.3
194.6
244.9
209.9
175.4
205.5
184.5
202.5
197.1
133.1
271.5
269.4
288.5
279.3
238.9
250.1
201.4
205.0
200.0
203.2
231.3
234.2
166.8
275.2
483.0
517.9
436.6
491.9
437.4
494.1
445.7
399.4
447.7
444.0
496.3
493.2
439.5
495.8
484.4
541.7
571.2
478.5
633.4
426.4
469.0
427.4
498.2
559.4
520.4
455.9
495.3
15
Turkey
67.6
305.0 358.3
133.9 425.8
439.0
United Kingdom
140.1
248.6 308.6
216.2 448.7
464.8
United States
145.8
244.0 336.9
243.4 482.7
487.4
OECD - Average
136.0
264.4 318.3
218.1 454.4
482.5
NonChina
91.0
234.0 390.0
291.0 481.0
525.0
OECD
India
51.8
351.9 390.6
184.7 442.3
536.6
Economies South
Africa
102.9
249.6 294.2
195.0 397.1
444.6
Note: Reprinted from Data extracted on 22 May 2019 08:32 UTC (GMT). Retrived
from OECD.Stat. />Other studies then found that the unequal distribution of housework is related to the
gender gap in economic opportunities and women’s income. To be more precise, time
spent doing housework is negatively correlated with participation in the labor market.
Despite perceptions that globalization has fostered a multitude of job opportunities,
there has been a global decline in female labor force participation, dropping from
52.4% in 1995 to 49.6% in 2015 (ILO, 2016). Indeed, participation in the paid
employment sector does not relieve women from them domestic duties. Due to time
constraints and family demands, paid employment is not a viable option for many
women, which has resulted in many women sacrificing formal employment
opportunities and dropping out of the labor market (Samantroy & Giri, 2015). A study
in Latin America and Caribbean countries found that over 50% of ‘inactive’ women
between the ages of 20-24 referenced their domestic responsibilities as the reason
why they didn’t work (Alfers, 2015). Those who attain formal employment have to
undertake the ‘double burden’ of committing to formal employed work whilst
fulfilling their domestic responsibilities, an impossible feat for many. In this way,
unpaid and domestic work inhibits women’s ability to fully participate in the paid
economy (OECD, 2019). Additionally, as the burden of housework falls on the
women’s shoulders, they tend to engage in part-time or informal employment that is
accompanied by poor working conditions and is poorly paid (Hegewisch & Gornick,
2011).
16
From economic theory, housework was introduced as the set of factors explaining the
gender wage gap firstly by Gary Becker since 1985. Firstly, Becker argued that
housework causes women to spend less time on market work, lowering their
investment in market human capital. Indeed, he claimed that housework indirectly
lowered the wage rate of women. Secondly, assuming that unpaid housework is more
effort intensive compared to other paid activities, that effort is fixed for each
individual, and that earning in market work per hour depends on effort. Becker proved
that the more effort women spend on housework, the less effort they spend on market
work, and the lower wage rate they earn, even when they spend the same amount of
time in doing market work compared to men. On this aspect, housework directly
lessens the wage rate of those who spent more time/ effort on housework. The lower
wages caused by the two aforementioned channels would lead to lower investment
of an individual to his/ her market human capital in the future, resulting in an even
lower wage rate in the long run (Becker, 1985).
Another study demonstrated that rather than affecting wages, housework is correlated
with unobserved individual characteristics that have a negative effect on wages
(Hersch & Stratton, 1994). In order to separate the relation of housework and wage
rate in this channel from direct impacts of housework on the wage rate in Becker’s
model, Hersch & Stratto used an estimation with instrumental variables and fixed
effects models. According to them, if there is a direct relationship between housework
time and wage rate, the coefficient of housework time in explanation of gender wage
gap will remain negative after controlling for endogeneity and individual-specific
characteristics. On the contrary, if unobserved characteristics are the determining
factor, the observed negative correlation between wages and housework is spurious
and will disappear when the wage-housework relation is correctly specified.
The division of household labor also inhibits women’s political and social mobility
in public and private spheres (OECD, 2019). The dilemma of unpaid and domestic
work has contributed to a plethora of debates on recognising the value and economic
contribution of women’s work as well as the social and cultural factors which dictate
17
where women are socially located (Samantroy & Giri, 2015). The allocation of the
majority share of domestic responsibilities to women is deeply rooted in power-laden
gender binaries and cultural values which suggest women are naturally the primary
caregivers. Indeed, although gender is an ‘irreducibly social concept’ it has long been
conceptualized as a ‘natural’ and ‘biological’ factor that characterizes an individual’s
emotions and behaviors. This depiction has long been used to sustain the patriarchal
hierarchy and justify the domestic role prescribed to women within society.
In summary, unpaid work is undoubtedly a crucial element of economic activity, and
indispensable in upholding the well-being of individuals, their families and society
(Stiglitz, Joseph E; Sen, Amartya; Fitoussi, 2008). Yet this issue remains frequently
absent from policy agendas due to the fact that it is difficult to measure and thereby
less relevant for policies (OECD, 2014). The root of this unequal distributrion could
be explained by socio-demgraphic and economic factors, but is mainly caused by
entrenched stereotypes on gender roles of different social institutions (Jütting,
Morrisson, Dayton‐Johnson, & Drechsler*, 2008). Hence, in order to narrow the
unequal gap, the first step is to redistribute of responsibility for housework between
women and men (OECD, 2014).
2.2. Researches on unpaid care work in Vietnam
Aware of the importance of gender issue, the Vietnamese government has issued
dozens of legal documents and policies to promote gender equality. In particular, the
Vietnamese government has ratified a number of international agreements and
conventions on basic human rights such as the International Covenant on Civil and
Political Right (ICCPR); the International Covenant on Economic, Social and
Cultural Rights (ICESCR); the Committee on the Elimination of Racial
Discrimination (CERD); the Convention on the Elimination of All Forms of
Discrimination against Women (CEDAW) and the Convention on the Rights of the
Child (CRC). These international commitments were fundamental for the
development of the legal framework and national policies to address gender disparity
18
in Vietnam (GSO - WHO, National study on Domestic Violence against Women in Viet
Nam 2010).
Nevertheless, there is little understanding about unpaid work and its impact on gender
inequality in Vietnam. Recently, there have been a couple international organizations
that have launched studies to raise public awareness of gender imparity in housework
distribution. In particular, the ‘Unpaid Care Work’ research by ActionAid Vietnam
shows that Vietnamese women spend over 5 hours a day conducting unpaid domestic
work, compared to a mere 2 hours conducted by men (ActionAid International, 2016).
Unpaid care work conducted in Vietnam is estimated to total 13 million working days
per year. When this time is valued, it is calculated that this work is worth is over 20%
of Vietnam’s GDP (Viet Nam News, 2016).
Another study conducted in 2017 by Tien revealed that women’s average time daily
spent on unpaid housework is approximately 40.3-58.6 minutes more than men’s.
Moreover, this gap always exists regardless of working status, age, household sizes
and income levels (Tien, 2017). It is noted that in this study, Tien used data extracted
from two questions of the Vietnamese household living standard survey 2008
(VHLSS 2008). They are self-estimations by the respondents of their time spent daily
on household work rather than recording each specific task from the exact begining
and end.
Up to now, large-scale time-use survey data has been unavailable in Viet Nam, so
researchers have been unable to attain reliable data for their relevant studies. As
mentioned above, some organizations have started to conduct data on time use
patterns, but on a small scale only. For example, the ActionAid Vietnam study was
undertaken in nine provinces. There are 784 women and men who were invited to
provide information about their time use diaries.
In brief, there are few studies about unpaid work within the household in Vietnam so
far. That could be explained by the lack of national data disaggregated by gender on
time spent on daily household activities.
19
3.
CHAPTER 3 – Methodology
A combination of quantitative and qualitative methods is used for data collection.
Quantitative data was collected since 2017 by Development and Policies Research
Center, using time use survey questionnaire. Qualitative data that is expert
consultancy then were conducted by the author in 2019 with experts in gender and
sociology fields.
3.1. Time use survey questionnaire
Time-use surveys are the primary statistical vehicle for recording information on how
people precisely allocate their time over a specified period— typically over the 24
hours of a day. A well-designed survey classifies activities across a total duration of
24 hours (or 1,440 minutes) per day (Margarita, Graham, & Mike, 2004). Time-use
statistics shed light on:
− What individuals in the reference population do, or the activities they engage in.
− How much time is spent doing each of these activities.
Activities recorded in time-use surveys constitute the whole range of activities that a
person may spend time on during the course of a day, including, for example, eating,
sleeping, playing and caring children, working, doing household work, studying,
relaxing, travelling and others.
In this survey, the data collection agency, Development and Policies Research Center
(DEPOCEN) used the American Time Use Survey Activity Lexicon 2016 to code
activities collected into time-use categories. The activity code will be presented in
the following table. The full time-use questionnaire will be found in the Annex 1.
Table 3.1. Activity categories and code
No.
1
2
3
4
Activities
Sleep
Personal activities (grooming, self-care, etc.)
Eating
Household activities
20
4.1
4.2
4.3
4.4
Housework (interior cleaning, laundry, sewing, etc.)
Food & Drink Prep., Presentation, & Clean-up
Interior Maintenance, Repair, & Decoration
Household Management (Household organization and planning, financial
management, etc.)
4.5 Others
5
Caring For & Helping Household (HH) Members
5.1 Caring For & Helping HH Children (Physical care for household
children, playing with household children, etc.)
5.2 Activities Related to HH Children's Education (Homework (household
children), Waiting associated with household children's education, etc.)
5.3 Activities Related to HH Children's Health
5.4 Caring and Helping for Household Adults (elderly)
5.5 Others
6
Caring For & Helping Non-household Members
7
Work and Work Related Activities
7.1 Work, main job
7.2 Work-Related Activities (Eating and drinking as part of job, Socializing,
relaxing, and leisure as part of job, etc.)
7.3 Other Income-generating Activities
7.4 Job Search and Interviewing
7.5 Others
8
Education
8.1 Taking class for degree, certification, or licensure
8.2 Taking extra class (at school, centers)
8.3 Extracurricular School Activities (Except Sports)
8.4
Research/homework
8.5 Others
9
Socializing, Relaxing, and Leisure
9.1 Socializing and communicating with others
9.2 Attending or hosting parties/receptions/ceremonies
9.3 Attending/hosting sport events
9.4 Attending movies/film
9.5 Using social networks (Facebook, Twitter …)
9.6 Relaxing (Reading, watching …) on digital devices (tablet, smartphone,
etc.)
9.7 Reading books, newspaper
9.8 Watching TV, listening to radio
9.9 Relaxing
9.20 Others
10
Consumer Purchases
10.1 Food Shopping (Store, Telephone, Internet)
10.2 Shopping (Store, Telephone, Internet), not food
21
10.3
10.4
11
12
13
14
15
16
17
18
18.1
18.2
18.3
18.4
18.5
19
Researching Purchases
Others
Telephone Calls (to or from)
Participating in Sports, Exercise, or Recreation
Participation in religious practices
Participation in Volunteer Activities
Using personal care services (banking, legal services, Real Estate, health
and care services, veterinary services, etc.)
Using Government Services (Obtaining licenses & paying fines, fees,
taxes, etc.)
Using Household Services (interior cleaning services, clothing repair and
cleaning services, pet services, vehicle maintenance or repair services, etc.)
Traveling
Travel Related to Work
Travel Related to Caring For & Helping HH Members
Travel Related to Socializing, Relaxing, and Leisure
Travel Related to Consumer Purchases
Travel related to other activities
Others
For analysis, in this paper I would like to concentrate on a number of activity catergies
so that the 19 activities mentioned above will be grouped into the following categories.
• Category 1: Personal care (No. 1 and No. 2 and No. 3 and No. 8)
• Category 2: Time for doing Housework (No. 4 and No. 5)
• Category 3: Work activities (No. 7)
• Category 4: Relaxing and Public life (No. 6, No. 9, and No. 10 – 19)
3.2. Quantitative data collection
The multi-stage sampling method was applied in the sampling process. This design
ensures that, within a given stratum, individuals who are drawn from different
sampling units have the same probability of being selected, even if the size of the
sampling units vary within that stratum.
There are a total of nearly 1,500 households surveyed in the 5 provinces: Phu Tho,
Hanoi (representative of the North), Da Nang (representative for the Center), Ho Chi
Minh City, and Long An (representative of the South).
22
As mentioned previously, it is the first time a time use survey was conducted by
DEPOCEN, so a number of limitations were found after the data collection process
was completed. For example, the questionnaire often took around 40 minutes for one
respodent to complete, making it difficult to persuade the second member of the
household to participate also. As a result, it is impossible to collect time use of both
spouse for relative comparison. Among 1,500 respondents, females account for only
30 percent. Moreover, the survey time was often during the daytime so it was
challenging to meet and interview respondents working in particular jobs such as
state-owned organizations. Last but not least, in order to have a comprehensive
understanding of housework distribution, it may include questions on other aspects
such as decision making in family, confidence level and people’s attitude towards
tradition norms of gender roles, that are lacking in this survey. That results in a purely
descriptive study for data collection. It then could be improved by addressing these
limitation and following other researches in the future.
3.3. Description of sample
There are a total of 1,508 people interviewed in the time use survey. However, among
them, only 1,193 people responded that their time use the previous day was typical.
Those figures will be used to analyse daily time-use behavỉor. In accordance with the
survey design, respondents are required to be the household’s head and/or the second
adult in the household who have a close relation with the household’s head, such as
their spouse or mature child. In Vietnam, traditionally men are defined as the head of
households, so in this survey the number of male respondents is the overwhelming
majority. Male respondents account for 70 percent.
The following table presents some key features of respondents.
Table 3.2. Characteristics of respodents
Gender
Female Female Male Male
No.
%
No.
%
General
Total Total
No.
%
Age cohorts
23