Lessons from NAFTA_chap7
Bạn đang xem bản rút gọn của tài liệu. Xem và tải ngay bản đầy đủ của tài liệu tại đây (309.99 KB, 35 trang )
Chapter 7
The Impact of NAFTA on Foreign Investment in Third Countries
269
7.1 Introduction
Chapter 4 examined the effects of FTAs on foreign investment in member countries, focusing on
the case of Mexico under NAFTA. As discussed in that chapter, an FTA may both raise the profitability
and reduce the risk from investing in FTA member countries, prompting an increase in their investment
inflows. Some evidence of this effect was found in the case of Mexico.
However, this also means that, other things equal, an FTA makes nonmember countries relatively
less attractive investment destinations. From the perspective of international investors, this may prompt a
portfolio reallocation away from these countries and thus a significant change in the allocation of
investment across countries—an ‘investment diversion’ effect analogous to the trade diversion effect
analyzed in Chapter 6.
283
Has the rise in FDI to Mexico implied a reduction in FDI to other Latin American countries? If
so, which countries and why? And what can they do to remedy this situation? While the investment
creation effect of FTAs has attracted increased attention in recent years, few studies have examined the
impact on investment flows to nonmember countries. On a priori grounds, the redirection of FDI inflows
is likely to be more marked for those host countries most ‘similar’ to (i.e., closer substitutes for) the FTA
members in terms of location, endowments and overall investment environment. Thus, like with trade
diversion, in the case of NAFTA the neighboring countries of Central America and the Caribbean would
be among the prime candidates for investment diversion, since from the location perspective they are
relatively close substitutes for Mexico as FDI destinations.
284
Like with FDI to FTA member countries, the impact on FDI to nonmembers depends also to a
large extent on whether investment flows are horizontally or vertically motivated. As explained in
Chapter 4, horizontal FDI is aimed at serving the local market of the host country, and is usually
motivated by trade costs such as transportation and tariffs. Vertical FDI is typically aimed at exporting the
production to third countries or back to the source country, and aims to exploit a cost advantage of the
host country. Obviously, many intermediate forms of FDI are possible.
If FDI into nonmember countries is mainly horizontal, it is unlikely to be strongly affected by the
creation or enlargement of an FTA.
285
If FDI is vertically motivated instead, then flows to host countries
excluded from the FTA are likely to decline as source countries substitute investment within the FTA for
investment outside it. This applies to all investors, both from within and outside the FTA, who export
back from their host to the FTA, since now it will be cheaper to do so from member countries than from
nonmember countries.
While foreign investment into industrial countries is primarily of the horizontal variety, in
developing countries vertical investments account for a significant share of FDI.
286
Historically, both
forms of FDI have been present in Central and South America. The early waves of FDI were directed to
the most traditional sectors of the region (agricultural and mineral goods), which constituted the main
exports of the host countries. Copper, bananas, oil, etc. were originally produced across Latin America by
283
The concepts of foreign investment creation and diversion in the context of trade integration date back to
Kindleberger (1966).
284
See Leamer et al (1995) for an
ex-ante
assessment of the potential effects of NAFTA on investment in Central
America, including an evaluation of the location similarities between Mexico and Central America.
285
If the FTA does have an impact, it is likely to be negative, as the relative size of the local market of nonmember
countries decreases vis-à-vis the now enlarged local market of the FTA.
286
See Shatz and Venables (2001).
270
foreign companies. During the import substitution era, Central and South America significantly raised
tariffs, which attracted significant flows of horizontal FDI.
287
In recent years, however, much of the FDI flowing to Central America and the Caribbean has
been of a vertical nature. During the 1980s, the debt crisis, along with political instability in Nicaragua
and El Salvador, practically shut down the Central American Common Market. In response, most
countries in the area adopted a strategy of promotion of exports to alternative markets, first with direct
fiscal subsidies and later with tax exemptions in the framework of the Export Processing Zones (EPZs)
already discussed in the previous chapter. These incentives, which spread across the region, exempt
domestic and foreign producers from import, export and income taxes, and typically require that most of
the production be targeted to exports.
As a result of those incentives, much of FDI in Central America, aside from FDI in tourism and
the privatizations recently observed in some countries (Guatemala, Panama and El Salvador) is closely
linked to the EPZs. These flows are vertically motivated and, therefore, highly sensitive to relative cost
considerations. This is so particularly in the case of textiles and apparel, which use easily-movable
equipment and, as noted in Chapter 6, constitute a major fraction of the region’s exports to NAFTA
countries. As already noted in Chapter 6, in these sectors NAFTA introduced, at least temporarily, a
preference advantage for Mexico over the excluded Central American and Caribbean countries, which
might have encouraged redirection of their FDI inflows towards Mexico in the years following the FTA
implementation.
288
In contrast, FDI flows to South America appear less closely linked to exports. The average market
size of host countries in South America is considerably larger than that of Central American countries,
which provides a strong incentive to horizontal FDI. Moreover, during the 1990s most South American
economies, especially Argentina and Brazil, received considerable FDI inflows from privatization of
public utilities and concessions of public works. These flows should be relatively insensitive to whatever
free trade agreements exist in the region, as they target the local market for non-traded goods.
289
Thus, on
a priori grounds, if NAFTA did have an effect on FDI flows to excluded countries, its magnitude should
have been smaller for South America than for NAFTA’s Central American neighbors.
290
However, as already noted in Chapter 6, FTAs are only a subset of the broad array of
determinants of FDI inflows identified in the analytical and empirical literature. Much, or indeed most, of
the variation in FDI inflows across countries can be explained quite apart from their preferential trading
arrangements.
291
Thus, the above discussion of FDI creation and diversion has to be put in context. The
FDI impact of an FTA may be dwarfed by the effects of changes in other FDI fundamentals.
287
During this period, major multinational companies (e.g., Firestone, Pfizer, Colgate, Sherwin Williams and many
others) established production plants in Central America. Automakers established production units in Brazil,
Argentina, and Mexico. Tariff jumping was one of the major motivations for those investments.
288
The analytical underpinnings of this FDI redirection are examined by Elkholm, Forslid and Markusen (2003).
289
Strictly speaking, FTAs could have an indirect effect on this kind of FDI as well, if they affect the growth
prospects of the host country and thereby the anticipated profitability of the privatized firm and bidders’ willingness
to pay for it.
290
This hypothesis is consistent with the empirical evidence presented by Hanson, Mataloni and Slaughter (2001),
who find that vertical FDI is encouraged by low host-country trade barriers and discouraged by large host-country
market size.
291
Of course, FTA membership may have an impact on other ‘deep’ determinants of FDI flows, such as trade
openness, and hence affect FDI indirectly through channels other than the ‘credibility’ effect discussed earlier.
271
This chapter assesses the impact of NAFTA on FDI flows to nonmember countries.
292
We first
review the changing trends in FDI flows across Latin America and the Caribbean before and after
NAFTA. Because FDI displays a generalized upward trend in most countries, in Section 3 we then
examine in more detail the relative post-NAFTA performance of each host country—relative to the other
hosts and to its own history as FDI destination—paying particular attention to the neighboring countries
of Central America and the Caribbean. Section 4 takes a broader view of FDI determinants to Latin
America beyond NAFTA, and reviews their evolution in the countries under analysis. Section 5 provides
some concluding remarks and policy lessons.
7.2 Trends in FDI to Latin America and the Caribbean before and after NAFTA
The first step to assess the impact of NAFTA on FDI to nonmember countries is to examine their
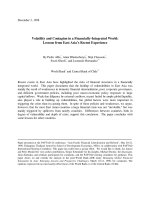
FDI performance relative to Mexico’s. Figure 1 offers a comparative perspective on net FDI inflows to
Mexico, Central America and the Caribbean, and South America since 1980. Here and in the rest of the
chapter, we consider six major Central American and Caribbean countries—Costa Rica, El Salvador,
Guatemala, Honduras, the Dominican Republic and Jamaica
293
—and nine South American economies—
Argentina, Bolivia, Brazil, Chile, Colombia, Ecuador, Paraguay, Peru and Venezuela.
The upward trend in FDI relative to GDP since the early 1990s is clearly apparent in the figure.
Closer inspection reveals three distinct stages. First, until 1993 there was little difference in FDI
performance across the three host regions in the graph. Annual flows to each one of them hovered around
1-2 percent of the respective GDP. Up to that year, South America consistently received lower flows than
the rest, while Central America became the top FDI destination since 1987. Second, in 1994 FDI to
Mexico shows a steep increase, coinciding with the inception of
NAFTA. As a result, Mexico became the leading FDI host over 1994-96. Third, after 1997 FDI
flows to Central and South America catch up with, and even exceed, flows to Mexico.
294
The individual country performances underlying Figure 1 are summarized in Table 1, which
presents two alternative measures of FDI: per capita inflows in 1995 U.S. dollars and the ratio of inflows
to current GDP. The former measure is shown because, unlike the latter, it is unaffected by gyrations in
real exchange rates (such as the devaluation of the Mexican peso during the Tequila crisis), and therefore
it may offer a superior yardstick when assessing changes in FDI performance over short time periods. In
contrast, the latter measure provides a more accurate picture of the economic dimension of FDI,
especially over longer periods of time. The table shows the mean and standard deviation of FDI from U.S.
and non-U.S. sources to the countries under analysis for the years 1980-1993 (before NAFTA) and 1994-
2001 (after NAFTA).
295
292
Much of the material in this chapter is based on the background paper by Monge (2002).
293
We exclude Panama from the sample, because its FDI inflows are very large and extremely erratic, likely
reflecting its role as an international financial center; and Nicaragua, due to the unavailability of data for much of
the period under analysis. Data on net FDI inflows were obtained from the World Bank World Development
Indicators and UNCTAD’s World Investment Report.
294
The sharp rise in FDI flows to South America in 1999 shown in the graph is largely due to a surge in flows to
Argentina related to the sale of YPF. In turn, the rise in FDI flows to Central America and the Caribbean in 1998
reflects a generalized increase in inflows to all countries in the area (except for Honduras), particularly abrupt in the
case of El Salvador. Finally, the jump in FDI to Mexico in 2001 reflects the sale of Banamex, which amounted to
over 2 percent of GDP.
295
For Mexico, the breakdown of inflows into U.S. and non-U.S. sources is based on data from the Secretaría de
Economía. For the other countries, it is based on data from the U.S. Bureau of Economic Analysis, so the
comparisons have to be taken with some caution. Wile further disaggregation of inflows from non-U.S. sources
might be of interest, the necessary data are unavailable for most countries in LAC.
272
Figure 1. Net FDI inflows, percent of GDP
The figures in Table 1 confirm that, by either measure of FDI inflows, the rising trend affected
virtually all countries in Latin America and the Caribbean. The lone exception is Guatemala, whose FDI
inflows declined between the two periods shown when measured relative to GDP, and showed the
smallest increase in the table when measured in per capita terms.
Beyond the common rising trend, some interesting facts emerge from the data. First, by either
measure shown, Mexico was not the top FDI destination in Latin America during the post-NAFTA period.
Instead, countries like Chile and Argentina (as well as Bolivia, if we look at FDI ratios to GDP) were the
main recipients of FDI. Nor is Mexico the top recipient of U.S. FDI: it places behind Chile and Jamaica,
as well as Costa Rica in terms of ratio to GDP.
Second, Mexico was not either the country experiencing the largest increases in FDI inflows
between the pre-and post-NAFTA periods. Chile and Jamaica had bigger rises in FDI by both measures
shown in the table, and other countries also outperformed Mexico in terms of rises in FDI per capita (e.g.,
Venezuela) or in terms or FDI relative to GDP (e.g., Costa Rica and Bolivia). Central America and the
Caribbean combined experienced an increase in FDI relative to GDP very similar to that of Mexico—
from an average of 1.1 percent of GDP in 1980-93 to an average of 3.0 percent of GDP in 1994-2001. In
Mexico, the rise was from 1.2 to 3.0 percent of GDP.
Third, both U.S. and non-U.S.-based investors have increased their flows to the region. In a
number of major countries—including Argentina, Brazil and Chile—investment from the latter sources
rose faster than U.S. investment. In terms of region-wide averages, non U.S.-based investment exceeded
its U.S. counterpart over both periods shown, and across periods the rise in the former exceeded the rise
in the latter. Within Central America there was considerable diversity in the relative performance of FDI
flows from U.S. and non U.S. sources. Costa Rica and Jamaica saw a substantial expansion of the former,
while Honduras and the Dominican Republic experienced a significant increase in the latter.
0%
1%
2%
3%
4%
5%
6%
7%
19
80
19
81
19
82
19
83
19
84
19
85
19
86
19
87
19
88
19
89
19
90
19
91
19
92
19
93
19
94
19
95
19
96
19
97
19
98
19
99
20
00
20
01
Mexico
Central America and Caribbean South America
273
Table 1(a). Net FDI inflows per person in host country, by period and source
(in 1995 U.S. dollars)
Country
Statistic
U.S. Non.U.S. Total U.S. Non.U.S.
Total
Mexico
Mean
19.52 13.89 33.41 67.67 71.95
139.61
St. Dev.
10.07 13.16 12.20 46.78 12.42
47.04
Costa Rica
Mean
1.08 36.10 37.18 54.17 68.18
122.35
St. Dev.
18.81 31.05 19.48 94.18 105.51
29.31
Guatemala
Mean
-0.04 12.95 12.91 2.25 18.39
20.65
St. Dev.
3.51 8.81 8.88 14.85 25.43
20.05
Honduras
Mean
1.69 4.86 6.55 1.14 21.27
22.41
St. Dev.
12.09 13.52 3.53 14.90 16.89
13.54
El Salvador
Mean
0.66 1.99 2.65 10.39 27.57
37.96
St. Dev.
2.23 3.09 2.03 19.86 46.46
60.72
Central America
Mean
4.58 13.96 18.54 27.12 41.47
68.59
Dominican Republic
Mean
7.97 5.42 13.95 9.64 63.05
81.22
St. Dev.
10.87 8.36 7.23 8.30 50.05
54.05
Jamaica
Mean
23.79 -6.98 16.81 74.17 57.99
132.16
St. Dev.
54.61 39.26 25.14 45.52 109.76
79.80
C A & Caribbean
Mean
7.81 9.84 17.64 31.74 46.62
79.48
Argentina
Mean
8.94 29.55 38.49 31.91 212.68
244.60
St. Dev.
9.89 31.95 36.76 25.35 171.02
182.30
Bolivia
Mean
2.82 5.38 8.20 4.87 73.57
78.44
St. Dev.
5.98 8.73 8.53 20.21 40.94
34.55
Brazil
Mean
7.99 4.01 12.00 24.91 88.26
113.17
St. Dev.
7.15 9.18 5.87 14.15 72.58
66.59
Chile
Mean
14.03 32.23 46.27 82.56 242.09
324.65
St. Dev.
16.81 24.83 29.62 62.59 166.02
134.22
Colombia
Mean
0.39 15.67 16.06 7.52 53.87
61.39
St. Dev.
11.65 13.16 7.62 8.31 34.37
36.75
Ecuador
Mean
2.83 9.97 12.80 1.50 56.82
58.32
St. Dev.
8.74 8.72 9.61 16.81 28.15
20.54
Peru
Mean
-0.07 3.91 3.85 13.74 69.01
82.76
St. Dev.
6.85 9.62 8.09 11.82 32.77
38.53
Paraguay
Mean
0.45 8.25 8.70 8.69 22.32
31.01
St. Dev.
2.17 8.21 8.63 12.03 21.36
16.91
Venezuela
Mean
11.68 4.59 16.26 52.98 81.93
134.91
St. Dev.
23.64 17.88 24.66 43.76 76.63
72.16
All
Mean
6.47 11.42 17.88 28.15 76.92
105.35
Source: Data from the World Bank, the Bureau of Economic Analysis, and Secretaría de
Economía: Dirección General de Inversión Extranjera.
1980-1993 1994-2001
274
Table 1(b). Net FDI inflows as percentage of GDP, by period and source
Fourth, there is nevertheless considerable heterogeneity across host countries in terms of the level
and growth of total FDI. Within Central America, growth was spectacular in Costa Rica, but modest in
Honduras and El Salvador and, especially, in Guatemala. The two Caribbean countries shown also had
large increases in FDI inflows.
Country
Statistic
U.S. Non.U.S. Total U.S. Non.U.S.
Total
Mexico
Mean
0.71 0.46 1.17 1.39 1.60
2.99
St. Dev.
0.42 0.53 0.22 0.65 0.34
0.50
Costa Rica
Mean
0.06 1.96 2.03 1.57 1.69
3.26
St. Dev.
1.00 1.34 0.61 2.38 2.46
0.63
Guatemala
Mean
0.00 1.22 1.21 0.15 1.06
1.21
St. Dev.
0.31 0.96 0.97 0.85 1.42
1.09
Honduras
Mean
0.22 0.65 0.88 0.18 2.46
2.64
St. Dev.
1.52 1.75 0.51 1.67 1.71
1.36
El Salvador
Mean
0.06 0.25 0.31 0.54 1.35
1.89
St. Dev.
0.26 0.37 0.26 0.99 2.33
3.05
Central America
Mean
0.21 0.91 1.12 0.77 1.63
2.40
Dominican Republic
Mean
0.64 0.58 1.30 0.48 3.23
3.95
St. Dev.
0.97 0.93 0.66 0.37 2.24
2.20
Jamaica
Mean
1.15 -0.11 1.04 2.92 1.91
4.83
St. Dev.
3.69 2.83 1.57 1.76 3.87
2.49
C A & Caribbean
Mean
0.40 0.72 1.13 1.04 1.87
2.97
Argentina
Mean
0.22 0.66 0.87 0.41 2.74
3.15
St. Dev.
0.24 0.53 0.55 0.33 2.20
2.34
Bolivia
Mean
0.47 0.87 1.34 0.51 7.40
7.91
St. Dev.
0.89 1.39 1.49 2.02 3.83
3.13
Brazil
Mean
0.32 0.25 0.57 0.59 2.43
3.02
St. Dev.
0.26 0.43 0.31 0.30 2.18
2.03
Chile
Mean
0.62 1.48 2.10 1.92 5.23
7.14
St. Dev.
0.78 1.13 1.37 1.58 3.59
2.92
Colombia
Mean
0.00 1.32 1.32 0.34 2.31
2.65
St. Dev.
0.98 1.15 0.64 0.38 1.23
1.29
Ecuador
Mean
0.22 0.84 1.06 0.02 3.98
4.01
St. Dev.
0.68 0.79 0.80 1.21 2.36
1.65
Peru
Mean
-0.07 0.35 0.27 0.63 3.18
3.81
St. Dev.
0.58 0.70 0.54 0.55 1.62
1.87
Paraguay
Mean
0.04 0.57 0.61 0.58 1.31
1.89
St. Dev.
0.15 0.59 0.60 0.88 1.36
0.97
Venezuela
Mean
0.39 0.16 0.55 1.29 2.00
3.29
St. Dev.
0.76 0.53 0.93 0.83 1.95
1.64
All
Mean
0.31 0.72 1.04 0.85 2.74
3.60
Source: Data from the World Bank, the Bureau of Economic Analysis, and Secretaría de
Economía: Dirección General de Inversión Extranjera.
1980-1993 1994-2001
275
Fifth, heterogeneity also extends to the volatility of FDI. Measured by the coefficient of variation
of per capita inflows, volatility declined in some countries (e.g., Costa Rica, Jamaica, Ecuador) and
increased for others (Guatemala and El Salvador).
In sum, while FDI inflows to most Latin American economies show a common upward trend,
there is also a considerable degree of cross-country diversity. Even within Central America, some
countries have attracted much more FDI than others. But a preliminary inspection of observed FDI trends
does not provide much evidence of a generally negative change after NAFTA in FDI inflows to the
neighboring countries of Central America and the Caribbean. Of course, a more rigorous analysis might
find otherwise, and is developed below in two stages. First, we examine in detail the trends in FDI to
Mexico and other countries looking for significant divergences between them. Second, we assess the
ability of standard FDI determinants to account for the observed pattern of FDI allocation across Latin
American countries in the pre- and post-NAFTA periods.
7.3 Assessing FDI diversion from NAFTA
7.3.1 Background
There are no formal studies of the impact of NAFTA on FDI flows to nonmember countries, and
few assessments of the effects of other RIAs on the international allocation of FDI flows. This stands in
sharp contrast with the growing empirical literature assessing the effects of RIAs on FDI flows to member
countries.
The case of the EEC / EU has attracted a few empirical studies focusing specifically on
investment diversion at various stages of the FTA—from its creation to the accession of Iberian countries
in 1985, the Single Common Market of 1992 and the upcoming expansion of the EU to Eastern European
countries (see Box 1 for a selective summary). On the whole, they do not find compelling evidence of
investment diversion.
In a multi-RIA framework, a recent empirical study (Levy-Yeyati, Stein and Daude 2002) finds
that RIAs divert investment originating in member countries away from non-member hosts. Importantly,
the possible diversion of FDI flows from nonmember source countries is not taken into account. This is a
potential issue because, as Table 1 showed, non-U.S. sources account for the majority of FDI across Latin
America, as well as for the majority of the increase in investment flows in recent years.
296
Another caveat
is that NAFTA is the only North-South trade agreement in the study and, unlike the framework in Chapter
6 above, which allows each FTA to be different, the basic framework of the study in question forces all
FTAs to have the same effects on FDI allocation. Yet there is some evidence suggesting that the
investment impact of FTAs may be different depending on whether they involve only North countries,
South countries or both.
297
In the analysis of the impact of FTAs on FDI in Chapter 4 we attempted to identify the diversion
of investment flows from both member and nonmember source countries, but found no significant effects.
Like the preceding study, however, the implicit assumption was that NAFTA is not different from other
RIAs. Also, both approaches share another restrictive feature, namely the simplifying assumption that
RIA-induced FDI diversion effects must be the same for all non-member countries. As already argued,
analytical considerations strongly suggest that FDI diversion should be more substantial for nonmember
296
In spite of neglecting this channel, the study’s estimated diversion effect is extremely large: entry by a source
country into an FTA would reduce its stock of FDI to nonmember countries by about 27 percent.
297
See Blomstrom and Kokko (1997). Indeed, experiments reported in the paper by Levy-Yeyati, Stein and Daude
(2002) do suggest that NAFTA may be different from the other FTAs in terms of its FDI impact.
276
host countries that are closer substitutes for hosts belonging to the RIA under consideration. Admittedly,
however, it is not easy to build an empirical framework allowing for varying degrees of substitutability
among FDI hosts.
In view of these considerations, the analysis below follows a two-stage approach. The objective is
to assess if flows to LAC countries excluded from NAFTA, and especially Central America and the
Caribbean, show a different behavior than flows to Mexico before and after implementation of the FTA.
To do this, we first examine carefully the observed trends in FDI across the region. As shown in the
previous section, most countries in the region experienced large increases in FDI inflows in the second
part of the 1990s. Thus, we use a simple descriptive procedure to isolate any differential behavior of
nonmember countries vis-à-vis Mexico across the pre- and post-NAFTA periods. The second stage of the
analysis, presented in the next section, goes one step beyond to explore the role of fundamental FDI
determinants in the performance of FDI flows across the region, to assess the extent to which they can
account for the changing foreign investment patterns across countries and over time.
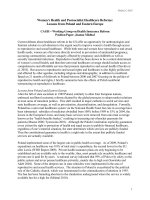
Box 1. FDI diversion in Europe
The creation of the European Economic Community (1952); the EU accession of Spain and Portugal (agreed in 1986 and
fully implemented in 1992); the creation of the Single Market (1992) and the ongoing EU eastern enlargement offer some
insights on the changing pattern of FDI across Europe caused by economic integration. While there is evidence that European
integration led to substantial investment creation for EU member countries, particularly in the late 1980s (see Chapter IV),
empirical evidence of investment diversion away from non EU-member countries is limited. However, the empirical evidence is
less than conclusive. First, the surge of FDI in Europe coincided with a worldwide increase in FDI flows, making it hard to
disentangle the impact of global trends from that of European integration. Second, as Brenton et al. (1999) point out, the available
theory on FDI does not provide clear testable propositions on the effect of simultaneous trade and investment liberalization.
EEC creation
Earlier studies of FDI patterns focused more on the determinants of FDI to Europe than on potential FDI diversion effects
(Aristotelous and Fountas 1996). An exception is Scarperlanda (1967), who tests for a change in international investment patterns
following the creation of the European Common market, and finds no evidence of any shift in U.S. investment into the EU and
away from non-EU nations.
Single Market and EU accession of Spain and Portugal
Baldwin et al. (1995) suggest that the creation of the Single Market in the EU “probably led to investment diversion in the
economies of the European Free Trade Association (EFTA) and investment creation in the EU economies”—in particular Spain
and Portugal. Some EFTA firms reportedly adjusted by becoming EU-based firms, which resulted in an outflow of FDI from
EFTA countries to EU countries (Oxelheim 1994). However, Brenton et al. (1999), using a gravity model of FDI flows, find no
evidence that increased investment in Spain and Portugal during the 1980s came at the expense of reduced investment flows to
other European countries (see also Box Figure 1). In the same vein, Agarwal (1996) documents that growth rates of FDI inflows
to Iberian countries and the rest of the EU during 1986-90 were comparable to observed levels in 1980-95, and concludes that it
is much more likely that Spain and Portugal benefited from the creation of additional FDI resulting from strong economic growth
in the EU rather than from an investment diversion effect away from non-EU countries.
EU Eastern enlargement
Central and Eastern European economies (CEECs) have become an increasingly important destination for FDI in recent
years, raising the concern than investment previously destined to the relatively cheap labor markets of Southern Europe may have
been diverted to Central and Eastern Europe as the preferential status of Iberian countries is diluted (Box Figure 2). However,
existing empirical studies do not find clear evidence in favor of this view (e.g., Brenton et al 1999). In fact, the stagnation or
decline in FDI to Spain and Portugal in the late 1990s could just reflect the fact that FDI stocks into these countries have reached
the equilibrium level (Buch et al. 2001). Moreover, their FDI may be largely location-specific and thus unlikely to be strongly
affected by Eastern enlargement (Martin and Gual 1994). The same argument has been offered to support the view that Eastern
enlargement should have minimal effects on FDI to other developing regions.
298
Furthermore, the expected positive impact on
growth in Eastern Europe due to economic transformation and integration is likely to eventually translate into higher demand for
products from developing countries, leading to an increase in FDI in these countries and overall investment creation (Agarwal
1996).
298
The potential for FDI diversion is greatest in footloose labor and pollution intensive segments of international
production, which is internationally mobile, however this part of FDI is generally considered to be relatively small.
277
Box 1 (continued)
Box Figure 1
FDI inflows to Spain and Portugal from EU sources
and total FDI outflows from the EU (excluding Spain and Portugal)
Note: figures in US$ million.
Source: OECD
Box Figure 2
Share of World FDI inflows by host region
Source: UNCTAD
0
2000
4000
6000
8000
10000
12000
14000
1980 1981 1982 1983 1984 1985 1986 1987 1988 1989 1990 1991 1992 1993 1994 1995 1996 1997 1998
Spain and Portugal
0
100000
200000
300000
400000
500000
600000
EU
Spain and Protugal inflows from EU TOTAL outflows EU to world exclusive of Spain and Portugal
Accession Agreement for
Spain and Portugal
Single Market Program
0
10
20
30
40
50
60
70
80
90
100
1970 1975 1980 1985 1990 1995 2000
in percent
Developed countries minus EU EU minus Spain and Portugal Portugal and Spain Developing countries Central and Eastern Europe
278
7.3.2 Disentangling common and country-specific FDI trends before and after NAFTA
To disentangle country-specific FDI trends from common ones, we decompose observed FDI
flows from source country i to host country j in year t as follows:
FDI(i,j,t) = source fixed effect (i) + source/host pair fixed effect (i,j)
+ common time effect (t) + source time effect (i,t) + host time effect (j,t)
+ residual
Such decomposition can be computed from a panel regression of FDI on sets of dummy variables,
with each set defined so as to capture one of the components listed above. To identify the parameters of
such regression, the conventional practice is to select a “base” country and year, dropping the
corresponding dummies, in which case the coefficients on the remaining dummies can be interpreted as
deviations from the omitted category. Therefore, they depend on the particular base chosen. Further, the
sets of dummies normalized in this manner are not mutually orthogonal, and hence they cannot be strictly
identified with the components in the above expression. For these reasons, it is more convenient to
normalize the sets of dummies by expressing each one in terms of deviations from their respective means
(see Box 2).
The decomposition can be implemented through a simple panel regression of FDI inflows
including as explanatory variables several full sets of dummies, with each set capturing one of the
components above, and with the coefficients on each set of dummies constrained to add up to zero. In this
way, for example, the (normalized) common year effect estimates then capture annual deviations from the
average flow of FDI during the sample period. This poses a restricted least squares problem in which
inference can be performed along the lines of Greene (1991).
Of particular interest in this context are the source/host fixed effects and the host time effects. The
former measure the difference between the average annual FDI flow received by a given host from a
given source relative to the average flow from the same host to the average country in the sample. This
can be viewed as reflecting the relative geographic, historical and political proximity of each host country
to the source country under consideration.
299
In turn, the host time effects represent for each host the deviation of its FDI inflow in each year
from the common trend (i.e., the cross-country average for the year), as well as the deviation from the
host country’s typical performance (i.e., the average annual inflow it received over the sample). In effect,
this removes from the host’s annual inflow both the common trend and the unobservable factors that may
make that host systematically more or less appealing than others to foreign investors.
To examine if under NAFTA Mexico has outperformed the other countries in the region, one can
just compare the estimated host year effects for Mexico with those of other excluded countries. If NAFTA
has implied a relevant advantage for Mexico, we must find that its time effects are negative prior to
NAFTA and positive afterwards. Furthermore, the pattern of these time effects tells us whether such
advantage narrows or widens over time. Likewise, the sum over the post-NAFTA years of the time effects
299
Note that this represents a more general way of controlling for distance and other time-invariant characteristics of
countries than the parametric measures commonly employed in gravity models. Indeed, in our context finding
informative measures of closeness for Central American countries could be problematic given their geographic
proximity and small size.
279
Box 2. Disentangling common and idiosyncratic FDI trends
Assume we have observations on FDI flows from i=1,2,…,I source countries to a sample of n=1,2,…,N host countries over
periods t=1,…,T. Let f(i,n,t) denote FDI flows from country i to country n in year t. We can decompose f(i,n,t) into:
f(i,n,t)=h(i)+b(t)+m(i,n)+f(i,t)+g(n,t)+u(i,n,t)
here h(i) is a fixed source country effect, b(t) is a year effect that affects all source and host countries, m(i,n) is a fixed
source/host country effect, f(i,t) is a fixed effect specific to source country i, g(n,t) is a year effect specific to a host country n.
The term u(i,n,t) is simply the residual of the series once these effects have been accounted for.
This model is still unidentified, and the conventional solution is to use a country/year as the base. The main problem with
this strategy is that then the right-hand side variables are not mutually orthogonal. Moreover, the numerical results depend on the
choice of base country/year. It is therefore preferable to use a different set of identification assumptions, namely expressing the
various effects as deviations from their respective means. This amounts to imposing the six conditions
TttngNntngIitif
TttifTttbIinim
N
n
T
t
T
t
I
i
T
t
N
n
,...,1,0),(;,...,1,0),(;,...,1,0),(
,...,1,0),(;,...,1,0)(;,...,1,0),(
111
111
======
======
∑∑∑
∑∑∑
===
===
These conditions make the right hand-side variables in the above equation mutually orthogonal. It is convenient to discuss
their interpretation further. First, h(i) indicates the relative importance of source country i for the average host country in the
sample during the sample period. For example, these estimates can be useful to assess the relevance of the U.S. economy as a
source of FDI to the region. In turn, the estimates of m(i,n) represent the permanent deviation of country n with respect to the
flows of FDI from country i to the average country in the group. This controls for permanent differences across countries, and
can capture the effect of geographic, historical and political proximity of each of the n countries to the particular source country
i.
300
The second condition redefines the year effects b(t) as deviations from the average flow of FDI to the average country in the
group during the sample period. This normalization plays an important role below, as FDI shows a rising trend in most countries.
By including these year effects, we are able to separate the common factors behind the generalized increase in FDI flows to all
the host countries in the region from those specific factors that favored a subset of countries with respect to others, which is our
main interest.
The third and fourth equations normalize the source/year effects f(i,t) in such a way that for each year they represent
deviations across source countries with respect to the mean time effect (b(t)), and for each source country represent year
deviations from its average h(i). Finally, the fifth and sixth equations have a very similar interpretation. Thus, g(n,t) are host
country year effects that represent, for each year t, the deviation of host country n with respect to the mean year effect (b(t)). For
each host country n, they represent year deviations from its average flow.
This simple statistical decomposition can be very useful to ascertain which countries have done best / worst under NAFTA.
Specifically, to examine if under NAFTA Mexico has outperformed the other countries in the region, we can compare the
estimated year effects for Mexico g(Mexico,t) with those of other countries g(excluded,t). These host/year effects indicate
positive or negative deviations of the respective host country with respect to the rest of the group in the year in question, as well
as deviations of the host country with respect to its average over time. If NAFTA has implied a relative advantage for Mexico, its
time effects should be negative prior to NAFTA and positive afterwards. Furthermore, the pattern of these time effects tells us
whether such advantage narrows or widens over time. Likewise, the sum over time of the year effects of a given host provides an
indication of the cumulative post-NAFTA performance of FDI flows to that host. For example, for Mexico we would compute
∑
≥1994
),(
t
tMexicog
of a given host provides an indication of the cumulative post-NAFTA performance of FDI flows to that
host, which can help detect stock adjustments triggered by NAFTA.
301
Finally, the estimated host/year effects of the excluded countries, especially in Central America,
are also of direct interest. They provide a measure of how much each respective country deviated from the
300
Note that this represents a more general way of controlling for distance and other time-invariant characteristics of
countries than the parametric measures commonly employed in gravity models. Indeed, in our context finding
informative measures of closeness for Central American countries could be problematic given their geographic
proximity and small size.
301
Even if the effects of NAFTA on FDI flows to Mexico were purely transitory, they might amount to a permanent
change in the stock of FDI to Mexico. The cumulative sum in the text helps assess this possibility.
280
average FDI performance of the overall sample in the year in question, as well as how much the year in
question deviated from the average FDI performance of the country under consideration. If FDI to
excluded countries was diverted by NAFTA, they should show negative host/year effects after 1993.
7.3.3 Empirical results
This framework is used to compare Mexico with two different groups of countries. The first
group includes only the Central American and Caribbean countries listed earlier. The second group adds
the main South American economies. As before, the exercise is performed for two different measures of
FDI: annual net inflows of FDI in 1995 U.S. dollars per inhabitant of the host country (FDI pc), and net
inflows of FDI relative to the GDP of the host economy (FDI/GDP).
302
Table 2 reports the estimated fixed effects for source countries and source-host country pairs for
both country groups and both measures of FDI. There are several salient results in the table. The first
concerns the relative importance of U.S. and non-U.S. FDI sources. For the sample considered here, the
latter are on average more important than the former. Second, U.S.-based investors play a more prominent
role in Central America than in South America. Finally, there is a large degree of heterogeneity across
countries, even within Central and South American groups. We next discuss each of these points in more
detail.
The estimated source country fixed effects at the top of the table show that that over the sample
period as a whole the U.S. was, on average, a less important source of FDI than all other source countries
combined. The U.S. invested, on average, 15 1995 dollars per person in each country in the group studied.
This is less than half the $35 invested by all other sources combined. However, the difference narrows if
we look only at Central American and Caribbean countries, where the respective figures are 17 and 23.
The same qualitative results hold for FDI/GDP ratios from U.S. and other sources.
There is a great degree of heterogeneity across host countries, not only in terms of their total
attraction of FDI but also in terms of the importance of the two sources. This is captured by the U.S. / host
country and non-U.S./host country pair effects reported in the table. All these effects must add up to zero,
and indicate how the host countries are ranked in terms of attracting FDI from each source. For example,
Jamaica and Chile receive much more FDI from the U.S. than the other countries—specifically, $ 30 and
$ 20 more per capita (in 1995 dollars) than the average of all Latin American countries. Mexico lags
Jamaica and is on par with Chile in terms of U.S. inflows. In contrast, Guatemala, Paraguay and
Colombia received around $12-13 less per capita than the average. Finally, countries receiving above-
average FDI from the U.S. also receive more often than not above-average FDI from other sources—i.e.,
the two source/host effects of each host tend to have the same sign. There are exceptions, however, such
as Jamaica, which is well above the average for U.S. investors but well below the average for the rest.
These fixed effects reflect each country’s average FDI patterns over the whole sample period both
before and after NAFTA. To assess the changes in FDI trends over time for the various host countries in
LAC, we can inspect the estimated host/year specific effects, which capture the extent to which each host
deviates from its average behavior, and from the average behavior of the sample as a whole, in a given
year. Thus, to see if Mexico behaves differently from the rest of the sample in the post-NAFTA period it is
sufficient to inspect the estimated host/year effects of Mexico. They are shown in Table 3, for both
country groups and both measures of FDI.
302
The analysis was also performed measuring FDI by its ratio to fixed investment of the host country. The results
were generally analogous to those obtained with FDI/GDP and thus are not reported.