The role of economic structural factors in determining pandemic mortality rates evidence from the COVID 19 outbreak in france
Bạn đang xem bản rút gọn của tài liệu. Xem và tải ngay bản đầy đủ của tài liệu tại đây (1.43 MB, 14 trang )
Journal Pre-proof
The role of economic structural factors in determining pandemic mortality
rates: Evidence from the COVID-19 outbreak in France
´
´
Stephane
Goutte, Thomas Peran,
Thomas Porcher
PII:
S0275-5319(20)30475-X
DOI:
/>
Reference:
RIBAF 101281
To appear in:
Research in International Business and Finance
Received Date:
19 May 2020
Revised Date:
10 June 2020
Accepted Date:
12 June 2020
´
´
Please cite this article as: Stephane
Goutte, Thomas Peran,
Thomas Porcher, The role of
economic structural factors in determining pandemic mortality rates: Evidence from the
COVID-19 outbreak in France, <![CDATA[Research in International Business and Finance]]>
(2020), doi: />
This is a PDF file of an article that has undergone enhancements after acceptance, such as
the addition of a cover page and metadata, and formatting for readability, but it is not yet the
definitive version of record. This version will undergo additional copyediting, typesetting and
review before it is published in its final form, but we are providing this version to give early
visibility of the article. Please note that, during the production process, errors may be
discovered which could affect the content, and all legal disclaimers that apply to the journal
pertain.
© 2020 Published by Elsevier.
The role of economic structural factors in determining
pandemic mortality rates: Evidence from the COVID-19
outbreak in France
immediate
June 10, 2020
ro
of
Abstract
-p
Among the majority of research on individual factors leading to coronavirus mortality, age has
been identified as a dominant factor. Health and other individual factors including gender,
comorbidity, ethnicity and obesity have also been identified by other studies. In contrast, we
examine the role of economic structural factors on COVID-19 mortality rates. Particularly,
focusing on a densely populated region of France, we document evidence that higher economic
“precariousness indicators” such as unemployment and poverty rates, lack of formal education
and housing are important factors in determining COVID-19 mortality rates. Our study will
help inform policy makers regarding the role of economic factors in managing pandemics.
Jo
ur
na
lP
re
Keywords: Pandemic; COVID-19; Social distancing; Health system; Territorial vulnerabilities;
Poverty; Housing
JEL classification: I14; I18; J14; H12; R11
1
1
Introduction
ro
of
The Director General of the World Health Organization (WHO) declared the COVID-19 epidemic as a pandemic on the 11th of March 2020. By this period, more than 110 countries were
already heavily affected worldwide, with approximately 120,000 confirmed cases of the coronavirus
disease (WHO, 2020a). In what follows, researchers from around the World devoted their work to
the study of this new virus, by mainly using three different approaches. First, a race against the
clock was launched by epidemiologists to find a vaccine (Shoenfeld, 2020; Cohen, 2020; Thanh,
Andreadakis et al., 2020) and reach in the earliest possible delay a satisfactory level of collective
immunity (Altmann, Douek and Boyton, 2020). Second, the medical profession devoted itself to
studying the effects of the virus on the health of individuals. Lastly, the majority of researchers
has attempted to identify the most effective ways to staunch this global scourge. In particular,
the last group of studies aim to explore the factors behind the transmission of the coronavirus (see
e.g. Li, Xu et al., 2020) and the worsening of the health situation (see e.g. Di Lorenzo and Di
Trolio, 2020). Corresponding to this group of studies, this current study, also explores the extent
of the economic consequences that the health crisis has inevitably caused (McKee and Stuckler,
2020; Yue, Shao et al., 2020).
re
-p
The first group of studies reveals fundamental elements in understanding the COVID-19 phenomenon. These studies have demonstrated that the pandemic first started in the Chinese city of
Wuhan in Hubei Province and that in the category of elderly individuals, the highest mortality
rate was recorded (NHS England, 2020). These findings were quickly refined to permit a precise
identification of other comorbidity factors (Bacon, Bates et al., 2020). Thus, for example, it seems
very likely that patients suffering from other pathologies such as diabetes (Klonoff and Umpierrez, 2020) or asthma (Abrams and Szefler, 2020; WHO, 2020b) are more affected than healthiest
patients, but also that the rhesus of the blood group and the ethnic origin of the patients (Mihm,
2020; NHS England, 2020; Webb Hooper, Nápoles and Pérez-Stable, 2020) could constitute a medical field fostering the mortality of the virus. In other words, a standard “robot portrait” of the
most endangered patients of the coronavirus disease was drafted.
na
lP
Furthermore, geographical studies have shown that not a single continent is sheltered1 (Hopman, Allegranzi and Mehtar, 2020; Gilbert, Pullano et al., 2020), and that the West recorded the
highest morbidity rate. The COVID-19 morbidity rate following top global ranking includes the
United States of America (≥ 79,500 deaths), United Kingdom (≥ 31,900 deaths), Italy (≥ 30,500
deaths), Spain (≥ 26 600), France (≥ 26,300)2 . To improve the understanding of the vectors of the
virus transmission as well as the morbidity factors, it seems interesting to conduct comparative
studies at the three continental, regional and State levels.
Jo
ur
However, the first observations establish that biases exist and that it therefore could be reasonable to limit comparative analyzes to territorial units with the same human and climatic characteristics (Desjardins, Hohl and Delmelle, 2020; Liu, Zhou et al., 2020). For example, it has been
observed that in Sub-Saharan Africa, the contamination and transmission rates are extremely lower
relative to countries in the North and West of the Globe (Martinez-Alvarez, Jarde et al., 2020;
Nuwagira and Muzoora, 2020). The positive effects of various factors including the protective role
of previous injections of Malaria vaccine on populations exposed to COVID-19 have been explored
(Sargin and Yavasoglu, 2020). Moreover, the global death reports indicate that the number of
national deaths appears to vary largely. Some countries report exclusively deaths in hospitals (like
France at the early stage of the pandemic) while others merge deaths in hospital, domestic and
nursing homes (like Germany). Accordingly, an international study seems to be unrealistic at the
moment.
1 It also seems that not a single country has been sheltered and that the few localities where no deaths have
been recorded have chosen not to report the cases. Refer to figures from Johns Hopkins University which are widely
accepted by the Global scientific Community. Available at: (accessed 10 May
2020).
2 Figures updated to May 11, 2020.
2
-p
ro
of
Unlike previous papers focusing on human factors, our study proposes an approach to explore
the structural factors of contamination, contagion and mortality of COVID-19. Indeed, in addition
to genetics and geography, we aim to explore new elements that may be put forward to explain
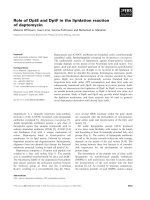
the excess mortality in certain populations. To do this, we limit our study to Ỵle-de-France. As
shown in Figure 1, the Ỵle-de-France is a French region which includes eight departments3 , which
has the unique characteristic of not constituting a cluster of contamination due to an identifiable
and outstanding event.
Figure 1: Map of Ỵle-de-France
2
na
lP
re
Indeed, certain territorial units have formed clusters of contamination largely responsible for
the degree of contamination at the National level. For example, in the French city of Mulhouse
belonging to the Grand Est region, a major gathering of faithful evangelists is considered to be
responsible for a non-negligible part of the whole excess mortality linked to COVID-19 among the
State. In addition, the Île-de-France region is highly populated with 12,174,880 million inhabitants
(19% of the whole French population) and is socially heterogeneous in terms of ethnicity, professional qualification of workers, graduate of higher education and quality of the health system etc.
However, its boarders stand inside a small geographic area with no climatic ecosystems effects.
Under these conditions, Ỵle-de-France constitutes a relevant field of study for the various structural factors other than individual ones like age or comorbidities promoting the contamination,
contagion and mortality rates of COVID-19.
Data and Approach
Jo
ur
The INSEE collects, analyses and disseminates information on the French economy and society.
We start with a large panel of 66 variables4 , which are representative of the economic, financial
or structural factors relating to housing in Ỵle-de-France and its population. Then, using the
Principal Component Analysis (PCA), we select a closer panel of 30 variables which appear to
be very significant in terms of segmentation of the departments in Ỵle-de-France, and particularly
Seine-Saint-Denis.
2.1
Principal Components Analysis
Thus, in order to characterize the best set of discriminant variables, we proceed with a principal
component analysis. This approach allows us to best capture the explanatory and segmenting power
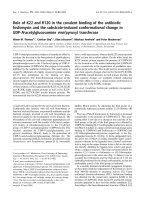
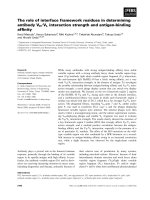
of the available variables. Figure 2 shows the best representation (projection) in two dimensions of
the 8 departments regarding the set of available variables. We see clearly that the department of
Seine-Saint-Denis is far away from the others (in the upper left position), which argues in favor of
a significant difference in terms of values of the variables from other departments in Ỵle-de-France.
3 In France, administrative levels in order of importance (ascending order) are municipalities/agglomerations (35
357 units), departments (101 units) and regions (18 units).
4 Taken from the French statistical database of The National Institute of Statistics and Economic Studies (INSEE).
3
-p
ro
of
Consequently, this proves that an examination of the specificities of these departments is useful
and relevant in understanding and explaining the reasons and factors which brought to the excess
COVID-19 mortality in Seine-Saint-Denis. More so, we can see that the most distant and therefore
different departments with respect to Seine-Saint-Denis are Paris and Hauts-de-Seine.
re
Figure 2: Projection of IDF departments on the two main PCA axis
lP
To offer a deeper analysis of this segmentation, we take a look on the weight of each variable
as represented by each of the two axis. These results are provided in Table 1. We can see that a
positive value on the first axis (i.e. horizontal) characterizes the following:
• A high share of graduates of higher education in population out of school 15 years or more
at a level of 96.50%;
na
• Average household size at a level of 95.96%;
• A high value of the aging index at a level of 93.60%;
• A high average hourly net salary at a level of 85.45%.
ur
This suggests that a department with a high coordinate in Factor 1 exhibits all these points
and that higher is its coordinate in these factors. The projection of IDF departments on these two
main PCA axis are presented in Table 2.
Jo
The departments of Paris and Hauts-de-Seine which take a high value in this axis projection are
so fundamentally and intrinsically characterized and determined by a population with a high level
of education, with a higher salary than the other departments and also an older population. This
last factor is, of course, the main reason why the mortality rates are important in both departments.
Conversely, the Seine-Saint-Denis department which takes the most negative value in this projection is largely characterized by a younger population with a lower level of education and a
medium value of salary at the end. But, as we showed previously, its mortality rate due to
COVID-19 is the highest. Furthermore, we consider the second axis (i.e. vertical) given that the
Seine-Saint-Denis appears to be also isolated from other departments in the upper region (i.e.
positive values).
Here, we can see that a positive value in this factor characterizes the following:
• A high number of main residences overcrowded at a level of 96.00%;
4
• A high share of private park accommodation potentially unworthy (PPPI) at a level of
91.44%;
• A high number of people living in an apartment as a household of at least 4 people at a level
of 88.83%;
• A high poverty rate at a level of 88.20%;
• A high value of share of unemployment benefits in the revenue available at a level of 72.74%.
Table 1: Explication weights of each variable on the two main axis factor
re
lP
na
ur
Jo
This implies that Seine-Saint-Denis is
ditions, overcrowded housing potentially
income linked to unemployment benefits.
mortality rate in the period of COVID-19
F2
0.5903711
0.2170222
0.1869943
0.002343
0.2897714
0.0040854
0.3188606
0.488439
0.7274552
0.6314759
0.6619699
0.8820404
ro
of
F1
0.381558
0.700227
0.684784
0.936031
0.697611
0.959639
0.659438
0.49332
0.24914
0.343963
0.315023
0.107143
-p
Unemployement rate
People 65y and more
People 75y and more
Aging index
Population density
Average household size
Median standard of living
Share of taxed tax households
Share of unemployment benefits in the rev. avail.
Part des prestations logement dans le rev. disp. 2016
Share of social minima in rev. avail.
Taux de pauvreté 2016
Share of pops with little or no diploma.
out of school 15 years or more
Share of graduates of higher education
in pop. out of school 15 years or more
Share of apartments in total housing
Share of houses in total housing
Share of owners of their residences
Share of HLM tenants in main residences
Share of workers in the number of jobs
Activity rate by age group
Public Service Workforce
Average hourly net salary
Share of admin positions. public, education, health
and social action in institutions. assets
General practitioner
Nurses
Pharmacy
Elderly accommodation
Nursery
Pôle emploi
Infant School
Elementary school
Middle school
High school
Emergency service
Number of main residences overcrowded Part (%)
which population living in apartments Part (%)
People living in an apartment in a household of
at least 4 people
Share of private park accommodation potentially
unworthy (PPPI) - Source Dhrill
0.721121
0.2702388
0.965011
0.556234
0.559437
0.351085
0.116735
0.741465
0.651726
0.670789
0.85455
0.0075429
0.3294512
0.3305705
0.6040112
0.518652
0.0183661
0.2236003
0.1730079
0.0579598
0.409242
0.780782
0.564617
0.798154
0.807258
0.911818
0.094789
0.191453
0.058083
0.344103
0.662656
0.683236
0.017171
0.570496
1.106E-05
0.0758108
0.0727833
0.1077442
0.0102245
0.0793671
0.0435737
0.0657052
0.1342393
0.2657882
0.1517911
0.0466165
0.9595219
0.3373785
0.141567
0.828304
0.045632
0.9143809
highlighted by very difficult economic and health conunworthy, a low-income population, and mostly from
Hence, these socio-economic conditions cause a higher
pandemic.
5
Table 2: Projection of IDF departments on the two main PCA axis
Paris
Seine-et-Marne
Yvelines
Essonne
Hauts-de-Seine
Seine-Saint-Denis
Val-de-Marne
Val-d’Oise
F2
2.654331
-2.797914
-4.153429
-2.790276
-0.734134
7.2151162
0.7085487
-0.102243
Results
ro
of
3
F1
9.605195
-3.14978
0.442294
-1.7583
3.911152
-4.79127
-0.45865
-3.80063
The list of these variables is presented in Tables 5 to 9 in the Appendix part. To compare the
values of these set of variables we decided to evaluate the variation in percentage of each value
for each department with respect to the average of the Ỵle-de-France region. This implies that a
value of 10% in a Table suggests that a department has a value 10 % higher than the average of
all departments in the Ile de France region.
lP
re
-p
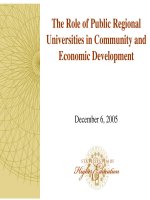
Our study provides interesting results. First, we note in Figure 3 that the link between the
population over age of 75 and excess mortality is not absolute. Two departments with the highest population deltas over age of 75, Paris (+14.38%) and Yvelines (+14.38%), are among the
departments with the lowest excess mortality (respectively +73,90% and +66.60%). Conversely,
while Seine-Saint-Denis department displays the lowest delta on the population over 75 (-38.51%),
it shows the highest excess mortality (+128.10%). Theoretically, the standard observation would
have been the opposite. The high mortality rate observed among people over 75 years in France,
representing 78.3% of deaths with an average age of 81.2 (Santé Publique France, 2020), should
have led to a negative ranking on such departments. The Val-d’Oise is also a department with
a negative delta regarding the population over 75 years old (-15.54%) but with the fourth excess
mortality in Ỵle-de-France (+88.6%). Seine-et-Marne department has also a smaller population of
over 75 (-7.41%) associated to an excess mortality rate of +71.70%.
na
Table 3: Economic, social and financial variables
Jo
ur
Seine-Saint-Denis
Paris
Seine-et-Marne
Yvelines
Essonne
Hauts-de-Seine
Val-de-Marne
Val-d’Oise
Unemployment
benefit in income
39.13%
-5.14%
-5.14%
-14.62%
-8.30%
-11.46%
-1.98%
7.51%
Poverty
rate
84.07%
1.69%
-25.34%
-37.57%
-16.98%
-21.48%
7.48%
8.13%
6
Social minima
in income
118.18%
-27.27%
-7.44%
-47.11%
-14.05%
-33.88%
5.79%
5.79%
Little or no graduate
in the workforce
46.12%
-30.97%
5.85%
-15.24%
-0.29%
-21.76%
4.70%
11.60%
Table 4: Housing variables
Seine-Saint-Denis
Household
size
77.47%
-37.20%
-64.51%
-72.70%
-4.44%
-1.71%
-1.71%
Overcrowded
housing
9.47%
68.16%
-20.00%
5.26%
1.05%
5.26%
-7.37%
-3.16%
9.47%
29.80%
-38.78%
-40.41%
-28.98%
6.12%
11.84%
-7.76%
lP
re
-p
ro
of
Paris
Seine-et-Marne
Yvelines
Essonne
Hauts-de-Seine
Val-de-Marne
Val-d’Oise
Potentially
unworthy
housing
104.78%
Jo
ur
na
Figure 3: Link between age and excess mortality
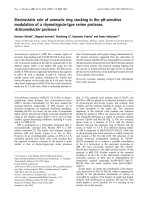
Figure 4: Economic inequalities
7
ro
of
Figure 5: Inequalities linked to housing
lP
re
-p
Furthermore, our study allows us to identify a broader number of factors. Firstly, we analyse
the specificity of each department with a significant excess mortality despite its more advantageous demography compared to others. Secondly, using economic, social and financial variables
that can reveal the insecurity of department populations, such as unemployment benefits, poverty
rate, minimum social benefits or level of education, and other variables specific to the structure
of housing, we offer a chance to implement tailor-made structural policies. For instance, in regard
to unemployment benefit income, we observe that Seine-Saint-Denis and Val-d’Oise are the only
departments to have a positive delta with +39.13% and +7.51% respectively, as presented in Table
3, with a very clear demarcation for Seine-Saint-Denis (see Figure 4). Among the cluster, all the
other departments have negative deltas (see unemployment benefit income in Figure 4).
ur
na
With respect to the poverty rate using the same observation, four departments have positive
deltas with a clear demarcation of the Seine-Saint-Denis (+84.07%), Val-d’Oise (+8.12%) and Valde -Marne (+7.48%) (see Poverty rate in Figure 4). We find similar result at the observation of
social minima where three departments including Seine-Saint-Denis, Val-d’Oise and Val-de-Marne
have positive deltas with a clear demarcation for Seine-Saint-Denis (+118.20%), Val-d’Oise and
Val-de-Marne tied (+5.79%) (see Social minima in income in Figure 4). Finally, in regard to the
share of individuals without diploma into the workforce, Seine-Saint-Denis still occupies the first
place with a delta of +46.12% compared to the average of the cohort. It is followed by Val-d’Oise
(+11.60%), Seine-et-Marne (5.84%) and Val-de-Marne (+4.69%) (see the “little or no graduate in
the workforce” item in Figure 4).
Jo
Based on the analysis of economic and financial variables, the first conclusion that can be drawn
is that there are several common points between Seine-Saint-Denis and Val-d’Oise. These are two
departments with a smaller population of 75+ but with significant excess mortality, despite social
distancing measures implemented by the French Government. Indeed, following the promulgation
of the Law 2020-290 of March 23, 2020 code-named “Emergency to face the epidemic of COVID19”, extended by the Law 2020-546 of May 11, 20205 , the French Government is authorized to rule
into legislative matters by decree when it concerns the fight against COVID-19 epidemic in France.
In addition, regarding inequalities relating to the structure of housing, with particular reference
to unworthy housing, the two departments with positive deltas are Seine-Saint-Denis (+104.77%)
and Paris (+77.47%) (see “Potentially unworthy housing” in Figure 5). For the average size of
households, five departments have a positive delta: Seine-Saint-Denis (+9.47%), Seine-et-Marne
(+5.26%), Yvelines (+1.05%), Essonne (+5.26%) and Val-d’Oise (+9.47%) (see “Household size”
in Figure 5). Finally, regarding the variable “overcrowded main residences”, four departments have
5 Refer
to />
8
positive deltas including Seine-Saint-Denis (+68.16%), Paris (+29.79%), Hauts-de-Seine (+6.12%)
and Val-de-Marne (+ 11.83%), with a delta far above that of Seine-Saint-Denis (see “Overcrowded
housing” in Figure 5).
4
Conclusion and opening to future work
ro
of
Seine-Saint-Denis differs from other departments in Ỵle-de-France when grouped according to a
number of important variables. On one hand, these variables relate to the main field of financial economic poverty while on the other, there are structural factors relating to housing. These
variables shed light on the excess mortality during social distancing and lockdown policies implemented by the French Government. Six of these seven variables are also significant in Val-d’Oise,
another department which, like Seine-Saint-Denis, has a significant excess mortality with a lower
proportion of people over the age of 75. Thus, our study provides political leaders with a number
of inputs which allows them to better implement effective measures in the event of a second wave
of COVID-19 or new pandemics due to viruses within the COVID-19 family.
-p
Territorial units with higher precariousness indicators (unemployment benefit income, poverty
rate, social minima in income, little or no graduate in the workforce) and less suitable housing
(unworthy housing, household size, overcrowded housing) are more at risk, including when their
population is younger. Therefore, it is a requirement to set up new health policies facilitating an
accurate monitoring of the inhabitants and their environment in these departments or agglomerations, with the main objective of breaking human-to-human transmission chains more quickly and
efficiently. Regarding future studies, it would be interesting to corroborate the results obtained
from this study with evidences from other countries and other continents regarding the analysis of
structural factors and mortality rates during pandemics.
re
References
lP
Abrams E. M. and Szefler S. J. (2020), “Managing Asthma during COVID-19: An Example for
Other Chronic Conditions in Children and Adolescents”, The Journal of Pediatrics. Available at:
/>
na
Altmann D. M., Douek D. C. and Boyton R. J. (2020), “What policy makers need to know
about COVID-19 protective immunity”, The Lancet. Available at: />
ur
Bacon S., Bates C., et al. (2020), “OpenSAFELY: factors associated with COVID-19-related hospital death in the linked electronic health records of 17 million adult NHS patients”, Working Paper,
University of Oxford. Available at: />
Jo
Butler D. (2013), “Progress stalled on coronavirus: lack of in-depth studies hampers efforts to
identify source”, Nature 7467 (501): 294-295. Available at: />Cohen J. (2020), “Vaccine designers take first shots at COVID-19”, Science 368 (6486): 14–6. Available at: />Desjardins M. R., Hohl A. and Delmelle E. M. (2020), “Rapid surveillance of COVID-19 in the
United States using a prospective space-time scan statistic: Detecting and evaluating emerging clusters”, Applied Geography 118: 102202. Available at: />Di Lorenzo G. and Di Trolio R. (2020), “Coronavirus Disease (COVID-19) in Italy: Analysis
of Risk Factors and Proposed Remedial Measures”, Frontiers in medicine 7:140. Available at:
/>
9
Gilbert M., Pullano G., et al. (2020), “Preparedness and vulnerability of African countries against
importations of COVID-19: a modelling study”, The Lancet 395(10227): 871–877. Available at:
/>Hopman J., Allegranzi B. and Mehtar S. (2020), “Managing COVID-19 in Low- and Middle-Income
Countries”, JAMA 323(16): 1549–1550. Available at: />Klonoff D. C. and Umpierrez G. E. (2020), “COVID-19 in patients with diabetes: risk factors that
increase morbidity”, Metabolism: clinical and experimental.
Available at: />
ro
of
Li X., Xu S., et al. (2020), “Risk factors for severity and mortality in adult COVID-19 inpatients
in Wuhan”, The Journal of Allergy and Clinical Immunology.
Available at: />
Liu J., Zhou J., et al. (2020), “Impact of meteorological factors on the COVID-19 transmission: A
multi-city study in China”, Science of the Total Environment 726: 138513.
-p
Martinez-Alvarez M., Jarde A., et al. (2020), “COVID-19 pandemic in west Africa”, The Lancet
Global Health 8(5): 631–632.
re
McKee M. and Stuckler D. (2020), “If the world fails to protect the economy, COVID-19 will
damage health not just now but also in the future”, Nature medicine 26: 640-642. Available at:
/>
lP
Mihm S. (2020), “COVID-19: Possible Impact of the Genetic Background in IFNL Genes on Disease Outcomes”, Journal of Innate Immunity. Available at: />NHS England (2020), “COVID-19 Daily Deaths”. Available at:
/>
na
Nuwagira E. and Muzoora C. (2020), “Is Sub-Saharan Africa prepared for COVID-19?”, Tropical
Medicine and Health 48(18).
Available at: />
Jo
ur
Santé Publique France (2020), “COVID-19 : point épidémiologique du 24 mars 2020”. Available
at: />Sargin G. and Yavasoglu S. (2020), “Is Coronavirus Disease 2019 (COVID-19) seen less in countries
more exposed to Malaria?”, Medical Hypotheses 140.
Available at: />
Shoenfeld Y. (2020), “Corona (COVID-19) time musings: Our involvement in COVID-19 pathogenesis, diagnosis, treatment and vaccine planning”, Autoimmunity Reviews 19: 102561.
Available at: />Thanh Le T., Andreadakis Z., et al. (2020), “The COVID-19 vaccine development landscape”,
Nature reviews Drug discovery 19(5): 305–6. Available at: />
10
Webb Hooper M., Nápoles A. M. and Pérez-Stable E. J. (2020), “COVID-19 and Racial/Ethnic
Disparities”, JAMA. Available at: />WHO (2020a), “WHO Director-General’s opening remarks at the media briefing on COVID-19
- 11 March 2020”. Available at: />WHO (2020b), “Clinical management of severe acute respiratory infection when COVID-19 is
suspected”. Available at: />
Jo
ur
na
lP
re
-p
ro
of
Yue X. G., Shao X. F., et al. (2020), “Risk Prediction and Assessment: Duration, Infections, and
Death Toll of the COVID-19 and Its Impact on China’s Economy”, Journal of Risk and Financial
Management 13(4) 66. Available at: />
11
5
Appendix
Table 5: Values of the delta percentage of our panel of data for each department - Part I
Excess mortality
73.90%
71.70%
66.60%
88.20%
127.80%
128.10%
96.50%
88.60%
0 → 19yrs
-37.41%
5.55%
2.34%
4.76%
-6.54%
10.44%
-1.70%
9.18%
20 → 39yrs
18.28%
-8,82%
-15.93%
-6.47%
3.56%
4.51%
1.44%
-4.52%
40 → 59yrs
-4.97%
2,29%
3.63%
0.98%
1.31%
-2.28%
-0.13%
-1.36%
60 → 74yrs
7.17%
3.93%
6.78%
-0.54%
-3.09%
-15.50%
-0.93%
-1.22%
≥ 75yrs
14.38%
-7.41%
14.38%
2.45%
8.48%
-38.51%
2.71%
-15.54%
ro
of
Departments
Paris
Seine-et-Marne
Yvelines
Essonne
Hauts-de-Seine
Seine-Saint-Denis
Val-de-Marne
Val-d’Oise
Table 6: Values of the delta percentage of our panel of data for each department - Part II
270.31%
-95.79%
-88.83%
-87.29%
62.69%
21.21%
0.22%
-82.52%
Median of
standard
of living
Share of
taxable
households
-20.00%
5.26%
1.05%
5.26%
-7.37%
9.47%
-3.16%
9.47%
15.85%
-2.43%
11.60%
-0.06%
14.83%
-26.55%
-5.11%
-8.13%
8.98%
-1.78%
10.40%
2.81%
10.72%
-24.40%
-1.46%
-5.26%
re
-14.04%
-7.11%
-14.04%
-9.88%
-12.65%
44.19%
-0.17%
13.69%
Average
household
size
lP
Paris
Seine-et-Marne
Yvelines
Essonne
Hauts-de-Seine
Seine-Saint-Denis
Val-de-Marne
Val-d’Oise
Population
density
-p
2019-Q4
quarterly
unemployment rate
Share of unemployment
benefits in
disposable
income
-5.14%
-5.14%
-14.62%
-8.30%
-11.46%
39.13%
-1.98%
7.51%
Table 7: Values of the delta percentage of our panel of data for each department - Part III
Poverty
rate
-27.27%
-7.44%
-47.11%
-14.05%
-33.88%
118.18%
5.79%
5.79%
1.69%
-25.34%
-37.57%
-16.98%
-21.48%
84.07%
7.48%
8.13%
Jo
ur
na
Share
of social
minima
in disposable
income
Paris
Seine-et-Marne
Yvelines
Essonne
Hauts-de-Seine
Seine-Saint-Denis
Val-de-Marne
Val-d’Oise
Share
of those
with little
or no education in
the outof-school
population aged
15
and
over
-30.97%
5.85%
-15.24%
-0.29%
-21.76%
46.12%
4.70%
11.60%
12
Share of
higher
education
graduates
in
the
out-ofschool
population of 15
years or
more
52.54%
-25.87%
10.18%
-10.75%
31.61%
-33.69%
-2.43%
-21.59%
Share
of
apartments
in total
housing
Share
of
houses
in total
housing
44.56%
-39.52%
-16.22%
-22.49%
29.62%
10.51%
13.50%
-19.96%
-97.14%
84.59%
35.35%
49.01%
-63.15%
-22.48%
-29.47%
43.29%
Table 8: Values of the delta percentage of our panel of data for each department - Part IV
28.90%
-14.55%
14.69%
-8.35%
24.93%
-25.12%
-6.78%
-13.71%
General
practitioner
2018
Nurse
Pharmacy
ro
of
-37.74%
39.25%
-4.27%
11.80%
-47.11%
12.47%
1.76%
23.85%
Share
of
public
administration,
education,
health
and
social
work
-9.94%
6.47%
-0.09%
8.30%
-38.38%
4.65%
12.31%
16.68%
116.64%
-15.67%
-9,61%
-26.61%
1.67%
-16.09%
-21.39%
-28.96%
126.70%
-1.90%
-24.89%
-12.76%
-24.71%
-17.10%
-28.24%
-17.10%
-p
average
hourly
net
wages
114.95%
-23.91%
-15.39%
-27.05%
4.98%
-14.28%
-12.43%
-26.87%
lP
re
Paris
Seine-et-Marne
Yvelines
Essonne
Hauts-de-Seine
Seine-Saint-Denis
Val-de-Marne
Val-d’Oise
Share
of
workers
in the
number
of jobs
Table 9: Values of the delta percentage of our panel of data for each department - Part V
Emergency Nb. of
service
overcrowded
main
residences
Jo
ur
na
Elderly
accommodation
Paris
Seine-et-Marne
Yvelines
Essonne
Hauts-de-Seine
Seine-Saint-Denis
Val-de-Marne
Val-d’Oise
52.58%
2.41%
-6.53%
4.47%
10.65%
-27.15%
-14.78%
-21.65%
34.74%
-7.37%
1.05%
1.05%
9.47%
1.05%
-15.79%
-24.21%
29.80%
-38.78%
-40.41%
-28.98%
6.12%
68.16%
11.84%
-7.76%
13
population
living in
apartment
People
living in
apartments in
a household
of
at least 4
people
53.73%
-44.59%
-20.36%
-25.11%
32.52%
11.78%
14.47%
-22.42%
60.00%
-25.33%
-49.71%
-29.90%
0.57%
53.90%
8.19%
-17.71%
Share of
housing
in the potentially
unworthy
private
housing
stock
(PPPI)
- Source
Dhrill
77.47%
-37.20%
-64.51%
-72.70%
-4.44%
104.78%
-1.71%
-1.71%