Clutches and brakes design and selection P1
Bạn đang xem bản rút gọn của tài liệu. Xem và tải ngay bản đầy đủ của tài liệu tại đây (407.67 KB, 16 trang )
1
Friction Materials
Curves of the coefficient of friction as a function of load and of the speed
differential between the lining and facings and their mating surface are no
longer available from many manufacturers. Perhaps this is a consequence of
the ease with which trial lawyers in the United States can collect large financial
rewards for weak liability claims based upon often trivial, or unavoidable (due
to physical limits on manufacturing tolerances), differences between pub-
lished data and a particular specimen of the manufactured product. Further-
more, differences between published and operational coefficients of friction
are beyond the control of the manufacturer because comparison of laboratory
and operational data have shown that temperature, humidity, contamination,
and utilization cycles of the machinery using these linings and facings can
cause significant changes in the effective coefficient of friction at any given
moment. Consequently, the coefficients of friction mentioned are nominal,
the following discussion is in generic terms, and all curves shown should be
understood to represent only the general character of the material under
laboratory conditions.
The value of laboratory data is twofold, even though the data should
not be used for design purposes. First, the data provides a comparison of the
performance of different lining materials under similar conditions, such as
given by the SAE 661 standard. Second, comparison of the laboratory data
with field data for a particular type of machine for several different linings
may suggest an empirical relationship that yields an approximate means of
predicting the field performance of other lining materials based upon their
laboratory data. A history of the comparison of field and laboratory data
Copyright © 2004 Marcel Dekker, Inc.
may, therefore serve as a starting point in the design of the prototype of a new
machine of the same or similar type.
Field testing of a new machine by customers under the most adverse
conditions is still necessary. Users often seem to devise abuses not envisioned
by the design engineers.
I. FRICTION CODE
The usual range of the dynamic friction coefficients for those friction
materials normally used in dry brake linings and pads is given in the Society
of Automotive Engineers (SAE) coding standard SAE 866, which lists the
code letters and friction coefficient ranges shown in Table 1 [1]. According to
this code the first letter in the lining edge friction code indicates the normal
friction coefficient and the second letter indicates the hot friction coefficient.
Thus a lining material whose normal friction coefficient is 0.29 and whose hot
friction coefficient is 0.40 would be coded as follows:
Temperatures for the normal and hot friction coefficients are defined in SAE
J661, which also describes the measurement method to be used.
T
ABLE
1
Friction Identification System for
Brake Linings and Brake Block for Motor Vehicles
Code letter Friction coefficient
C Not over 0.15
D Over 0.15 but not over 0.25
E Over 0.25 but not over 0.35
F Over 0.35 but not over 0.45
G Over 0.45 but not over 0.55
H Over 0.55
Z Unclassified
Chapter 12
Copyright © 2004 Marcel Dekker, Inc.
Static and dynamic coefficients of friction are usually different for most
brake materials. If a brake is used to prevent shaft rotation during a particular
operational phase, its stopping torque and heat dissipation are of secondary
importance (i.e. a holding brake on a press); the static friction coefficient is the
design parameter to be used. On the other hand, the pertinent design param-
eters are the dynamic friction coefficient and its change with temperature
when a brake is designed for its stopping torque and heat dissipation when a
rotating load is to be stopped or slowed.
Most manufacturers will provide custom compounds for the linings and
facings within the general types that they manufacture if quantity require-
ments are met. In almost all applications it is suggested for all of these
materials that the linings and facings run against either cast iron or steel with a
surface finish of from 30 to 60 micro inches. Nonferrous metals are recom-
mended only in special situations.
Effects of heating on the linings and facing discussed are expressed in
terms of limiting temperatures or limiting power dissipated per unit area at
the surface of the brake lining or clutch facing. Time is usually omitted, even
though the surface temperature is determined by the power per unit area per
unit time. This is because it is assumed that the power dissipation occurs over
just a few seconds. More precise estimates, and only that, of the heat gener-
ated by the power dissipated in particular cases maybe had by using one of
several heat transfer programs from suppliers of engineering software. It is for
these reasons that prototype evaluation is always recommended.
II. WEAR
Hundreds of equations for wear may be found in the literature. These
equations may depend a variety of factors, including the materials involved,
the temperature, and the environment under consideration, i.e., the liquid or
gas present, the formation of surface films, and so on [2]. Two of the relations
that pertain to the following discussion are the specific wear rate and the wear
rate.
The first of these, the specific wear rate, or wear coefficient, is a dimen-
sional constant K that appears in the relation
yA ¼ t ¼ KqAd ¼ KFd
From which t may be written as
t ¼ KFd ð2-1Þ
In these relations, y represents the thickness of the lining material
removed, o is the volume material removed, K is a dimensional constant that
is termed the specific wear rate or the wear coefficient, and p is the pressure
Friction Materials 3
Copyright © 2004 Marcel Dekker, Inc.
actingoverthesurfaceareaAthatisincontactwiththeliningmaterial.Force
Fisgivenbyintegralofthepressureactingonthespecimenintegratedover
theareaAoverwhichitacts.Uponrewritingequation(2-1)toevaluateKwe
havethat
K¼t=ðFdÞð2-2Þ
HencetheunitsofKarelt
2
/mwherel,t,andmdenotelength,time,andmass,
respectively.Asapracticalmatter,ifoismillimeterscubed(mm
3
),ifforceFis
innewtons(N),andifthedistancedisinmeters(m),thentheunitsofK
becomemm
3
N
À1
m
À1
,whichexplicitlyshowsthephysicalquantities
involved,asinFigure3.
Thesecondrelationthatmaybeusedbybrakeandclutchlining
manufacturerstodescribewearis
G¼tPtQð2-3Þ
inwhichGrepresentsthewearrate,Pisthepowerdissipatedinthelining,and
tisthetimeduringwhichvolumeVwasremovedattemperatureQ.Theunits
ofGinequation(2-3)arethoseofthework(ml
2
/t
2
)requiredtoremoveaunit
volumeofmaterialmultipliedbythevolume(l
3
)removed.
Wheneverthetemperatureisheldconstantduringatest,thetemper-
aturevariableQissuppressed.SincebraketestingaccordingtotheSAE661b
standardisdoneat200jF,thewearrateisoftengivenbyG=oPtand
presentedintheformo=G/(Pt).Again,tobepracticalthewearratedivided
bytheproducthorsepowerhours(hphr)maybegivenincubicinches(in.
3
),as
inTable2neartheendofthischapter.
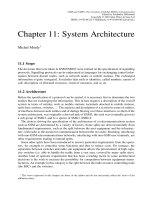
III.BRAKEFADE
Brakefadeisatermthatreferstothereducedeffectivenessofmanydrybrakes
astheybecomeheated.AstandardtestdescribedinSAEJ661outlinesa
procedurethatusescontrolledtemperaturedrumsandcontrolledbrakelining
pressuretostimulatebrakefadingasabasisofcomparisonofthebrake
fadingcharacteristicsofvariousliningmaterials.Theequipmentandtemper-
aturesareessentiallyidenticaltothoseusedinestimatingthecoefficientof
frictionasafunctionoftemperature.Onlythepresentationofthedatais
different,asshowninFigure1.Thefadetestmodeofpresentationofdata
provides another indication of the recovery capability of the various lining
materials. As with the previous test data, the fade test results are limited to a
comparison of different lining materials for the test conditions only.
Limitation of the application of these data to preliminary design is
emphasized because the friction coefficient is dependent upon the pressure,
Chapter 14
Copyright © 2004 Marcel Dekker, Inc.
F
IGURE
1 Display of brake lining fade test results. (Courtesy of Scan-Pac, Mequon,
WI).
Friction Materials 5
Copyright © 2004 Marcel Dekker, Inc.
thetemperature,andtherelativevelocitiesofthecontractingsurfaces,as
notedearlier.Fieldtestsarerecommendedbeforetheproductionofanybrake
designbecauseoftheuncertaintyusuallyassociatedwiththevariables
involvedinliningheatingandinthecoolingcapabilityofthebrakehousing
andanyassociatedstructure.
IV.FRICTIONMATERIALS
Frictionmaterialsmaybeclassifiedaseitherdryorwet.Wetfrictionlining
materialsarethosethatmayoperateinafluidthatisusedforcoolingbecause
ofthelargeamountofenergythatmustbedissipatedduringeitherbrakingor
clutching.Thefluidsusedareoftenmotoroilortransmissionfluids.Lining
materialsthatcannotoperatewhenimmersedinafluidareknownasdry
liningmaterials.
A.PTFEandTFE
AtthistimeitappearsthatPTFE(polytetrafluoroethylene)andTFE(tetra-
fluoroethylene),bothincludedunderthetradenameTeflon,arecommonly
usedforbrakelinings[3].PTFEexhibitsalowcoefficientoffrictionandis
mechanicallyserviceableataboutF260jC,isalmostchemicallyinert,does
notabsorbwater,andhasgooddimensionalstability.Itsweaknessinshear
stressisgreatlyimprovedbytheadditionoffillers,suchasglassfibers.These
fibersalsoincreaseitswearresistanceandstrengthandincreaseitscoefficient
offrictionbyincreasingitsabrasiveness.Thedegreetowhicheachofthese
propertiesisincreaseddependsupontheamount,thephysicaldimensions,
theorientation,andthenatureofthematerialusedasafiller[4].
TogetherthesecharacteristicsmakePTFEbrakepadsusefulfordrag
brakesinmanufacturingprocesses,suchastapeproduction,wherethe
movingproductmustbeheldintensionduringpartofthemanufacturing
process.Likewise,PTFEclutchplatesandliningsthatmaybeusedwhenever
thetransmittedtorqueshouldremainbelowacertainlimit.
Laboratorymeasurementsofthecoefficientsoffrictionatroomtemper-
atureforseveralfilledPTFEmaterialswhensubjectedtoloadsof1.415Mpa,
or205psi,andof7.074Mpa,or1026psi,areshowninFigure2.Theyindicate
that the coefficients of friction for these PTFE specimens with various kinds
and sizes of fillers are all fairly independent of sliding speed, especially at
greater loads, when sliding against a mild steel surface with a roughness of
s.c.a. 0.03 Am c.l.a. [4]
Nominal coefficients of friction given by a particular manufacturer may,
as noted earlier, differ from those shown in Figure 2 because of the amount,
size, orientation, and kind of filler material used. Their static coefficient of
Chapter 16
Copyright © 2004 Marcel Dekker, Inc.