Analysis of boundary conditions and concept design for port dong lam thua thien hue province vietnam
Bạn đang xem bản rút gọn của tài liệu. Xem và tải ngay bản đầy đủ của tài liệu tại đây (23.11 MB, 218 trang )
"ANALYSIS OF BOUNDARY CONDITIONS AND CONCEPT
DESIGN FOR PORT DONG LAM, THUA THIEN-HUE
PROVINCE, VIETNAM"
Graduation committee:
Prof. Ir. H. Ligteringen Delft University of Technology
Dr. Ir. J. Van de Graaff Delft University of Technology
Ir. D.J.R. Walstra
Delft University of Technology
Ir. M. Westra
Royal Haskoning
Ir. T. Elzinga
Royal Haskoning
Author:
W.A.Broersen
Date:
May - 2010
Port Dong Lam
PREFACE
What lies in front of you is the result of the Master Thesis, the final step before graduation
in Civil Engineering at Delft University of Technology (DUT). This project is about the
analysis and modelling of boundary conditions and the conceptual design of Port Dong Lam,
Thua Thien-Hue Province, Vietnam. The work was executed in cooperation with Royal
Haskoning - departments Rotterdam, The Netherlands and Ho Chi Minh City, Vietnam.
Royal Haskoning provided me a working space and put all their information, knowledge and
advice at my disposal, for which I am thankful. As well, I want to show my gratefulness to
the members of my graduation committee for guiding me during the process:
Prof. ir. H. Ligteringen
Delft University of Technology, chair Ports & Waterways
Dr. ir. J. Van de Graaff
Delft University of Technology, chair Coastal Engineering
Ir. D.J.R. Walstra
Delft University of Technology, chair Coastal Engineering
Ir. M. Westra
Royal Haskoning (NL), department Coastal & Rivers
Ir. T. Elzinga
Royal Haskoning (NL), department Maritime
Besides I want to thank my overseas supervisors in Vietnam for providing information and
advice:
Ir. M. Coopman
Royal Haskoning (VN), department Maritime
Ir. M. Klabbers
Royal Haskoning (VN), department Maritime
Last but not least I want to show my appreciation to my friends, roommates and fellow
students. Special thanks go to my family, Mischa and my close friends Loek, Paul, Cyriel and
Jan. Without their support the mountain to climb would have been a few steps higher.
At the end of this project I can say that I have really expanded my knowledge and skills,
both technically and pragmatically. Moreover, my self-awareness has reached a higher level
which is priceless with regard to my future. The struggle to achieve this was tough and I
would like to quote a fellow student to describe this journey:
28/05/2010
I
MSc Thesis – W.A. Broersen
Port Dong Lam
Laat ik het afstudeerwerk vergelijken met een tocht over de Andes van Chili naar Argentinië.
Vooraf lijkt het een prachtig mooie tocht te worden, het begin loopt relaxed, maar er komt
ongetwijfeld een pas waar niet overheen te komen is. Dagen van sneeuwstormen en
psychologische ellende zorgen ervoor dat we geen steek verder komen. Maar naarmate het
berglandschap bekender terrein wordt, worden nieuwe paden zichtbaar. Met de weinige
ervaring stuiten we nog op een aantal tegenslagen die we van tevoren niet hadden
voorzien, maar omdat we goede bagage hebben en een portie kennis over de elementen
lukt het ons met gezond verstand om een weg te banen door de Cordilleras
(Andesgebergte). Aangekomen in Argentinië staat vervolgens een vliegtuig klaar, die kun je
nemen, naar welke plek op aarde dan ook. Bas van Son (2009)
Wouter Broersen
28/05/2010
Delft, 28 mei 2010
II
MSc Thesis – W.A. Broersen
Port Dong Lam
SUMMARY
Introduction
Dong Lam Cement Factory is developing a new clinker plant in Thua Thien-Hue Province,
Vietnam. The clinker has to be exported towards Ho Chi Minh City, where it is grinded into
cement and used for the construction industry. For the clinker production coal is needed
and has to be imported. To make the in- and export possible a new dedicated seaport is
required to allow for 15,000 dwt clinker vessels and 7,000 dwt coal vessels.
From the production plant, the clinker bulk is transported to a storage facility by truck.
From here the material is transported to the seaport by means of a conveyor belt. The coal
is transported by the same modalities but vice versa.
In the first phase (up to 2015) about 2 million ton per year bulk material is expected to be
handled at this port. In the second phase (2015 - 2035) this amounts about 4 million ton per
year of bulk material. Following the increasing demand for concrete, a doubling of the
production is expected in 2035. This results in a throughput of almost 8 million ton per year
in the third project phase (2035 and up).
Objective
The objective is to design a port with sufficient capacity to handle the predicted cargo flow
and which offers acceptable conditions for the ships to enter. The effective berth and
hinterland capacity have to be determined such, that turnaround times are within limits. To
create safe conditions, the vessels need to have enough space for manouevring in the wet
port area. These manoeuvres can be seriously disturbed by wind, wave, currents and
siltation on the long term. To ensure the workability of the port these effects have to be
limited.
Analysis
Port capacity
To determine the effective berth capacity the queuing theory is applied. In phase 1 and 2
one clinker and one coal berth satisfy with effective capacities of respectively 700 and 175
t/h respectively. In phase 3 two clinker and two coal berths are needed with the same
loading/unloading rates. Clinker is loaded with a radial loader and coal is unloaded with a
pneumatic unloader.
Boundary conditions
To get insight in the environmental boundary conditions, field data is collected and
analysed thoroughly. In Vietnam the wind climate is governed by the South-East Asian
monsoon system, with a dominant SE direction and strong NNE winds. The wave climate is
directly influenced by the wind climate and shows a similar pattern. With regard to extreme
conditions, once a year a tropical storm lands in the vicinity of the port site. These storms
are accompanied by strong wave conditions, coming from E to SE direction.
28/05/2010
III
MSc Thesis – W.A. Broersen
Port Dong Lam
Having frequent waves from the NNE and SE, littoral transport is generated in north- and
southward direction. Nevertheless, the northward transport is clearly dominant. Currents
are heading SE for most of the time.
Port dimensions
To reduce the breakwater length, it is decided for the tugs to make fast outside the
breakwaters. As a consequence, almost 4% of downtime can be expected, since tugs cannot
operate when Hs ≥ 2m. Once the vessel has entered the harbour the stopping manoeuvre
can be started, which requires an inner channel length of 290 m. The turning circle allows
for the turning manoeuvre for which a radius of 290 m is reserved. In the mooring basin,
ships are forced into the right position to make safe berthing possible. This requires a width
of 210 m and a quay length of 652 m. Note that these basic dimensions are determined for
project phase 3 (4 berths), considering a 15,000 dwt design vessel.
Layouts and evaluation
Four different layouts are developed for phase 3 of the project. Two of them are dismissed
in an early stage, because of unfavourable conditions. The other two layouts – the 'coastal'
and 'offshore' alternative, are evaluated with a cost-value approach. In this approach the
value of each design is assessed by means of a MCA.
The following criteria are taken into consideration: navigation, tranquillity at berth, coastal
impact, sedimentation, ease of cargo handling, safety and flexibility. Regarding navigation
and wind, wave and current hindrance, no significant differences are found. It turns out
that the most important difference is found in the coastal impact. The coastal alternative
will cause erosion along 7.5 km of coastline with a maximum retreat of 100 m. Instead, the
offshore alternative affects 'only' 3 km with maximum retreat of 70 m.
The other element of the cost-value approach is the costs. The investment costs for the
coastal alternative are 64.1 M$, which include the dredging works, breakwater and quay
construction. The costs for the offshore port amount 77.5 M$, which entails the dredging
works, breakwater, jetty quay and trestle construction. The relative low costs for the
coastal alternative are achieved by applying the cut-and-fill balance; the dredged sand is
used as breakwater foundation. Maintenance dredging costs are 1.75 M$ and 0.9 M$ for
respectively the coastal and offshore alternative.
To finish the cost-value approach the value/costs ratio is taken for both port layouts. The
coastal alternative (1.11) turns out to be a better port layout than the offshore alternative
(0.95).
Downtime assessment
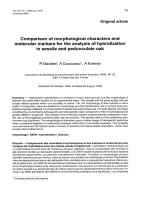
The total downtime amounts 5.4 %, which is entails the following contributions:
•
•
Wave height exceedance tugs:
Wind speed exceedance moored vessels
28/05/2010
IV
3.9%
1.5%
MSc Thesis – W.A. Broersen
Port Dong Lam
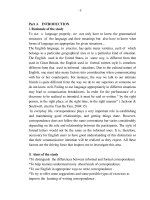
Figure 95: final port design.
28/05/2010
V
MSc Thesis – W.A. Broersen
Port Dong Lam
28/05/2010
VI
MSc Thesis – W.A. Broersen
Port Dong Lam
CONTENTS
PREFACE ............................................................................................................................................ I
SUMMARY ...................................................................................................................................... III
TABLE OF FIGURES........................................................................................................................... XI
TABLE OF TABLES ...........................................................................................................................XV
TABLE OF EQUATIONS ................................................................................................................. XVII
1
INTRODUCTION........................................................................................................................ 3
1.1
STUDY BACKGROUND ................................................................................................................. 3
1.1.1 Port location ..................................................................................................................... 4
1.1.2 Metocean conditions ........................................................................................................ 4
1.2
STUDY SCOPE ............................................................................................................................ 5
1.3
STUDY APPROACH AND CONTENTS ................................................................................................. 6
1.3.1 Data collection .................................................................................................................. 6
1.3.2 Modelling .......................................................................................................................... 6
1.3.3 Transport capacities ......................................................................................................... 6
1.3.4 Port dimensions ................................................................................................................ 6
1.3.5 Layout design and concept selection ................................................................................ 6
1.4
MISCELLANEOUS........................................................................................................................ 7
2
ENVIRONMENTAL BOUNDARY CONDITIONS ............................................................................ 8
2.1
INTRODUCTION.......................................................................................................................... 8
2.2
COASTAL CHARACTERISTICS .......................................................................................................... 8
2.3
CLIMATE .................................................................................................................................. 8
2.4
TOPOGRAPHY ............................................................................................................................ 9
2.5
BATHYMETRY .......................................................................................................................... 10
2.5.1 Cross-shore profile .......................................................................................................... 11
2.6
WATER LEVELS ........................................................................................................................ 12
2.6.1 Tide ................................................................................................................................. 12
2.6.2 Water level setup ............................................................................................................ 13
2.6.3 Sea level rise ................................................................................................................... 18
2.6.4 Conclusion ....................................................................................................................... 18
2.7
WIND DATA ............................................................................................................................ 19
2.7.1 Background ..................................................................................................................... 19
2.7.2 Normal conditions .......................................................................................................... 20
2.7.3 Extreme conditions ......................................................................................................... 25
2.7.4 Conclusion ....................................................................................................................... 27
2.8
WAVE DATA OFFSHORE ............................................................................................................. 28
2.8.1 Normal conditions .......................................................................................................... 28
2.8.2 Extreme conditions ......................................................................................................... 34
2.8.3 Conclusion ....................................................................................................................... 37
2.9
WAVE DATA NEARSHORE ........................................................................................................... 38
2.9.1 Normal conditions .......................................................................................................... 39
2.9.2 Extreme conditions ......................................................................................................... 41
2.9.3 Conclusion ....................................................................................................................... 46
2.10
CURRENT DATA........................................................................................................................ 48
2.10.1
Wind-driven currents .................................................................................................. 49
2.10.2
Tide driven currents .................................................................................................... 49
28/05/2010
VII
MSc Thesis – W.A. Broersen
Port Dong Lam
2.10.3
Conclusion ................................................................................................................... 50
2.11
SEDIMENT CHARACTERISTICS....................................................................................................... 52
2.11.1
Conclusion ................................................................................................................... 54
2.12
COASTAL MORPHOLOGY ............................................................................................................ 55
2.12.1
TUNG (2001) ............................................................................................................... 55
2.12.2
Littoral transport under normal conditions ................................................................ 56
2.12.3
Littoral transport under extreme conditions............................................................... 58
2.13
SOIL CONDITIONS ..................................................................................................................... 62
2.13.1
Conclusion ................................................................................................................... 64
3
TRANSPORT CAPACITY ........................................................................................................... 65
3.1
THROUGHPUT.......................................................................................................................... 65
3.2
OPERATIONAL REQUIREMENTS.................................................................................................... 68
3.3
TRANSPORT CAPACITIES............................................................................................................. 69
3.3.1 Berth assessment ............................................................................................................ 69
3.3.2 Conveyor belt .................................................................................................................. 74
3.3.3 Storage area.................................................................................................................... 75
3.3.4 Road ................................................................................................................................ 78
3.3.5 Conclusion ....................................................................................................................... 78
4
BASIC PORT DIMENSIONS ...................................................................................................... 79
4.1
INTRODUCTION ........................................................................................................................ 79
4.2
NORMAL CONDITIONS ............................................................................................................... 79
4.3
DESIGN VESSEL ........................................................................................................................ 79
4.4
WATER AREA ........................................................................................................................... 80
4.4.1 Approach channel ........................................................................................................... 80
4.4.2 Turning Circle .................................................................................................................. 85
4.4.3 Mooring Basin ................................................................................................................. 86
4.4.4 Quay length ..................................................................................................................... 86
4.5
CONCLUSION ........................................................................................................................... 87
5
ALTERNATIVE LAYOUTS ......................................................................................................... 88
5.1
INTRODUCTION ........................................................................................................................ 88
5.2
DESIGN CONSIDERATIONS........................................................................................................... 88
5.3
PORT LAYOUTS......................................................................................................................... 90
5.3.1 Refinement of port layouts ............................................................................................. 91
5.4
MULTI-CRITERIA ANALYSIS.......................................................................................................... 96
5.4.1 Navigation....................................................................................................................... 97
5.4.2 Tranquility at berth ......................................................................................................... 97
5.4.3 Coastal impact .............................................................................................................. 100
5.4.4 Sedimentation ............................................................................................................... 105
5.4.5 Safety ............................................................................................................................ 108
5.4.6 Flexibility ....................................................................................................................... 109
5.4.7 Result ............................................................................................................................ 109
5.5
CAPITAL COSTS CALCULATION.................................................................................................... 111
5.5.1 Coastal port ................................................................................................................... 111
5.5.2 Offshore port ................................................................................................................. 119
5.6
MAINTENANCE COSTS CALCULATION .......................................................................................... 126
5.6.1 Coastal port ................................................................................................................... 126
5.6.2 Offshore port ................................................................................................................. 126
5.7
COST-VALUE APPROACH .......................................................................................................... 128
6
CONCLUSIONS AND RECOMMENDATIONS........................................................................... 129
28/05/2010
VIII
MSc Thesis – W.A. Broersen
Port Dong Lam
6.1
CONCLUSIONS ....................................................................................................................... 129
6.2
RECOMMENDATIONS .............................................................................................................. 130
6.2.1 Data and modelling ...................................................................................................... 130
6.2.2 Port design .................................................................................................................... 130
7
REFERENCES ......................................................................................................................... 131
7.1
7.2
7.3
7.4
7.5
A.
MONSOON AND TYPHOON BACKGROUND .......................................................................... 134
A.1
A.2
B.
MONSOONS.......................................................................................................................... 134
TYPHOONS ........................................................................................................................... 134
OTHER WIND AND WAVE SOURCES ..................................................................................... 136
B.1
B.2
B.3
C.
BOOKS ................................................................................................................................. 131
LECTURE NOTES..................................................................................................................... 131
ARTICLES .............................................................................................................................. 131
OTHER REPORTS .................................................................................................................... 131
MANUALS ............................................................................................................................ 131
WIND DATA FROM CON CO ISLAND ........................................................................................... 136
WAVE DATA FROM CON CO ISLAND ........................................................................................... 137
WAVE DATA FROM GLOBAL WAVE STATISTICS ............................................................................. 138
TYPHOON GENERATED WIND AND WAVES .......................................................................... 138
C.1
WIND .................................................................................................................................. 138
C.2
WAVES ................................................................................................................................ 141
C.2.1 Calculation of maximum wave heights ......................................................................... 141
C.2.2 Calculation of wave heights at port site ....................................................................... 143
C.2.3 Example calculation ...................................................................................................... 146
D.
EXTREME VALUE DISTRIBUTIONS ......................................................................................... 149
D.1
D.2
D.3
E.
OFFSHORE CURRENTS .......................................................................................................... 155
E.1
E.2
F.
EXTREME WIND SPEEDS ........................................................................................................... 149
EXTREME WAVE HEIGHTS – TYPHOON GENERATED ........................................................................ 150
EXTREME WAVE HEIGHTS – MONSOON GENERATED ...................................................................... 152
WIND-DRIVEN ....................................................................................................................... 155
TIDE-DRIVEN ......................................................................................................................... 156
WAVE MODELLING .............................................................................................................. 157
F.1
GENERAL .............................................................................................................................. 157
F.2
MODEL SETUP ....................................................................................................................... 157
F.2.1 Land boundary .............................................................................................................. 157
F.2.2 Computational grids ..................................................................................................... 158
F.2.3 Bathymetry ................................................................................................................... 159
F.3
MODEL INPUT ....................................................................................................................... 159
F.3.1 Hydrodynamic boundary conditions ............................................................................. 160
F.3.2 Physical parameters ..................................................................................................... 161
F.3.3 Numerical parameters .................................................................................................. 162
F.4
CALIBRATION AND VALIDATION ................................................................................................. 162
F.5
MODEL OUTPUT .................................................................................................................... 162
F.5.1 Normal conditions ........................................................................................................ 162
F.5.2 Extreme conditions ....................................................................................................... 165
G.
MORPHOLOGICAL MODELLING ............................................................................................ 167
G.1
GENERAL .............................................................................................................................. 167
28/05/2010
IX
MSc Thesis – W.A. Broersen
Port Dong Lam
G.2
CERC FORMULA .................................................................................................................... 167
G.2.1 General .......................................................................................................................... 167
G.2.2 Calculation setup........................................................................................................... 169
G.2.3 Calculation of wave parameters ................................................................................... 169
G.2.4 Calculation of shoaling and refraction factors .............................................................. 169
G.2.5 Calculation of sediment transport................................................................................. 170
G.2.6 Calculation input and output ........................................................................................ 170
G.3
MIKE LITPACK – LITDRIFT ................................................................................................... 173
G.3.1 General .......................................................................................................................... 173
G.3.2 Hydrodynamic model .................................................................................................... 173
G.3.3 Sediment transport model ............................................................................................ 173
G.3.4 Model setup .................................................................................................................. 174
G.3.5 Model settings............................................................................................................... 177
G.3.6 Model input ................................................................................................................... 178
G.3.7 Calibration and validation ............................................................................................. 179
G.3.8 Model output ................................................................................................................ 179
G.3.9 Sensitivity analysis ........................................................................................................ 183
G.4
MIKE LITPACK – LITLINE ..................................................................................................... 185
G.4.1 General .......................................................................................................................... 185
G.4.2 Model setup .................................................................................................................. 185
G.4.3 Model input ................................................................................................................... 187
G.4.4 Calibration and validation ............................................................................................. 189
G.4.5 Model output ................................................................................................................ 189
H.
CALCULATIONS ON BERTH CAPACITY ................................................................................... 190
H.1
H.2
H.3
I.
PHASE 1 ............................................................................................................................... 190
PHASE 2 ............................................................................................................................... 191
PHASE 3 ............................................................................................................................... 192
BREAKWATER CALCULATIONS ............................................................................................. 193
I.1
I.2
J.
COASTAL PORT ........................................................................................................................... 193
OFFSHORE PORT ......................................................................................................................... 195
DREDGING COSTS ................................................................................................................ 196
J.1
J.2
J.3
CAPITAL DREDGING COSTS ............................................................................................................ 196
MAINTENANCE DREDGING COSTS – COASTAL PORT ............................................................................ 197
MAINTENANCE DREDGING COSTS – OFFSHORE PORT .......................................................................... 198
28/05/2010
X
MSc Thesis – W.A. Broersen
Port Dong Lam
TABLE OF FIGURES
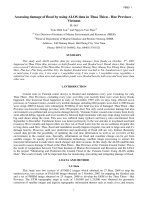
Figure 1: planned port site in Google Earth image. .................................................................................................. 3
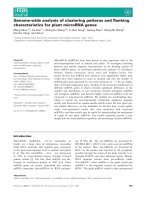
Figure 2: transport system for clinker export and coal import. ............................................................................... 4
Figure 3: rivers and lagoon system in Thua Thie- Hue province. .............................................................................. 9
Figure 4: bathymetry near Thua Thien-Hue Province obtained from C-map. ........................................................ 10
Figure 5: bathymetry near port site obtained from C-map. ................................................................................... 10
Figure 6: cross-shore C-C' ....................................................................................................................................... 11
Figure 7: different water levels in a mixed tide. ..................................................................................................... 12
Figure 8: measurement of the water level at the project site................................................................................ 13
Figure 9: schematization of wind setup. ................................................................................................................ 15
Figure 10: schematization of the fetch for wind-setup calculation. ....................................................................... 15
Figure 11: schematization of wave setup. .............................................................................................................. 17
Figure 12: calculation of wave setup ...................................................................................................................... 17
Figure 13: extreme water level contributions. ....................................................................................................... 18
Figure 14: Asian summer and winter monsoon system. ........................................................................................ 19
Figure 15: typhoon Cecil, landed in Vietnam at the 15th of October, 1985........................................................... 20
Figure 16: wind climate according to the China Sea Pilot ...................................................................................... 21
Figure 17: NOAA wind roses for the six data locations. ......................................................................................... 22
Figure 18: wind rose (1). ........................................................................................................................................ 23
Figure 19: time series of wind speed in 1998. ........................................................................................................ 24
Figure 20: cumulative exceedance frequency versus wind speed. ........................................................................ 25
Figure 21: top 50 of tropical depressions hitting central Vietnam between 1959 and 2009. ................................ 26
Figure 22: NOAA wave roses for the six data locations. ......................................................................................... 29
Figure 23: time series of wave height in 1998........................................................................................................ 30
Figure 24: wave rose (wave height, direction and frequency). .............................................................................. 31
Figure 25: wave rose (wave period, direction and frequency). .............................................................................. 32
Figure 26: wave height versus frequency exceedance. .......................................................................................... 33
Figure 27: Hs - Tp relation. ..................................................................................................................................... 34
Figure 28: severe monsoon event in dec 1998. ..................................................................................................... 36
Figure 29: wave model result for random wave condition. ................................................................................... 38
Figure 30: offshore wave rose with schematized wave directions. Source: NOAA, location 18N;107.5E. ............. 39
Figure 31: nearshore wave rose at 15 m water depth. .......................................................................................... 40
Figure 32: cumulative probability of exceedance versus wave height for offshore and nearshore wave data. .... 41
Figure 33: Typhoon ED (1990) coming from ESE (112.5º) direction and showing the dominant wave front. ........ 43
Figure 34: currents in the South China Sea. Source: UKHO (1978) ........................................................................ 48
Figure 35: locations of current measurements (about 600 m offshore). Source: TEDIPORT. ................................ 49
Figure 36: current rose for vertical 2. Source: local measurement by TEDIPORT. ................................................. 50
Figure 37: hydrographical survey area (drawing scale 1 : 50,000). ........................................................................ 52
Figure 38: bed sample of location MD9. ................................................................................................................ 53
Figure 39: net sediment transports along the coastal barrier from Thuan An inlet to Linh Thai. .......................... 55
Figure 40: cross-shore distribution of sediment transport for 1/10 years typhoon condition. ............................. 59
Figure 41: cross-shore distribution of sediment transport for 1/50 years typhoon condition. ............................. 59
Figure 42: cross-shore distribution of sediment transport for 1/10 years monsoon condition. ............................ 59
Figure 43: cross-shore distribution of sediment transport for 1/50 years monsoon condition. ............................ 59
Figure 44: borehole locations for geotechnical survey. ......................................................................................... 62
Figure 45: geotechnical cross-section indicating four different soil layers. ........................................................... 63
Figure 46: throughput time scheme....................................................................................................................... 65
Figure 47: transport system to and from the new sea port. .................................................................................. 66
Figure 48: schematized port system and the Erlang-k distribution. ....................................................................... 70
Figure 49: example of a portal scraper. ................................................................................................................. 72
28/05/2010
XI
MSc Thesis – W.A. Broersen
Port Dong Lam
Figure 50: example of a radial loader for clinker loading....................................................................................... 72
Figure 51: example of a continuous unloader for coal unloading.......................................................................... 73
Figure 52: example of a stacker-reclaimer. ............................................................................................................ 73
Figure 53: example of a conveyor belt (non-enclosed). ......................................................................................... 74
Figure 54: triangular shape of storage areas. ........................................................................................................ 75
Figure 55: example of an open storage. ................................................................................................................ 76
Figure 56: example of a covered warehouse. ........................................................................................................ 76
Figure 57: road between production plant and Port Dong Lam. ........................................................................... 78
Figure 58: make fast and pilot boarding outside the breakwater. ......................................................................... 81
Figure 59: increase of drift angle during entering of the port. .............................................................................. 82
Figure 60: basic manoeuvring width of a sailing ship. ........................................................................................... 83
Figure 61: channel depth contributions. ................................................................................................................ 85
Figure 62: required space for operations in mooring basin. .................................................................................. 86
Figure 63: four port layouts. .................................................................................................................................. 91
Figure 64: cross-shore distribution of sediment transport during 1/10 years typhoon......................................... 92
Figure 65: sediment transport during typhoon event - coastal port. .................................................................... 92
Figure 66: sediment transport during monsoon event - coastal port. ................................................................... 93
Figure 67: cross-shore distribution of sediment transport during 1/10 years monsoon. ...................................... 94
Figure 68: sediment transport during monsoon and typhoon events - offshore port. .......................................... 94
Figure 69: diffraction around breakwater head – coastal port. ............................................................................. 98
Figure 70: diffraction around breakwater head – offshore port. ........................................................................... 99
Figure 71: coastal impact - coastal port. .............................................................................................................. 100
Figure 72: coastal erosion - coastal port. ............................................................................................................. 102
Figure 73: coastal impact - offshore port. ............................................................................................................ 103
Figure 74: coastal erosion - offshore port............................................................................................................ 104
Figure 75: siltation areas for coastal port. ........................................................................................................... 105
Figure 76: cross-shore sediment distribution during 1/10 monsoon storm without and with coastline growth. 106
Figure 77: siltation area for offshore port. .......................................................................................................... 108
Figure 78: possible port expansion - coastal port. ............................................................................................... 109
Figure 79: dredging works - coastal port. ............................................................................................................ 111
Figure 80: sand spit and land reclamation – coastal port. ................................................................................... 112
Figure 81: cross-section of sand spit. ................................................................................................................... 112
Figure 82: erosion profile for sandy beaches. ...................................................................................................... 113
Figure 83: longitudinal cross-section of the main breakwater (lower picture) and the secondary breakwater
(upper picture). .................................................................................................................................................... 114
Figure 84: wave heights and water depths from SWAN model – coastal port. ................................................... 115
Figure 85: cross-section 1 and 2 (founded on sand spit) – coastal port. ............................................................. 116
Figure 86: cross-sections 3 and 4 – coastal port. ................................................................................................. 116
Figure 87: example of a marginal quay. ............................................................................................................... 119
Figure 88: dredging works - offshore port. .......................................................................................................... 120
Figure 89: sand spit - offshore port...................................................................................................................... 120
Figure 90: longitudinal cross-section of offshore breakwater. ............................................................................ 121
Figure 91: wave heights and water depths from SWAN model - offshore port. .................................................. 122
Figure 92: cross-sections 1 and 2 - offshore port................................................................................................. 123
Figure 93: example of a jetty quay, connected to the land by a trestle............................................................... 125
Figure 94: cost estimate offshore port. ............................................................................................................... 125
Figure 95: final port design. ................................................................................................................................. 129
Figure 96: Asian summer and winter monsoon system. ...................................................................................... 134
Figure 97: wind rose. Source: HMS, Con Co Island. ............................................................................................. 136
Figure 98: wave rose. Source: HMS of Con Co Island........................................................................................... 137
Figure 99: tabular wave data from Global Wave Statistics, Northeast direction. ................................................ 138
Figure 100: top 50 of tropical depressions hitting central Vietnam between 1959 and 2009. ............................ 139
Figure 101: dimensions of cyclone winds. ........................................................................................................... 142
28/05/2010
XII
MSc Thesis – W.A. Broersen
Port Dong Lam
Figure 102: F/R' versus Umax (m/s). .................................................................................................................... 142
Figure 103: ratio of wave height at distant r to wave height at eye radius R. ..................................................... 144
Figure 104: determination of distant r between landfall and port site. ............................................................... 145
Figure 105: definition of X, X' and Y. .................................................................................................................... 145
Figure 106: example calculation: determination of Hr / HR................................................................................. 148
Figure 107: Weibull distribution fitted to wind speeds of 33 m/s and up. .......................................................... 150
Figure 108: distinction between tropical storms and typhoons........................................................................... 151
Figure 109: Weibull distribution fitted to wave heights of 6.61 m and up. ......................................................... 152
Figure 110: Weibull fitted to wave height of 3.3 m and up.................................................................................. 154
Figure 111: currents in the South China Sea. Source: UKHO (1978). ................................................................... 155
Figure 112: computational grids used in the SWAN model.................................................................................. 158
Figure 113: land boundary, computational grid and bathymetry for grid 1. ........................................................ 159
Figure 114: k-factor per wave height and direction. ............................................................................................ 164
Figure 115: grid 2 and its bathymetry. ................................................................................................................. 164
Figure 116: wave attenuation for wave condition 20, grid 2. .............................................................................. 165
Figure 117: grid 1 (most coarse) in modelling of extreme waves. ....................................................................... 166
Figure 118: wave power P per unit beach length (left) and the alongshore component of P (right). .................. 168
Figure 119: linear relation between Sx ( I l ) and P ( Pl ) based on measurements. ............................................ 168
Figure 120: bathymetric survey by TEDIPORT. ..................................................................................................... 175
Figure 121: cross-shore coastal profile. ............................................................................................................... 175
Figure 122: fall velocity by Van Rijn (1984) and Delft Hydraulics. ........................................................................ 177
Figure 123: measured and approximated tidal current velocity. ......................................................................... 179
Figure 124: measured and approximated water level. ........................................................................................ 179
Figure 125: wave height, wave period and sediment transport in 1998.............................................................. 181
Figure 126: wave height, wave period and sediment transport (m3/s) between 1997 and 2009. ...................... 182
Figure 127: accumulated sediment transport (m3) from 1997 to 2009. .............................................................. 183
Figure 128: results of the sensitivity analysis. ...................................................................................................... 184
Figure 129: LITLINE model setup with indicated boundary conditions. ............................................................... 186
Figure 130: offshore port schematization. ........................................................................................................... 187
Figure 131: coastal port schematization. ............................................................................................................. 187
Figure 132: definition of coastline characteristics. .............................................................................................. 188
Figure 133: extended cross-shore profile............................................................................................................. 189
Figure 134: capital dredging costs........................................................................................................................ 196
28/05/2010
XIII
MSc Thesis – W.A. Broersen
Port Dong Lam
28/05/2010
XIV
MSc Thesis – W.A. Broersen
Port Dong Lam
TABLE OF TABLES
Table 1: fetch schematization and wind setup calculation. ................................................................................... 16
Table 2: wind speed and direction and the corresponding frequencies of occurrence. ........................................ 23
Table 3: typhoon induced wind speeds.................................................................................................................. 27
Table 4: wave height and direction and the corresponding occurrence frequencies. ........................................... 31
Table 5: wave period and direction and the corresponding occurrence frequencies. ........................................... 32
Table 6: wave steepness' for the different wave climates. .................................................................................... 34
Table 7: typhoon generated extreme waves.......................................................................................................... 35
Table 8: monsoon generated extreme waves. ....................................................................................................... 36
Table 9: wave height and direction and the corresponding frequencies of occurrence. ....................................... 41
Table 10: calculation of typhoon wave periods under extreme conditions. .......................................................... 42
Table 11: offshore typhoon conditions for wave model. ....................................................................................... 43
Table 12: nearshore typhoon wave conditions for structural design..................................................................... 44
Table 13: nearshore typhoon wave conditions for littoral transport calculation................................................... 44
Table 14: calculation of monsoon wave periods under extreme conditions. ........................................................ 45
Table 15: offshore monsoon conditions for wave model....................................................................................... 45
Table 16: nearshore monsoon wave conditions. ................................................................................................... 45
Table 17: current velocity and the occurrence frequency (%) in vertical 2. Source: TEDIPORT. ............................ 50
Table 18: sediment characteristics for MD1 to MD17. .......................................................................................... 53
Table 19: total littoral transport per year and per 12 year by CERC formula. ........................................................ 57
Table 20: total littoral transport per year and per 12 year as calculated by LITPACK ............................................ 58
Table 21: input for typhoon induced sediment transport. ..................................................................................... 58
Table 22: input for monsoon induced sediment transport. ................................................................................... 60
Table 23: determination of coal volume. ............................................................................................................... 67
Table 24: occupancy, mean waiting time and mean turnaround time in Phase 1. ................................................ 70
Table 25: occupancy, mean waiting time and mean turnaround time in Phase 2. ................................................ 71
Table 26: occupancy, mean waiting time and mean turnaround time in Phase 3. ................................................ 71
Table 27: required storage areas for clinker storage facility. ................................................................................. 77
Table 28: required storage areas for coal storage facility. ..................................................................................... 77
Table 29: required number of berths, transport and storage capacities. .............................................................. 78
Table 30: characteristics of clinker and coal vessels. ............................................................................................. 80
Table 31: calculation results of channel width. ...................................................................................................... 83
Table 32: calculation results of channel depth....................................................................................................... 84
Table 33: calculation result for inner channel depth. ............................................................................................ 85
Table 34: summary of water area dimensions. ...................................................................................................... 87
Table 35: determination of weight factors............................................................................................................. 96
Table 36: wave diffraction factors for coastal port. ............................................................................................... 98
Table 37: wave diffraction factors for offshore port. ............................................................................................. 99
Table 38: coastline growth in time for coastal port. ............................................................................................ 101
Table 39: coastline growth in time for offshore port. .......................................................................................... 102
Table 40: MCA result. ........................................................................................................................................... 110
Table 41: calculation of sand spit volume. ........................................................................................................... 112
Table 42: required volumes of concrete and natural rock – coastal port. ........................................................... 117
Table 43: material availability and costs. ............................................................................................................. 117
Table 44: placing and total costs per m3.............................................................................................................. 118
Table 45: Costs of Xbloc armour units.................................................................................................................. 118
Table 46: Total costs of breakwaters – coastal port............................................................................................. 118
Table 47: cost estimate coastal port. ................................................................................................................... 119
Table 48: total costs of breakwater - offshore port. ............................................................................................ 124
Table 49: NPV maintenance dredging operations - coastal port. ......................................................................... 126
28/05/2010
XV
MSc Thesis – W.A. Broersen
Port Dong Lam
Table 50: NPV maintenance dredging operations - offshore port. ...................................................................... 127
Table 51: Cost-Value Approach............................................................................................................................ 128
Table 52: wind speed and direction with corresponding occurrence frequencies. ............................................. 136
Table 53: wave height and direction and the corresponding frequencies of occurrence. ................................... 137
Table 54: top 50 typhoons between 1959 – 2009 and corresponding wind speeds............................................ 140
Table 55: top 50 typhoons and corresponding wave heights. ............................................................................. 143
Table 56: distant r, ratio r/R, ratio Hr/HR, Hs;max and Hs; max_site. ................................................................. 146
Table 57: example calculation: characteristics of typhoon Xangsane.................................................................. 147
Table 58: example calculation: results for typhoon Xangsane............................................................................. 147
Table 59: example calculation: actual wave height Hs;site (in m) ....................................................................... 148
Table 60: top 10 monsoon storms in terms of wave height. ............................................................................... 153
Table 61: example of a SWAN wavecon file......................................................................................................... 160
Table 62: SWAN input and output for offshore - nearshore wave translation .................................................... 161
Table 63: extreme offshore wave condition. ....................................................................................................... 161
Table 64: offshore - nearshore wave translation in normal conditions. .............................................................. 163
Table 65: extreme offshore and nearshore condition. ........................................................................................ 165
Table 66: wave height versus period and the corresponding occurrence frequency. ......................................... 171
Table 67: Kr versus wave height and wave period. .............................................................................................. 171
Table 68: Ksh versus wave height and wave period. ........................................................................................... 171
Table 69: nb versus wave height and wave direction. ......................................................................................... 172
Table 70: cb versus wave height and wave direction. ......................................................................................... 172
Table 71: wave height and period and the corresponding littoral transport. ...................................................... 172
Table 72: total littoral transport per year and per 12 year calculated by CERC formula. .................................... 173
Table 73: result of sediment transport for one random event. ........................................................................... 181
Table 74: total littoral transport per year and per 12 year as calculated by LITPACK .......................................... 183
Table 75: berth calculation phase 1. .................................................................................................................... 190
Table 76: berth calculation phase 2. .................................................................................................................... 191
Table 77: berth calculation phase 3. .................................................................................................................... 192
Table 78: breakwater calculation – coastal port. ................................................................................................. 194
Table 79: breakwater calculation – offshore port................................................................................................ 195
Table 80: maintenance dredging costs - coastal port. ......................................................................................... 197
Table 81: maintenance dredging costs - offshore port. ....................................................................................... 198
28/05/2010
XVI
MSc Thesis – W.A. Broersen
Port Dong Lam
TABLE OF EQUATIONS
Equation 1:water level rise due to low atmospheric pressure. .............................................................................. 14
Equation 2: calculation of wind shear stress and water level gradient. ................................................................. 15
Equation 3: Hs - Tm relationship. ........................................................................................................................... 34
Equation 4: CERC formula. ..................................................................................................................................... 56
Equation 5: basic sediment transport formula....................................................................................................... 57
Equation 6: formula to calculate v_eff. .................................................................................................................. 82
Equation 7: formula to calculate channel width. ................................................................................................... 83
Equation 8: formula to calculate channel depth. ................................................................................................... 84
Equation 9: calculation of quay length for one berth. ........................................................................................... 86
Equation 10: calculation of sedimentation volume. ............................................................................................ 107
Equation 11: calculation of PV (Present Value). ................................................................................................... 126
Equation 12: Bretschneider equation for maximum wind speed (m/s) in tropical depressions. ......................... 138
Equation 13: calculation of effective radius. ........................................................................................................ 141
Equation 14: Young's equation. ........................................................................................................................... 141
Equation 15: JONSWAP relationship. ................................................................................................................... 141
Equation 16: example calculation: effective radius. ............................................................................................ 147
Equation 17: example calculation: equivalent fetch. ........................................................................................... 147
Equation 18: example calculation: wave height Hs;max (in m)............................................................................ 147
Equation 19: calculation of the probability of exceedance of U10 for the peak-over-threshold approach. ........ 149
Equation 20: Calculation of U10 from Weibull equation. .................................................................................... 150
Equation 21: requirement for deep water wave conditions. ............................................................................... 166
Equation 22: basic CERC formula. ........................................................................................................................ 168
Equation 23: explicit CERC formula ...................................................................................................................... 168
Equation 24: calculation L0. ................................................................................................................................. 169
Equation 25: calculation L. ................................................................................................................................... 169
Equation 26: calculation k. ................................................................................................................................... 169
Equation 27: calculation c. ................................................................................................................................... 169
Equation 28: Snel's Law and calculation of phi_b. ............................................................................................... 170
Equation 29: refraction factor. ............................................................................................................................. 170
Equation 30: conservation of energy in waves. ................................................................................................... 170
Equation 31: shoaling factor. ............................................................................................................................... 170
Equation 32: calculation Sx. ................................................................................................................................. 170
Equation 33: calculation dimensionless bed shear stress. ................................................................................... 174
Equation 34: vertical turbulent diffusion equation. ............................................................................................. 174
Equation 35: suspended sediment transport. ...................................................................................................... 174
Equation 36: calculation of fall velocity. .............................................................................................................. 176
Equation 37: calculation of kinematic viscosity.................................................................................................... 176
Equation 38: continuity equation for sediment. .................................................................................................. 185
28/05/2010
XVII
MSc Thesis – W.A. Broersen
Port Dong Lam
28/05/2010
XVIII
MSc Thesis – W.A. Broersen
Port Dong Lam
REPORT
Analysis of boundary conditions and concept
design for Port Dong Lam, Thua Thien-Hue
Province, Vietnam
28/05/2010
1
MSc Thesis – W.A. Broersen
Port Dong Lam
28/05/2010
2
MSc Thesis – W.A. Broersen
Port Dong Lam
1
1.1
INTRODUCTION
Study Background
Dong Lam Cement Factory – one of the largest privately owned cement companies in
Vietnam - is developing a new clinker plant in Thua Thien-Hue Province. As well, three other
shareholders including a bank and other trading companies are involved.
Next to the location of the plant there is a limestone quarry which provides the main
ingredient for production process. The produced clinker will be exported from the province
and it will require coal for the production. To make this possible a new dedicated seaport is
required to allow for up to 15,000 dwt clinker vessels and up to 7,000 dwt coal vessels. This
new seaport terminal is to be constructed several kilometres from the quarry plant on the
coastal stretch North West of the city Hue (see Figure 1). In the first phase (up to 2015)
about 2 million ton per year bulk material is expected to be handled at this port. In the
second phase (2015 and up) this amounts about 4 million ton per year of bulk material.
After 2035 the production of the plant will be doubled, resulting in a throughput of 8
million ton per year.
Port site
Hue
Thua Thien-Hue Province
Figure 1: planned port site in Google Earth image.
28/05/2010
3
MSc Thesis – W.A. Broersen
Port Dong Lam
The clinker bulk will be transported from the plant to a storage facility by truck over a
specially-build new road. From there the material is transported to the seaport by means of
a conveyor belt. The coal is transported the other way around. This is shown in Figure 2.
From the port, the clinker is exported to a grinding plant in Ho Chi Minh City, where it is
grinded into cement.
SEA PORT
Port site
CONVEYOR BELT
wetland
Thuan An inlet
Sand barrier
STORAGE
lagoon
NEW ROAD
CLINKER PLANT
50 km
Figure 2: transport system for clinker export and coal import.
1.1.1
Port location
The port is to be located on the beginning of a coastal barrier, which is about 30 km away
from Thuan An inlet of the Tam Giang - Cau Hai lagoon – shown in the upper right corner in
Figure 2. This lagoon is located in Thua Thien-Hue province which is one of the six provinces
in the region of the North Central Coast. The province borders the Quang Tri Province to
the north, the city of Da Nang to the east, the Quang Nam Province to the south, and the
Xekong Province of Laos to the west.
1.1.2
Metocean conditions
In Vietnam, the monsoon system is the governing force of the wind and wave climate.
Besides, typhoons find their origin in the Western Pacific Ocean and propagate towards the
Vietnamese coast. The most affected areas by typhoons are the coastal provinces of the
North and Central regions. This means that wave conditions are strong and that severe
28/05/2010
4
MSc Thesis – W.A. Broersen
Port Dong Lam
wave conditions can be expected. Together with the sandy beaches this can lead to
significant erosion and accretion, which has to be studied when building port structures.
1.2
Study Scope
Paragraph 1 shows that an extensive transport system is required in between the clinker
and grinding plant to enable the transport of clinker and coal bulk. In this study the focus is
on the port design, which forms a very important element. The design of the conveyor belt
and storage facility is not considered in this study. Only the required capacities are
determined.
When designing a port four important conditions should be fulfilled:
•
•
•
•
The port entrance at the seaside should be safe and well accessible
The port basins and quays should provide adequate space for manoeuvring and
berthing of the ships
At the quay sufficient loading and unloading capacity should be available
The hinterland connections should be efficient and have enough capacity
In Paragraph 1.1.2 it was stated that knowledge and understanding about the metocean
and morphological circumstances in the port surroundings is crucial to make a proper port
design. The study objective can be outlined as follows:
The objective is to design a port with sufficient capacity to handle the predicted cargo flow
and which offers acceptable conditions for the ships to enter and for the surroundings. This
means that wave and current disturbance ánd sedimentation of the harbor basin have to be
limited as well as the morphological impact on the coast.
To give insight in the structure of this study the objective can be separated into five main
studies:
1. Data collection
2. Modeling of offshore wave conditions to nearshore and modeling of littoral
transport
3. Determination of required port capacity
4. Calculation of basic port dimensions
5. Design of several port layouts and selection of the optimal layout.
28/05/2010
5
MSc Thesis – W.A. Broersen