assessing damage of flood by using alos data in thua thien - hue province - vietnam
Bạn đang xem bản rút gọn của tài liệu. Xem và tải ngay bản đầy đủ của tài liệu tại đây (1.1 MB, 10 trang )
1
Assessing damage of flood by using ALOS data in Thua Thien - Hue Province -
Vietnam
PI: 063
Tran Dinh Lan
(1)
and Nguyen Van Thao
(2)
(1)
Vice Director of Institute of Marine Environment and Resources (IMER)
(2)
Head of Department of Marine Database and Remote Sensing, IMER
Address:, 246 Danang Street, Hai Phong City ,Viet Nam
Phone: 084 0313 564892; Fax: 0840313761521
SUMMARY
This study used ALOS satellite data for assessing damages from floods on October, 2
nd
, 2007
happened at Thua Thien Hue province in both flooded area and flooded level. Result shows that: flooded
area covered 7 districts of Thu Thien Hue Province, included: Huong Thuy, Huong Tra, Phong Dien, Quang
Dien, Phu Loc, Phu Vang and Hue City, the highest flooded level reached to 5m. Landuse/cover types such
as rural area, 2 crops rice, 1 rice crop + 1 vegetables crop, 2 rice crops + 1 vegetables crop, vegetables +
industrial tree crops, urban area and aquaculture ponds were flooded heavily both area and level more than
other one.
1. INTRODUCTION
Coastal zone in Vietnam center always is flooded and inundation every year. Counting for only
Thua Thien - Hue Provinces, excluding every year, over fifty year recently there were seven heavy floods
happened. One historical flood happened in early of November 1999 with six days long, effected seven
provinces in Vietnam Center, created very terrible damages including 600 peoples were died, 41100 houses
were swept, 608718 houses were submerged, 51000 ha of rice field was loss of damaged. Thua Thien - Hue
Province was heaviest damage province with 350 peoples died. Not only social economic damage but also
environment was polluted and ecosystems damage heavily. Vietnam Center coastal zone creates from lowly
strait alluvial deltas, lagoons and river mouths lie between high mountains with step slope along western and
big sand dunes along the coast. This area was suffered many typhoon and heavy rain concentrated from
September to December. Catchment forest was destroyed heavily in the war and due to un-planed used land
resources. River mouths and lagoon inlets are flow out of flood water into the sea are sediment irregular due
to long shore sand flow. Thus, flood and inundation usually happen irregular, fast and in large area and it’s
damage heavily. However, until now prediction and monitoring of flood still are very limited. Remotely
sensed data provide the possibility of updating the real time information as well as an overview of the
environment in the coastal zone. Specially, information on flood and coastline change can be get from
satellite images. In speedy growth of information technology, satellite image processing to extract the
interested information is made short, much cheaper and more accurate. In this study, the ALOS satellite data
was used to assess damage of flood at the Thua Thien - Hue Province in the Vietnam Coastal Center. This is
the result of cooperation between Viet Nam Institute of Marine Environment and Resources and the JAXA
in the project “Monitoring and Prediction the Coastal Flood in the Vietnam Center Using ALOS atellite
Data”. The result of study will be important data for monitoring, preventing and mitigating damage of flood.
2. DATA AND METHOD
2.1. Data
This study uses two scences of AVNIR-2 images which obtained on 27 May, 2008 to map the
landuse/cover, two scences of PALSAR image obtained on 2 October, 2007 for mapping the flooded area
and a set of PRISM image obtained on 25 August, 2008 to develop the DEM in the Thua Thien - Hue
Province. The UTM topographic maps at scale of 1:50,000 and 1:25,000 were obtained for geometric
correction of satellite images and digitize topographic information themes such as roads, river, and stream.
PI063-1
2
In order to extract information from satellite images, field trip data are used for comparing the color and
shape of features on the image with objects on the Earth surface and measure 10 ground control points of
height. The data such as tide, wave in the area were collected for determining the wave height and sea level
at the time of obtaining images to identify mean sea level on satellite image.
2.2. Method
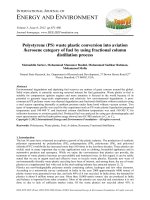
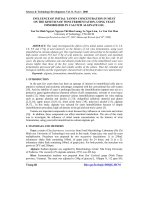
The map of landuse/cover types was established from AVNIR 2 image processing, the map of
flooded area from PALSAR and DEM from the PRISM image. Use the overlay function in the GIS tool to
calculate and map the flooded levels of landuse/cover types in the Thua Thien - Hue Province The method
of the study shows in the Figure 1.
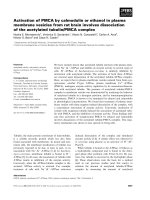
Fig. 2. The study area
3. RESULTS
3.1. Flooded area of landuse/cover types
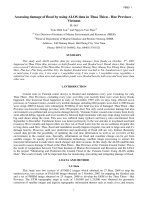
The map of landuse/cover was overlaid on the map of flooded area to calculate area and map the
flooded area of landuse/cover types. The result of calculation and map was shown in the Table 1 and Figure
3.
Tab. 1. Flooded area of landuse/cover types in the Thua Thien Hue Province
Landuse/cover types
Huong
Thuy
District
(ha)
Huong
Tra
District
(ha)
Phong
Dien
District
(ha)
Phu Loc
District
(ha)
Phu
Vang
District
(ha)
Quang
Dien
District
(ha)
Hue
City
(ha)
Rural area
47.4
42.9
39.7
194.1
85.2
45.1
0.0
Aquacalture ponds
445.5
73.2
69.7
200.4
314.8
335.4
0.0
1 crop rice + 1 crop vegetables
41.1
118.0
160.6
310.6
0.0
102.2
62.8
2 crop rice
3221.7
2975.2
2626.1
1990.4
6286.2
3941.6
899.0
2 crop rice + 1 crop vegetables
0.0
331.2
767.9
0.0
0.0
563.8
40.2
Fig. 1. Flowchart of the method
PI063-2
3
Vegetables + industrial tree crops
0.0
167.8
117.5
48.0
140.0
47.2
10.5
Fields and gardens
22.3
0.0
0.0
0.0
0.0
0.0
0.0
Phu Bai Airport
5.6
0.0
0.0
0.0
0.0
0.0
0.0
Urban rea
0.0
0.0
0.0
0.0
0.0
0.0
50.1
Fig. 3. Map of flooded area of landuse/cover types in the Thua Thien Hue Province
3.2. Flooded level of landuse/cover types
The map of landuse/cover types, flooded area and DEM were overlaid together to calculate and map
flooded level of landuse/cover types.
Flooded level higher 3m
Result of calculation and map of flooded level higher 3m of landuse/cover types shows in the Table
2 and Figure 4 with flooded time of one day.
Tab. 2. Flooded area higher 3m of landuse/cover types In Thua Thien Hue Province
Landuse/cover types
Huong
Thuy
District
(ha)
Huong
Tra
District
(ha)
Phong
Dien
District
(ha)
Phu Loc
District
(ha)
Phu
Vang
District
(ha)
Quang
Dien
District
(ha)
Hue
City
(ha)
Rural area
1.6
2.4
0.0
5.7
4.9
1.6
0.0
Aquacalture ponds
73.1
13.8
3.3
21.1
23.6
41.4
0.0
PI063-3
4
1 crop rice + 1 crop vegetables
0.0
4.9
37.4
0.8
0.0
15.4
0.0
2 crop rice
477.0
269.0
161.7
169.8
698.1
434.0
73.1
2 crop rice + 1 crop vegetables
0.0
4.1
0.8
0.0
0.0
17.1
1.6
Vegetables + industrial tree crops
0.0
13.8
0.8
0.0
6.5
8.1
0.0
Fields and gardens
0.0
0.0
0.0
0.0
0.0
0.0
0.0
Phu Bai Airport
0.0
0.0
0.0
0.0
0.0
0.0
0.0
Urban area
0.0
0.0
0.0
0.0
0.0
0.0
1.6
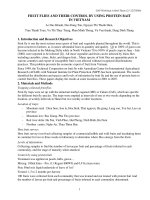
Fig. 4. Map of flooded area higher 3m of landuse/cover types in Thua Thien - Hue Province
Flooded level from 2 to 3m
Result of calculation and map of flooded level from 2 to 3m of landuse/cover types shows in the
table 3 and figure 5 with flooded time of one day.
Tab. 3. Flooded area from 2 to 3m of landuse/cover types In Thua Thien Hue Province
Landuse/cover types
Huong
Thuy
District
(ha)
Huong
Tra
District
(ha)
Phong
Dien
District
(ha)
Phu Loc
District
(ha)
Phu
Vang
District
(ha)
Quang
Dien
District
(ha)
Hue
City
(ha)
Rural area
4.1
8.9
4.9
24.4
29.3
6.5
0.0
Aquacalture ponds
87.8
8.9
2.4
56.1
82.1
107.3
0.0
1 crop rice + 1 crop vegetables
8.9
20.3
11.4
34.9
0.0
47.9
8.9
PI063-4
5
2 crop rice
872.8
726.5
354.3
380.3
1913.8
1054.0
247.1
2 crop rice + 1 crop vegetables
0.0
53.6
218.6
0.0
0.0
186.1
5.7
Vegetables + industrial tree crops
0.0
38.2
9.8
3.3
34.1
9.8
2.4
Fields and gardens
0.8
0.0
0.0
0.0
0.0
0.0
0.0
Phu Bai Airport
0.0
0.0
0.0
0.0
0.0
0.0
0.0
Urban area
0.0
0.0
0.0
0.0
0.0
0.0
13.8
Fig. 5. Map of flood area from 2 to 3m of landuse/cover types in Thua Thien - Hue Province
Flooded level from 1 to 2m
Result of calculation and map of flood level from 1 to 2m of landuse/cover types shows in the Table
4 and Figure 6 with flood time of one day.
Tab. 4. Flooded area from 1 to 2m of landuse/cover types In Thua Thien Hue Province
Landuse/cover types
Huong
Thuy
District
(ha)
Huong
Tra
District
(ha)
Phong
Dien
District
(ha)
Phu Loc
District
(ha)
Phu
Vang
District
(ha)
Quang
Dien
District
(ha)
Hue
City
(ha)
Rural area
8.1
6.5
6.5
40.6
20.3
10.6
0.0
Aquacalture ponds
36.6
4.9
2.4
33.3
48.8
49.6
0.0
1 crop rice + 1 crop vegetables
3.3
26.8
3.3
63.4
0.0
10.6
15.4
2 crop rice
466.5
598.1
351.1
368.1
1244.2
696.5
208.9
PI063-5
6
2 crop rice + 1 crop vegetables
0.0
93.5
191.8
0.0
0.0
163.3
12.2
Vegetables + industrial tree crops
0.0
31.7
22.8
5.7
41.4
5.7
4.1
Fields and gardens
0.0
0.0
0.0
0.0
0.0
0.0
0.0
Phu Bai Airport
1.6
0.0
0.0
0.0
0.0
0.0
0.0
Urban area
0.0
0.0
0.0
0.0
0.0
0.0
11.3
Fig. 6. Map of flooded area from 1 to 2m of landuse/cover types in Thua Thien - Hue Province
Flooded level from 0 to 1m
Result of calculation and map of flood level from 1 to 2m of landuse/cover types shows in the table
5 and figure 7 with flood time of half day.
Tab. 5. Flooded area from 0 to 1m of landuse/cover types In Thua Thien Hue Province
Landuse/cover types
Huong
Thuy
District
(ha)
Huong
Tra
District
(ha)
Phong
Dien
District
(ha)
Phu Loc
District
(ha)
Phu
Vang
District
(ha)
Quang
Dien
District
(ha)
Hue
City
(ha)
Rural area
26.3
21.0
27.5
109.6
16.9
24.0
0.0
Aquacalture ponds
104.8
28.5
56.7
50.1
120.6
55.8
0.0
1 crop rice + 1 crop vegetables
28.9
53.0
135.4
200.9
0.0
3.1
38.4
2 crop rice
428.6
797.6
1494.1
740.5
2098.5
818.5
198.5
2 crop rice + 1 crop vegetables
0.0
159.7
208.8
0.0
0.0
101.4
18.3
PI063-6
7
Vegetables + industrial tree crops
0.0
58.1
83.4
35.8
54.7
8.2
0.0
Fields and gardens
22.3
0.0
0.0
0.0
0.0
0.0
0.0
Phu Bai Airport
1.6
0.0
0.0
0.0
0.0
0.0
0.0
Urban area
0.0
0.0
0.0
0.0
0.0
0.0
14.4
Fig. 7. Map of flooded area from 0 to 1m of landuse/cover types in Thua Thien - Hue Province
4. DISCUSSION
4.1. DEM Development
With the spatial resolution of 2.5m, PRISM can be used to develop the DEM at scale of 1:10,000
and 1:25,000 in high accuracy. However, in order to develop DEM at this scale, it requested fields data to be
compatible. In here, fields data are the topographical map with equivalent scale and field survey data. In the
DEM development from satellite image, first and also important step is RPCs model development. In this
study, 102 GCPs points collect from basic map with scale of 1:25,000 and field survey were used to create
the RPCs with accuracy of 1.25 pixel. The correction of DEM result is very indispensable to improve the
DEM accuracy. The surface is covered by landuse/cover types such as forest, bush and building, when
correction of DEM result must know the distribution of landuse/cover types to correct DEM. For example,
in the areas with dense forest distribution of 20m of high trees, the spectrum of light to detector of the
satellite is leaves of tree, not surface. In the areas with palate terrain will have bigger error more than other
area in DEM development from satellite. So that, the rsuslt of DEM calculation is not exactly and need to
correct. In this study, area of dense forest and palate terrain distribute on the high mountain, the DEM
correction is reduced 3 to 20m for each different area based on map of landuse/cover. Other areas of study
PI063-7
8
area have lowly error in DEM development because of sparse landcovers. In order to assess the accuracy of
the DEM, 10 GCPs points have collected to compare with result of DEM development (table 6)
Tab. 6. The error of DEM
Name of point
Coodination
Height from
DEM
Height from
Basic map
Error (m)
X
Y
Nui Choi
812228
1808371
203
202
1
Vinh Phong
814269
1807646
462
465
3
Chay Lim
814898
1805887
539
536
3
Canh Duong
817132
1806291
187
184
3
Phuoc Tuong
811734
1802992
225
229
4
Cao Doi
805244
1803653
115
121
6
Da Bao
804322
1802215
246
248
2
Bach Thanh
802195
1802459
125
124
1
Ba Go
812138
1809796
132
134
2
Chan May
814998
1808846
102
106
4
Average error
2.9
Fig.7. DEM from Forward and Backward images of PRISM data in the Thua Thien - Hue Province
4.2. Flooded level
In order to calculate and map the flooded area of landuse/cover types at different flooded level must
identify the boundary of flood reach to which height by ovelaying DEM and map of flood area. The result of
calculation shows boundary of flood reach to 5m height. In this study, flooded level was divided into 4
PI063-8
9
levels. Flooded level higher 3m of height (zone 1) is correlative area where the terrain has elevation of 0 to
2m comparing mean sea level. Flooded level from 2 to 3m of height (zone 2) is the area where the terrain
has elevation of 2 to 3m, flooded level from 1 to 2m of height (zone 3) where the terrain has elevation of 1
to 2m and flooded level from 0 to 1m of height (zone 4) where the terrain has elevation of 0 to 1m. In those
zone, the area of zone 3 and 4 are higher more than the zone 1 and 2. In the zone 3 and 4, distribution of
landuse/cover types is mainly rural and urban area, rice and vegetables field, aquacalture ponds and
infrastructures. In the zone 1 and 2, the aquacalture ponds, rice and vegetables field is mainly. Flood can be
divided into different levels in order to assess damage of landuse/cover types based on scale of DEM.
4.3. Flooded time
The flooded time is one of important parameters to evaluate damage of landuse/cover types. The big
and hitorical flood such as historical flood happened on early of November 1999 in the Thua Thien - Hue
Province can be monitor by using multi temporal satellite image because flood time is long until 1 week.
The flood happened on early of Octobor 2007 in the Thua Thien - Hue Province is less than the historical
flood both scale, intensity and time (3 days). This flood is difficult to monitor by satellite data because flood
time is very short. In this study, calculation of flooded time is based on information from the People
Commutee of Thua Thien - Hue Province.
4.4. Damage level
Assessment of damage level of flood needs based on two groups of basic parameters: the first group
consists of parameters on flooded distribution area, level, time and landuse/cover types. The second group
includes specially knowledge on biology, architecture, construction and flooded objects. For example, if a
rice variety of A, B days old has been flooded of more than 3m in 2 days with area of S, so how many
percent of its productivity will reduce? This is a difficult problem for person who is not specialist of
agriculture. Therefore, in this study, the result is only the calculation of parameters in the first group
(flooded distribution area, level, time and objects). However, by using satellite data to calculate parameters
in the first group is quickly, cheapper and bigger calculated area comparing other method.
5. CONCLUSION
- A method of detecting and assessing damages due to flood by using ALOS satellite data is
developed.
- Map of landuse/cover in 2008, map of distribution of flooding areas at October 2
nd
2007 and a
DEM of Thua Thien Hue coastal area, with scale of 1:25000 are established from ALOS satellite data.
- Flooded level of landuse/ landcover types were calculated and represented on map. Rural area, 2
crops rice, 1 crop rice, 2 crops rice + 1 crop vegetables, 1 crop rice + 1 crop vegetables, vegetables +
industrial tree crops, urban area, aquaculture ponds were flooded heavily both area and level more than
other landuse/ landcover types.
- In this study, the assessment of flooded damages to landuse/cover types by using ALOS satellite
data has just quantify the flooded areas, level and time of landuse/ landcover types.
ACKNOWLEDGEMENTS
We would like to thank the JAXA for supporting the satellite images, and the Project “Solutions for
Environmental Contrasts in Coastal Area” for helping the cost of publication for this study.
REFERENCES
1. Ake Rosenqvist, Daisuke Ichitsubo, Yuji Osawa, Akihiro Matsumoto, Norimasa Ito and Takashi
Hamazaki, 2007. A brief overview of the Advanced Land Observing Satellite (ALOS) and its potential for
marine applications. The Journal of the Japan Society of Photogrammetry and Remote Sensing, Vol 46, No.
1, pp. 54-60.
2. DEM extraction of PRISM stereo from User’s Guide of PCI 10.2., 2007
3. DEM Extraction Module from ENVI., 2008
PI063-9
10
4. Eisenbeiss H., Baltsavias E. P., Pateraki M., Zhang L., 2004. Potential of IKONOS and QUICKBIRD
Imagery for Accurate 3D-Point Positioning, Orthoimage and DSM Generation. International Archives of
Photogrammetry, Remote Sensing andSpatial Information Sciences, 35 (B3), pp. 522-528.
5. Fraser C., Baltsavias E. P., Gruen A., 2002. Processing of IKONOS Imagery for Sub-meter 3D
Positioning and Building Extraction. ISPRS Journal of Photogrammetry & Remote Sensing, 56(3), pp. 177-
194.
6. Fraser C., Hanley H. B., 2003. Bias Compensation in Rational Functions for IKONOS Satellite Imagery.
Photogrammetric Engineering and Remote Sensing, 69(1), pp. 53-57.
7. Grodecki J., Dial G., 2003. Block Adjustment of High- Resolution Satellite Images Described by
Rational Polynomials. Photogrammetric Engineering and Remote Sensing, 69(1), pp. 59-68.
8. Gruen A., Kocaman S., Wolff K., 2007. Calibration and Validation of Early ALOS/PRISM Images. The
Journal of the Japan Society of Photogrammetry and Remote Sensing, Vol 46, No. 1, pp. 24-38.
9. Iwata T., 2003. Precision Geolocation Determination and Pointing Management for the Advanced Land
Observing Satellite (ALOS). IEEE/IGARSS 2003, Toulouse, France, July 21-25.
10. Tadono T., Shimada M., Watanabe M., Hashimoto T., Iwata T., 2004. Calibration and Validation of
PRISM Onboard ALOS. International Archives of Photogrammetry, Remote Sensing and Spatial
Information Sciences, Vol.XXXV part B1, pp. 13-18.
11. Trần Đình Lân, 2006. Development of GIS database from high resolution, multi temporal satellite data
and ground survey data to assess, detect coastline erosion and lagoon inlet change in Hai Duong – Hoa Duan,
period of 1980 – 2005. Final report. Stored at Institute of Marine Environment and Resources.
12. Trần Đức Thạnh, Trần Văn Điện và Đỗ Đình Chiến, 2002. Tam Giang – Cau Hai Inlet changes and
coastal floods. Marine research journal. Science and Technic Publishing House, Vol. XIII, pp. 119-127.
PI063-10