Non-performing loan recovery: The case of mongolia
Bạn đang xem bản rút gọn của tài liệu. Xem và tải ngay bản đầy đủ của tài liệu tại đây (506.67 KB, 17 trang )
<span class='text_page_counter'>(1)</span><div class='page_container' data-page=1>
<i> </i>
<i><b>Scientific Press International Limited </b></i>
<b>Non-Performing Loan Recovery: </b>
<b>The Case of Mongolia </b>
<b>Davaajargal Luvsannyam</b>1<b>, Enkhtur Minjuur</b>2<b>, Dulguun Lkhagvadorj</b>3<b> </b>
<b>and Enkhsuren Bekhbat</b>4
<b>Abstract </b>
In this study, the activities related to the recovery of non-performing loans were
considered in case of “Savings Bank” LLC. According to the survey, it takes an
average of 4.2 years to recover non-performing loans, and recovery rate is on
average 83 percent. The recovery rate of loans has been declining over time despite
the fact that it was high in the first years of the receiver's appointment. Furthermore,
the amount of non-performing loans recovered out-of-court was relatively small
compared to the amount of that recovered through the courts. Although in-court
activities to recover the non-performing loans takes 1.3 years more than out-of-court,
the recovery rate is 7% higher in terms of judicial proceedings.
<b>JEL classification numbers:</b>G21, G29, G33.
<b>Keywords: </b>Non-performing loans, Recovery rate, Banking sector.
1<sub> Director of Research Division, the Bank of Mongolia. </sub>
2<sub> Receiver of Savings Bank LLC. </sub>
3<sub> Senior economist, Research Division, the Bank of Mongolia. </sub>
4<sub> Senior Legal Counsel, office of Receiver of Savings Bank. </sub>
Article Info: <i>Received: </i>October 21, 2020<i>. Revised: </i>November 9, 2020.<i> </i>
</div>
<span class='text_page_counter'>(2)</span><div class='page_container' data-page=2>
<b>1.</b>
<b>Introduction </b>
Deteriorating bank lending quality is one of the main factors increasing the
vulnerability of the financial sector. For example, examples of international banking
and financial crises clearly show that the rapid growth of non-performing loans
(NPLs) can adversely affect banks' operations and lead to financial instability
(Demirgỹỗ Kunt and Detragiache, 1998; Gonzỏlez ‐ Hermosillo, 1999; Hoggarth
et al., 2004; Laeven, 2016). Therefore, strengthening the credit risk management of
the banking sector, improving the methods and practices for effective recovery of
non-performing loans, and taking other necessary measures are important to reduce
the cost of credit risk (Dimitrios, 2016).
Today, 14 commercial banks, 3 receivers (Zoos Bank, Savings Bank, Capital Bank)
and 538 non-bank financial institutions (NBFIs) are engaged in non-performing
assets (Non-Performing Loans or NPLs), in the financial sector of Mongolia.
However, in Mongolia, there are no previous reports, studies, analytical methods,
and experience on non-performing or bad loans.
This shows that since Mongolia's transition to a two-tier banking system, legislators,
policymakers, investors, and financial institutions have been without clear research
and public information on the methods, experience, timing, and efficiency of
non-performing loans recovery. For example, Mongolian legislators, policymakers, and
foreign and domestic investors often have asked the two questions, “What is the
average period for recovering non-performing loans?”; “What is the average
recovery rate for non-performing loans?”.
In addition, this type of international research has yielded different results
depending on the country's banking, financial, and economic characteristics in terms
of non-performing loan recovery methods, practices, policies, controls, and
regulations (Woo, 2000, Shih, 2004, Xu, 2005, Matoušek and Sergi, 2005).
Therefore, this is the first study conducted in Mongolia aims to clarify the above
two questions and find answers to other questions. In addition to laying the
groundwork for further research and analysis, their methods and practices needed
to identify, select and develop cost-effective methods and solutions for lowering
interest rates and non-performing assets in the country, this work will also be helpful
in reduction of interest rates and decrease in non-performing assets. Moreover, it is
important to support the search in optimal solutions.
The survey included information on a total of 660 (non-performing) assets (loans)
settled by the receiver of Savings Bank LLC from July 22, 2013 to December 31,
2019 used as a case study.
<b>1.1</b> <b>Assets in the balance of the receiver of the Bank in Savings Bank LLC </b>
On July 22, 2013, the Bank of Mongolia appointed the receiver to the Savings Bank
LLC and decided to liquidate Savings Bank LLC as a legal entity.
</div>
<span class='text_page_counter'>(3)</span><div class='page_container' data-page=3>
'bad assets' or a total of MNT 191.5 billion in assets and MNT 119.9 billion in
payables to others remained in the balance of the Savings Bank.
In addition to its NPLs, the Savings Bank's performing assets include
non-performing assets transferred from Mongol Post Bank (MPB) to the Savings Bank
in March 2010.
<b>1.2</b> <b>Survey data collection </b>
In the study, the NPLs of Mongol Post Bank transferred to the Savings Bank were
identified as “MPB NPLs” in terms of assets type, and the assets of the Savings
Bank were differentiated and compared. Assets marked “SB NPLs” are NPLs which
belongs to the Savings Bank.
Among the total assets of the Savings Bank, the loan files of the Mongol Post Bank
were incomplete, the loan interests were collected manually, the registrations were
offline, the statute of limitations for claiming the loan agreement expired before the
receiver was appointed, and the bank's registration software changed after the loans
were issued. The most common of these problems were disruption of the lending
transaction due to the change, inaccessibility, and discrepancies in the registration
due to incorrect entry of the borrower's personal information in the computer
program. Therefore, it should be noted that it was also the most challenging issue
to collect research data.
<b>1.3</b> <b>About the borrower's loan recovery process </b>
In accordance with the Banking Law, the receiver sells the above-mentioned
non-performing assets and transfers the assets transferred to the ownership of the
Savings Bank based on the loan liabilities, including the Deposit Insurance
Corporation, the Bank of Mongolia, the State Bank and the Tax Authority.
Regularly reports to the Bank of Mongolia on the progress, results, and risks of its
operations.
Since August 2017, the receiver has shifted its NPLs settlement to a “teamwork”
system and operates within the framework of the following principles. These
include:
• Repay NPLs in the shortest possible time and with the highest possible
amount,
• In each case of NPLs, to take legal action “to the point”,
• Take immediate measures to prevent the value of assets transferred as
collateral for NPLs from depreciation, depreciation, protection of value at
its current level and not to reduce its value.
</div>
<span class='text_page_counter'>(4)</span><div class='page_container' data-page=4>
<b>1.4</b> <b>About the selected indicators for collecting closed loan information: </b>
In this study, we analyzed a total of 660 closed loans based on the borrower's name,
registration number, customer registration, and associated account number for each
of the 38 indicators etc.
It should be noted that not all of the issues identified for each of these indicators are
covered in this report, as the purpose of identifying and selecting the 38 indicators
mentioned above is not only to write this research report but also to further study
asset management activities and develop activities in this area.
These indicators included in this report were selected based on the best possible
identification of the questions posed in this report, the best possible answers, and
the ranking of the most influential factors. For example, determining when a loan
was first issued, when it was last repaid when it was classified as a non-performing
loan, and when it went to court are important for accurately calculating the statute
of limitations for claiming a loan and repaying the loan.
Therefore, in addition to the above 38 indicators and other necessary information
related to the research period, it was analyzed by specific sub-sections and collected
for each indicator.
<b>1.5</b> <b>Determining the date of transfer to non-performing loans: </b>
Pursuant to Article 2.1.1 of the “Regulation on Asset Classification, Establishment
and Disbursement of Asset Risk Fund” approved by the joint order of the Governor
of the Bank of Mongolia and the Minister of Finance No. A-155,134 dated June 10,
2019, classified into categories. These three categories can be summarized in terms
of asset maturities in Table 1.
<b>Table 1: Classification of assets for credit risk management </b>
<b>2019.06.10 (А-155\134) </b> <b>2010.08.11 (475/182) </b>
№ Asset
classification
By payment
overdue days
Asset
classification
By payment
overdue
days
1 Performing ≤ 15; ≤ 30 Performing
2 Special mention ≤ 90 Special
mention ≤ 90
3 Non-Performing of which: Non-Performing of which:
3.1 Substandard 91 – 180 Substandard 91 – 180
3.2 Doubtful 181 – 360 Doubtful 181 – 360
3.3 Loss ≥ 361 Loss ≥ 361
</div>
<span class='text_page_counter'>(5)</span><div class='page_container' data-page=5>
determine exactly when each asset was classified as Loss. For some assets, this was
difficult to determine, so each asset was considered a non-performing loan from the
time it was classified as a non-performing asset. Therefore, for research purposes,
the “Non-performing” or “Loss” assets (NPLs) mentioned in this study can be
understood together as “Non-performing assets” or “Non-performing loans”.
In most cases, the date on which the loan was classified into the non-performing
category and the principles and interest balances on that day were used in the
calculation.
<b>1.6</b> <b>Difficulties in collecting information on closed loans and solutions: </b>
There were some difficulties in collecting information on the total of 660 closed
loans for each of the above indicators and categories. For example, many problems
have arisen, such as software discrepancies, incomplete files on loan, misspellings
of the borrower's name and registration number, which cannot be found in the
program, and have been resolved in an appropriate manner. Here are some of them:
• When classifying total loans, it was difficult to determine the amount and timing
of the initial disbursement due to differences in the software used to disburse
the loan. For example, loans disbursed before 2008 were often recorded offline
or manually, without any software, so the amount of the loan was determined
based on the amount of the loan, and the date of the loan agreement was
calculated as the date of disbursement. Prior to 2008, the Savings Bank and
Mongol Post Bank registered credit card rights in another program, which is
now available on only one computer at the State Bank. When the program
applied to the State Bank for borrower information, it was not complete, and it
took a lot of time. Therefore, for some loans, the Grape bank program
determines the amount for which the loan was first registered, the date the loan
was first issued, and the loan amount.
• Although the original date of issue is calculated from the date of the loan
transaction, as mentioned above, it was not possible to determine the exact
amount of the original loan for the loan granted at the time of offline registration
and card authorization. The bank determines the amount of loan disbursed and
the date of disbursement based on the balance installed in the program.
• To determine the amount of non-performing loans and the transition period to
</div>
<span class='text_page_counter'>(6)</span><div class='page_container' data-page=6>
• Some borrowers have a long credit history or have taken out multiple loans at
the same time, making it difficult to determine the amount of non-performing
loans, total loans disbursed, and loans repaid. An example of this is a pension
loan, in which a borrower borrows more than once, and the loan is accrued over
a long period of time, depending on the size of the pension and the interest rate,
such as a monthly loan. In this case, the date of the first loan is determined by
the date of the first loan, and the loan amount is calculated as the total loan
amount.
• For loans repaid in USD, it was not possible to convert the loan into MNT at the
current exchange rate due to a lack of information on each recovery date. The
loan is translated at the average exchange rate issued by the Bank of Mongolia
for the year in which the loan was transferred to the non-performing category.
<b>2.</b>
<b>General information </b>
Between 2013 and 2019, the receiver of the Savings Bank fully resolved 660
non-performing assets or loans with a total outstanding loan of MNT 21.0 billion. Of
which, 54% or 11.4 billion MNT was repaid in the performing category, and the
remaining 46% or 9.6 billion MNT in the non-performing category (Table 2).
<b>Table 2: Total loans and non-performing loans (2013-2019) </b>
By end of 2019, MNT 8.2 billion of the non-performing loans out of total MNT 9.6
billion have been recovered, and the recovery rate of non-performing loans each
year is ranging from 67% to 98%. During this period, the amount of loans increased
by 1.08 times and 22.6 billion MNT was repaid. Of the 660 non-performing assets
surveyed, the lowest value was MNT 39,000, whereas the highest was MNT 4
billion.
<b>Year</b> <b>Total </b>
<b>loans</b>
<b>Loans</b> <b>NPLs</b> <b>% of NPLs to total </b>
<b>loans</b>
<b>Amount of NPLs </b>
<b>repaid</b>
<b>Repayment rate </b>
<b>of NPLs</b>
<b>Total </b>
<b>repayment </b>
2013 1,643.0 468.2 1,174.8 72% 932.7 79% 1,568.8
2014 8,716.5 6,487.4 2,229.1 26% 1,637.8 73% 8,777.4
2015 2,865.6 1,206.6 1,659.0 58% 1,605.2 97% 3,896.7
2016 504.1 264.8 239.3 47% 187.4 78% 596.9
2017 506.3 187.6 318.7 63% 214.1 67% 536.8
2018 5,669.7 2,518.6 3,151.0 56% 3,081.8 98% 6,255.7
2019 1,132.9 291.6 841.3 74% 583.0 69% 1,016.2
</div>
<span class='text_page_counter'>(7)</span><div class='page_container' data-page=7>
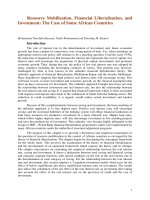
<b>Figure 1: Composition of NPLs, by assets forms (in stock)</b>
As for asset type, 67% of total non-performing loans or MNT 6,420 million are SB
NPLs, while 33% or MNT 3,193 million are long-term MPB NPLs. In terms of the
numbers, 70% or 462 are SB NPLs and 30% or 198 are MPB NPLs (Figure 1, 2).
<b>Figure 2: Total number of MPB NPLs and SB NPLs (in stock) </b>
Between 2013 and 2019, the average number of SB NPLs recovered was 66, while
the 28 MPB NPLs were recovered on average per year. The Figure 3 shows that the
number of SB NPLs recovered has been declining year by year, whereas the number
of MPB NPLs payments has been higher than the average in recent years. One of
the reasons for the increase in the number of MPB NPLs payments was the transfer
of NPLs recovery activities to a 'teamwork' system. This is because prior to August
2017, the Bank's receivership process traditionally mandated the settlement of many
more NPLs per individual or a NPL collector, rather than 'teamwork'. Because it
involves a large number of NPLs per person, there was a tendency to ‘sample’ from
985 1300
2394 2439 2570 2708 3193
190
2104
2668 2864 3051
6064
6420
47
246
349
432
508
597
660
0
100
200
300
400
500
600
700
0
2000
4000
6000
8000
10000
12000
2013 2014 2015 2016 2017 2018 2019
MPB NPLs
SB NPLs
Number of loan accounts
67%
33%
19 61 83
100 131
169 198
28
185
266
332
377
428
462
0
100
200
300
400
500
600
700
2013 2014 2015 2016 2017 2018 2019
MPB NPLs
SB NPLs
70%
</div>
<span class='text_page_counter'>(8)</span><div class='page_container' data-page=8>
the individual due to criteria such as the fastest, most reliable, least efficient, and
highest amount. As a result, the most active and least repayable NPLs were delayed.
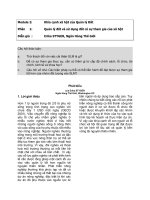
<b>Figure 2: Change in number of MPB NPLs and SB NPLs repaid </b>
This is due to the fact that the number of SB NPLs that can be repaid is decreasing
year by year, on the other hand, it is more difficult to repay, the borrower is reluctant
to repay, and there is little opportunity to go to court (no personal need, the expired
statute of limitations, etc.). In addition, the structure of non-performing assets is
classified as (i) the currency in which they are issued, (ii) the individual or legal
entity, (iii) the geographical location, and (iv) the judicial and non-judicial
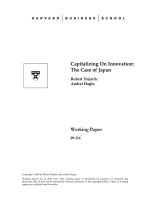
settlement, as shown in Figure 4.
• <i>Share of NPL issued in </i>
<i>domestic currency, MNT </i>
• <i>Share of NPL issued </i>
<i>to individuals </i>
• <i>Share of NPL settled </i>
<i>in-court </i>
• <i>Share of NPL issued </i>
<i>in Ulaanbaatar </i>
<b>Figure 3: Composition of NPLs by various categories </b>
According to the statistics showed in Figure 4, 67% of total non-performing loans
or MNT 6,421 million are issued in domestic currency, MNT, while 33% or MNT
3,192 million are issued in foreign currency.
Moreover, MNT 4,118 million or 43% of total non-performing loans are issued to
individuals and MNT 5,495 million are issued to legal entities. In terms of the court
activity, 64% of total non-performing loans are settled in court, while 36% of it
were settled out of court. Also, loans issued in the capital city, Ulaanbaatar,
accounted for 88% of total non-performing loans.
19
42
22
17
31
38
29
0
10
20
30
40
50
60
2013 2014 2015 2016 2017 2018 2019
MPB NPLs
28
157
81
66
45 51
34
0
50
100
150
200
2013 2014 2015 2016 2017 2018 2019
SB NPLs
</div>
<span class='text_page_counter'>(9)</span><div class='page_container' data-page=9>
<b>2.1</b> <b>Non-performing loan’s recovery time </b>
This section discusses the time required to recover a non-performing loan. If we
classify the total number of non-performing assets by term, half of them, or about
330 loans, were settled within 4 years (Figure 5). However, considering the number
of bills paid, it took a relatively long time, more than 4 years.
<b>Figure 4: Total number of MPB NPLs and SB NPLs (in stock)</b>
The time required to settle all non-performing assets is 4.2 years on average. In
terms of assets forms, the period of the MPB NPLs is 7.7 years, and the SB NPLs
is 2.7 years (Figure 6).
<b>Figure 5: Average period required to recover NPL (in years) </b>
Of these, the minimum time spent on court-settled assets is 134 days and the
maximum is 6,058 days or 16.6 years (including the time taken by the three-tier
237
87
64
34
22
1
1 7
49 <sub>42</sub>
68
31
0
50
100
150
200
250
up to 2 years 2-4 years 4-6 years 6-8 years 8-10 years more than 10 years
SB NPLs
MPB NPLs
2.7
7.7
SB NPLs
MPB NPLs
</div>
<span class='text_page_counter'>(10)</span><div class='page_container' data-page=10>
courts and the Executive Agency of Court Decision (EACD). The minimum time
spent on non-judicial assets is 4 days and the longest period is 4633 days or 12.7
years. In addition, the longest recovery period since the date of the loan was 24.5
years, and the loan was provided by Mongol Post Bank in 1993.
<b>Figure 6: Average period to recover NPL settled in court (in years) </b>
Also, the time required to recover a non-performing loan are varies depending on
solving the methods. For example, it takes an average of 6.2 years to resolve in a
court case, while a non-judicial process takes twice as short, 3.4 years (Figure 7).
This is the same trend in terms of asset forms, as both MPB NPLs and SB NPLs
take longer time to settle through the court.
<b>Figure 8: Average period required for recovery of NPL by loan registration </b>
<b>software </b>
Non-performing loans have different recovery periods due to differences in banking
registration software. For example, due to the transition to Grape software, the loan
recovery period has been reduced to 2.5 years (Figure 8).
6.1
8.1
4.6
3.4
7.4
2.0
Average MPB NPLs SB NPLs
In-court
Out-of-court
7.7
5.8
2.5
6.9 0
1
2
3
4
5
6
7
8Bank
Card
</div>
<span class='text_page_counter'>(11)</span><div class='page_container' data-page=11>
Of the 198 loans totaling MNT 6,167.8 million, 56% or 3,449 were repaid through
the EACD5<sub>, while the remaining 44% or MNT 2718.8 million were repaid without </sub>
access to the EACD (Table 3).
<b>2.2</b> <b>Volume of NPLs and recovery rate </b>
This section discusses the amount of non-performing loans recovered. Figure 9 and
10 compares the total loan outstanding with the amount repaid or repaid in terms of
the time taken to repay the loan. For example, as for loans that have been required
the up to 4 years to be recovered, the loan amount has been recovered by an average
of about 22 percent of the original loan amount (Figure 9).
<b>Figure 7: Ratio of repaid loans to total loans issued</b>
However, when the loan maturity was extended and it took about 8-10 years, about
74 percent of the loan balance was repaid. Looking at the total amount between
2013 and 2019, loans of MNT 20.0 billion were repaid to MNT 22.6 billion, or
108% of total loans.
5<sub> Executive Agency of Court Decision </sub>
1.23 1.22 <sub>1.14</sub>
1.10
0.74
1.06
1.09
0.0
0.5
1.0
1.5
2.0
2.5
up to 2 years 2-4 years 4-6 years 6-8 years 8-10 years more than 10
years
Total amount of repayment/Total loans issued
Average
<b>Table 3: Average period of execution of court decision for NPL recovery </b>
<b>Amount</b>
<b>/MNT million/</b> <b>% of</b> <b>Nnumber</b>
<b>Loans settled in court</b> <b>6167.8</b> <b>100%</b> <b>198</b>
of which: Court decisions executed by EACD 3449.0 56% 108
</div>
<span class='text_page_counter'>(12)</span><div class='page_container' data-page=12>
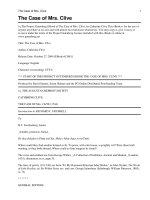
<b>Figure 8: Ratio of recovered NPLs to total NPLs (accumulated)</b>
In terms of non-performing loans, MNT 5,628 million out of MNT 6,168 million
were repaid, or 91% of the total non-performing loans. Non-judicial loans, on the
other hand, have a relatively low recovery rate of 76% (Figure 11).
<b>Figure 9: NPLs settled in-court and out-of-court (million MNT)</b>
Moreover, 198 loan claims equivalent to MNT 9,663 million were appealed to the
court, and of which MNT 8,748 million or 175 loan claims satisfied the court
decisions. Therefore, the percentage of court-satisfied claims is around 88-91%
(Table 4).
<b>Table 4: Claims and enforcement of court decisions </b>
79%
76%
82% 82% <sub>81%</sub>
87%
86%
8,242
9,613
75%
80%
85%
90%
95%
100%
0
2,000
4,000
6,000
8,000
10,000
12,000
2013 2014 2015 2016 2017 2018 2019
Recovery rate of NPLs (RHS)
Amount of NPLs recovered
Total NPLs
6,168
3,445
-5628
-2614
-8,000
-6,000
-4,000
-2,000
0
2,000
4,000
6,000
8,000
In-court Out-of-court
Total NPLs NPLs repaid
Rate of recovery 91% Rate of recovery 76%
Ratio
2: 1
<b>Number of NPLs</b> <b>Amount of NPLs /MNT million /</b>
Loan claims 198 9663
Enforcement of court decision 175 8748
</div>
<span class='text_page_counter'>(13)</span><div class='page_container' data-page=13>
<b>Figure 12: Interval of claims settlement ratio </b>
<b>(in terms of the amount of NPLs) </b>
If we look at the Figure 12 that shows the percentage of loan claims satisfied by the
court at intervals, 153 loan claims accounting to MNT 7,298 million were resolved
with the highest percentage of 90-100%. Figure 13 shows the comparisons of the
amount of recovered non-performing loans by specific categories.
<b>Figure 10: Interval of claims settlement ratio </b>
<b>(in terms of the amount of NPLs) </b>
Non-performing loan recovered in Ulaanbaatar accounts MNT 7,283 million and it
is 8 times higher than in rural areas. The amount of recovered non-performing loans
in cash equals to MNT 3,860 million and 1.1 times lower than the amount in assets
and others. The amount of non-performing loans with files is 16 times higher than
that without loan files.
<b>3.</b>
<b>The data and methodology </b>
As stated in section 1, data information is collected by the receiver of Savings Bank
LLC. By omitting the incomplete data, econometric analysis based on the total of
624 non-performing assets from July 22, 2013 to December 31, 2019.
In this section, we estimate empirical linear regression models in order to evaluate
148 <sub>0</sub> 15 5 18 23 572
1376
4 172
7298
0%
[0
%
,1
0
%]
(1
0
%
,2
0
%
]
(2
0
%
,3
0
%
]
(3
0
%
,4
0
%
]
(4
0
%
,5
0
%
]
(5
0
%
,6
0
%
]
(6
0
%
,7
0
%
]
(7
0
%
,8
0
%
]
(8
0
%
,9
0
%
]
(9
0
%
,1
0
0
%]
Claims (MNT million)
Average
87%
15
0 1 1 1 3 7 4 2 3
153
0%
[0
%
,1
0
%]
(1
0
%
,2
0
%
]
(2
0
%
,3
0
%
]
(3
0
%
,4
0
%
]
(4
0
%
,5
0
%
]
(5
0
%
,6
0
%
]
(6
0
%
,7
0
%
]
(7
0
%
,8
0
%
]
(8
0
%
,9
0
%
]
(9
0%
,1
00
…
Number of NPLs
Average
89%
3,860 ,
47%
4,300
, 52%
82 ,
1%
in cash in assets others
Ratio
1 : 1.1 7,288
, 88%
954 ,
12%
Ulaanbaatar Other provinces
Ratio
8 : 1
7,759
, 94% 483
, 6%
With loan file W/o loan file
</div>
<span class='text_page_counter'>(14)</span><div class='page_container' data-page=14>
what specific factors affecting recovery period and rate as in research questions.
The regression models are specified in equation 1.
𝑌<sub>𝑗𝑖</sub> = 𝛼<sub>0</sub> + 𝛼<sub>1</sub>𝑋<sub>𝑖</sub>+ 𝑒<sub>𝑖</sub> (1)
The dependent variable 𝑦<sub>1𝑖</sub> is the years required for NPL resolution (Model 1 and
Model 2), whereas 𝑦<sub>2𝑖</sub> is NPLs recovery rate that (Model 3 and Model 4). The
dependent variables are identical in all models and determined as follows:
𝑥1 = {1, if NPLs settled in − court<sub>otherwise 0;</sub>
𝑥2= {1,asset type is MPB NPLs <sub>otherwise 0;</sub>
𝑥3= {1, if registration system is Grape system <sub>otherwise 0;</sub>
𝑥4= {1, if borrower is individual<sub>otherwise 0;</sub>
𝑥5= {1,loans issued in UB<sub>otherwise 0;</sub>
𝑥6= {1,NPLs is in domestic currency<sub>otherwise 0;</sub>
𝑥7= {1,NPLs are resolved thorough EACD<sub>otherwise 0;</sub>
𝑥8= {1, if NPLs paid in cash<sub>otherwise 0;</sub>
𝑥9= {1, if borrower has loan file<sub>otherwise 0;</sub>
here, 𝑒𝑖 is residual term that is normal i.i.d. The model parameters are estimated
</div>
<span class='text_page_counter'>(15)</span><div class='page_container' data-page=15>
<b>Table 5: OLS estimation result </b>
<b>(Model 1) </b> <b>(Model 2) </b> <b>(Model 3) </b> <b>(Model 4) </b>
<b>Variables </b> 𝑦<sub>1</sub> 𝑦<sub>1</sub> 𝑦<sub>2</sub> 𝑦<sub>2</sub>
<b>In-court </b> 2.608* 1.289*** .0781* 0.0725**
[.384] [0.270] [.029] [0.0332]
<b>In-court*EACD </b> .221 0.185 0.0294
[.441] [0.302] [0.0326]
<b>MPB NPLs </b> 2.636*** 0.0306
[0.327] [0.0334]
<b>Grape system </b> -2.664*** 0.0595*
[0.351] [0.0376]
<b>Individual </b> -0.0885 -0.0603
[0.744] [0.146]
<b>Ulaanbaatar </b> -0.0364 0.0422**
[0.189] [0.0192]
<b>In domestic currency </b> -0.173 0.298
[0.800] [0.211]
<b>In cash </b> -2.426*** 0.585***
[0.263] [0.0477]
<b>With loan file </b> 0.661*** 0.0844**
[0.181] [0.0365]
<b>Constant </b> 3.384* 6.530*** .80844* -0.0662
[.156] [1.067] [.0180] [0.251]
<b>Observations </b> 624 624 624 624
<b>R-squared </b> 0.135 0.664 0.01 0.374
Robust standard errors in brackets
*** p<0.01, ** p<0.05, * p<0.1
</div>
<span class='text_page_counter'>(16)</span><div class='page_container' data-page=16>
In the case of through the EACD, the loan recovery period has been slightly
extended by 0.19 years, but it is not statistically significant. Loans to legal entities
are repayable over a relatively long period of time, which means that some loans
can be borrowed through another company, run the business, the company has no
real assets, no location, is a 'paper company', and has many other loan liabilities.
Moreover, depending on the location of the receiver and the availability of
manpower, the lender has more communication and control over the loan if the
borrower resides in Ulaanbaatar. As a result, Ulaanbaatar has repaid more loans
(recovery rate is 4% higher than other areas) that have not been repaid for many
years and are more difficult to repay than loans issued in the local area. The same
is true for loans with files.
The receiver seeks to repay the loan in cash, and if it is not possible to repay the
loan in cash and it takes a long time to repay in cash, the borrower assets are taken
to liquidate the non-performing loan. Therefore, in terms of time, it took longer than
a loan repaid in cash.
<b>4.</b>
<b>Conclusion </b>
This study is the first of its kind to attempt to determine the average maturity and
average recovery rate of non-performing loans. The average maturity to recover the
non-performing loans is 4.2 years and recovery rate are 83 percent. Although the
recovery rate of NPLs was high in the first years of the receiver’s appointment, the
recovery rate has been declining over time.
However, the amount of non-judicial payments was relatively small compared to
the amount of NPLs paid in-court, but in terms of time, it took almost 1.3 years
more. The minimum time spent on judicial assets was 134 days (0.4 years) and the
maximum was 16.6 years, while the time spent on non-judicial assets was a
minimum of 1 day and a maximum of 12.7 years. The amount of non-performing
loans in Ulaanbaatar are eight times greater and recovery rate is 4% higher than that
in rural areas. The repaid amount of non-performing loans with loan files is 16 times
higher than the repaid amount of non-performing loans without loan files. If
borrower has loan file NPL recovery period is 0.6 years less and recovery rate is 8%
higher than one without file.
</div>
<span class='text_page_counter'>(17)</span><div class='page_container' data-page=17>
<b>Referents </b>
[1] Crises: Evidence from Developed and Developing Countries. IMF Staff papers
Vol. 45, No. 1.
[2] Dimitrios, A. (2016). Management and Resolution methods of
Non-performing loans: A Review of the Literature. MPRA Paper No. 77581, Athens
University of Economics and Business.
[3] González‐Hermosillo, B. (1999). Determinants of ex‐ante banking system
distress: A macro empirical exploration of some recent episodes. IMF. IMF
Working Paper, 33.
[4] Hoggarth, G., Reidhill, J., and Sinclair, P. (2004). On the resolution of banking
crises: theory and evidence. Bank of England. BOE Working Paper.
[5] Laeven, L. (2016). Banking Crises: A Review. The Annual Review of
Financial Economics, 3(1). doi:10.1146/annurev-financial-102710-144816
[6] Matoušek, R., and Sergi, B. (2005). ‘Management of Non-Performing Loans
in Eastern Europe. Journal of East-West Business, 11 (1), 141-166.
[7] Shih, V. (2004). ‘Dealing with Non-Performing Loans: Political Constraints
and Financial Policies in China. The China Quarterly.
[8] Woo, D. (2000). ‘Two Approaches to Resolving Nonperforming Assets
During Financial Crises. International Monetary. Washington, D.C.:: IMF
Working Paper No. 00/33.
[9] Xu, M. (2005). ‘Resolution of Non-Performing Loans in China’. School of
</div>
<!--links-->