- Trang chủ >>
- Mầm non >>
- Mẫu giáo bé
Co-digestion of domestic wastewater and organic fraction of food waste using anaerobic membrane bioreactor: A pilot scale study
Bạn đang xem bản rút gọn của tài liệu. Xem và tải ngay bản đầy đủ của tài liệu tại đây (1 MB, 6 trang )
<span class='text_page_counter'>(1)</span><div class='page_container' data-page=1>
<b>Vietnam Journal of Science,</b>
<b>Technology and Engineering</b>
71march 2021 • Volume 63 Number 1
<b> Introduction</b>
Municipal wastewater and solid waste from
decentralized residential areas and independent-stationed
military units are rapidly increasing because of remarkable
population growth. Almost all of this wastewater has not
yet been treated to meet to allowable standards due to its
distance away from wastewater treatment plants. Besides,
municipal solid waste is also difficult to treat because of
high cost and the generation of secondary pollution from
landfills. Generally, these wastes are usually collected
and treated separately by aerobic biological technologies,
which leads to high cost, high energy consumption, and is
ineffective for decentralized discharge sources. Meanwhile,
anaerobic biological degradation is a technology that poses
many advantages, such as low waste sludge and low energy
consumption, while offering superb energy recovery potential
from biogas, which reduces greenhouse gas emission and
increases the energy recovery from waste treatment effluent
[1, 2] However, the application of anaerobic technology has
been limited by its long biomass retention time and poor
biomass settling, leading to washout of biomass from the
effluent [1, 3]. In order to overcome these disadvantages,
recent research has developed membrane technologies;
specifically, a submerged membrane technology that permits
retaining complete microbial biomass in the reactor while
also maintaining low reactor volume [4]. With regard to
the recovery of biogas, a fraction of organic food waste can
increase the biogas yield thanks to the growth of influent
organic loading. Theoretically, the obtained CH<sub>4</sub> yield from
anaerobic digestion is about 0.35 m3<sub>/kgCOD</sub>
removed. Research
results achieved by some scholars have shown a similar
or lesser CH<sub>4</sub> yield when conducting experiments with a
mixture of wastewater and the organic fraction of solid waste
in anaerobic digestion. For instance, in Gouveia’s research
that uses a pilot scale anaerobic membrane bioreactor
<b>Co-digestion of domestic wastewater and </b>
<b>organic fraction of food waste using anaerobic </b>
<b>membrane bioreactor: a pilot scale study</b>
<b>Hong Ha Bui1<sub>,</sub><sub>Lan Huong Nguyen</sub>2*<sub>, Thanh Tri Nguyen</sub>1<sub>, Phuoc Dan Nguyen</sub>3</b>
<i>1<sub>Institute for Tropicalization and Environment (ITE), Vietnam</sub></i>
<i>2<sub>Ho Chi Minh city University of Food Industry (HUFI), Vietnam</sub></i>
<i>3<sub>Ho Chi Minh city University of Technology, Vietnam</sub></i>
Received 24 February 2020; accepted 20 July 2020
<i> </i>
<i>*<sub>Corresponding author: Email: </sub></i>
<i><b>Abstract:</b></i>
<b>In this study, a co-digestion pilot scale study of a </b>
<b>mixture of domestic wastewater and the organic </b>
<b>fraction of food waste using an anaerobic membrane </b>
<b>bioreactor was developed. The results show that the </b>
<b>removal efficiencies of the chemical oxygen demand </b>
<b>(COD) and total suspended solids (TSS) were high </b>
<b>and reached more than 90%. However, the removal </b>
<b>of nitrogen and phosphate was not remarkable. The </b>
<b>daily biogas yield reached 2.12 m3<sub>/d. The obtained </sub></b>
<b>biogas per COD removed was 0.22 m3<sub>/kgCOD</sub></b>
<b>removed. </b>
<b>The average generated methane yield was 1.33 m3<sub>/d, </sub></b>
<b>which is equivalent to 0.14 m3<sub>/kgCOD</sub></b>
<b>removed. A high </b>
<b>efficiency of organic compound removal combined with </b>
<b>a large amount of retained nutrients and high biogas </b>
<b>yield suggests the results of this pilot scale study can </b>
<b>be practically applied to the recovery of nutrients for </b>
<b>agricultural use along with biogas for cooking. These </b>
<b>benefits remarkably reduce environmental pollution, </b>
<b>especially for decentralized residential areas and </b>
<b>independent-stationed military units located far from </b>
<b>concentrated wastewater treatment plants. </b>
<i><b>Keywords:</b></i><b> anaerobic, AnMBR, biogas yield, co-digestion, </b>
<b>domestic wastewater, food waste, pilot scale.</b>
</div>
<span class='text_page_counter'>(2)</span><div class='page_container' data-page=2>
<i><b>Life ScienceS </b></i>|<i> Biotechnology</i>
<b>Vietnam Journal of Science,</b>
<b>Technology and Engineering</b>
72 march 2021 • Volume 63 Number 1
(AnMBR) for the treatment of municipal wastewater, the
methane yield achieved 0.18-0.23 Nm3<sub> CH</sub>
4/kg CODremoved
[5]. An AnMBR combined with activated carbon (GAC) was
studied by Gao, et al. (2014) [6] to treat urban wastewater
and obtained a methane yield of 140, 180, and 190 l
CH<sub>4</sub>/kgCOD<sub>removed</sub> corresponding to a hydraulic retention
time (HRT) of 8, 6, and 4 h, respectively. Galib, et al. (2016)
[7] studied the treatment of food wastewater by anaerobic
membrane (AnMBR) with a retention time of 5 d, 2 d, and 1
d and the biogas production generated ranged from 0.13 to
0.18 l CH<sub>4</sub>/gCOD<sub>removed</sub>.
Anaerobic membrane technology has been widely
applied to the treatment of various biodegradable wastewater
on both the lab and pilot scale, such as a pilot AnMBR for the
treatment of urban wastewater [8] and the decolonization of
dye wastewater [9]. Anaerobic co-digestion of wastewater
and solid waste have also been investigated by scholars over
recent decades, for example, Lim (2011) [10] conducted a
study on the co-digestion of a mixture of brown wastewater
and food waste and the co-digestion of food waste and
domestic wastewater by an upflow anaerobic sludge blanket
(UASB) [11]. The mechanism of anaerobic digestion is the
conversion of organic matter into valuable biogas without
energy consumption. However, rarely has a study of the
co-digestion of a mixture of wastewater and food waste
submerged in an anaerobic membrane bioreactor (AnMBR)
been conducted, especially a pilot scale study.
Therefore, in this work, a pilot scale study using the
anaerobic co-digestion of a mixture of wastewater and
organic fraction of food waste in a constantly-stirred,
submerged anaerobic membrane bioreactor set up at an
independent-stationed military unit far from residential
areas. Based on the practical data collected of the discharge
amount of domestic wastewater and organic fraction of
food waste at various independent-stationed military units,
together with inherited lab scale study results, the study
found a suitable mixture ratio between these wastes to
conduct the pilot scale study. Hence, the aim of this study
is to evaluate the removal efficiency of organic compounds
(COD), nutrients (N, P), total suspended solid, and
pathogens and to estimate the biogas yield produced from
the pilot scale co-digestion process.
<b>Materials and methods</b>
<i><b>Domestic wastewater (DWW) and organic fraction of </b></i>
<i><b>food waste (OFFW)</b></i>
Domestic wastewater was directly taken from the septic
tank at Radar Station 33 of the independent-stationed
military unit in Ba Ria-Vung Tau province, Vietnam. The
characteristics of this wastewater are presented in Table 1.
<b>Table 1. Properties of domestic wastewater.</b>
<b>No.</b> <b>Parameter</b> <b>Unit</b> <b>Value (n=10)</b>
1 pH - 7.1±0.5
2 COD mg/l 152.0±51.0
3 TN mg/l 113.05±18.5
4 N-NH4+ mg/l 103.08±11.8
5 TP mg/l 8.95±1.25
6 TSS mg/l 82.0±23.0
Food solid waste was collected from the residue of the
kitchen at Radar Station 33, which included rice, fruit, and
vegetable remains as well as meat and fish residues. The
collected solid waste was then removed of its inorganic
components (i.e. grit and plastic). In the next step, the
residues were cut into small pieces and blended by blender to
a size less than 0.5 mm. Finally, blended OFFW (BOFFW)
samples were stored in plastic containers and kept in the
refrigerator at 4o<sub>C. The characteristics of blended organic </sub>
fraction of food waste are shown in table 2.
<b>Table 2. Characteristics of blended organic fraction of food </b>
<b>waste (bOFFW).</b>
<b>No.</b> <b>Parameter</b> <b>Unit </b> <b>Value (n=3)</b>
1 pH - 6.8±0.5
2 Moisture % 86.0±2.0
3 C/N - 32.0±1.03
4 TS g/kg wet 235.0±13.0
5 VS g/kg wet 213.0±12.0
Based on the data collected of the discharge of domestic
wastewater and solid waste at ten independent-stationed
military units and some decentralized residential areas
(data not shown), the ratio of BOFFW to DWW was at
5:1 (5 kg of BOFFW:1 m3<sub> of DWW). After mixing, the </sub>
characteristics of the influent of the AnMBR-CSTR system
are presented in table 3.
<b>Table 3. Characteristic of influent wastewater after a mixture.</b>
<b>No.</b> <b>Parameter </b> <b>Unit</b> <b>Value (n=3)</b>
1 pH - 7.3±0.3
2 COD mg/l 2093.0±126.0
3 TN mg/l 188.4±17.3
4 N-NH4+ mg/l 130.2±7.9
5 P-PO43- mg/l 6.0±0.3
</div>
<span class='text_page_counter'>(3)</span><div class='page_container' data-page=3>
<b>Vietnam Journal of Science,</b>
<b>Technology and Engineering</b>
73march 2021 • Volume 63 Number 1
<i><b>Set up treatment model</b></i>
Because anaerobic sludge was not available, the sludge
for this model was cultivated from probiotics, cow dung,
and mud (500 l). The microbial culture process was carried
out over 35 d. Firstly, the cow dung was finely ground then
mixed with probiotic and molasses according to the ratio
presented in Table 4. The mixture was then pumped into
anaerobic tanks that contained the available wastewater. In
the following step, the wastewater was stirred completely
such that microorganisms make thorough contact with
the cow dung, molasses, and sewage contained in the
wastewater. The supplemented substrates were calculated
as follows.
The initial culture sludge volume required to add into
the tank:
V<sub>s</sub> = (V×C)/MLSS = (5000×6000)/11200 ≈ 2678.6 (l)
(choose 2.7 m3<sub>)</sub>
where V<sub>s</sub> is the volume (l) of sludge to be added to the
tank, V is the volume (l) of the mixing anaerobic tank, C
is the optimal anaerobic sludge concentration in the mixing
tank with a range of 4000≤C≤6000 mg/l and C=6000 mg/l
was chosen for this study, and MLSS is the concentration
of anaerobic sludge added to the original tank, where
MLSS=11200 mg/l.
The amount of probiotics, molasses, cow dung, clean
water, and sewage added is presented in Table 4.
<b>Table 4. The supplemented substrates used to cultivate </b>
<b>microbials in the setup stage of the model.</b>
<b>Stage Time <sub>(d)</sub></b>
<b>Supplemented substrates</b>
<i><b>Wastewater </b></i>
<i><b>(m</b><b>3</b><b><sub>)</sub></b></i>
<i><b>Fresh </b></i>
<i><b>water </b></i>
<i><b>(m</b><b>3</b><b><sub>)</sub></b></i>
<i><b>Organic </b></i>
<i><b>fraction of </b></i>
<i><b>food waste </b></i>
<i><b>(kg)</b></i>
<i><b>Probiotic </b></i>
<i><b>(g)</b></i> <i><b>Cow dung </b><b>(kg)</b></i> <i><b>Molasses </b><b>(g)</b></i>
1 1-5 1 3 5 100 5 200
2 6-13 2 3 10 200 10 400
3 14-20 3.5 1.5 17.5 200 10 300
4 21-35 5 0 25 100 0 200
During the sludge culture process, the sludge volume
must be checked and compared with the volume of sludge
needed for the treatment process by turning off the agitator,
letting the sludge settle for 30 min, and then measuring the
volume of sludge. If the amount of obtained sludge was less
than that of above-calculated sludge amount, the cultivating
process needs to continue. If the amount of obtained sludge
was enough or more than 10% in comparison with the
calculated amount, the cultivating process was stopped.
<i><b>The pilot model description</b></i>
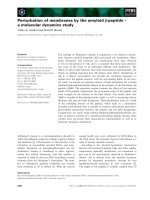
The pilot AnMBR-CSTR model is shown in Fig. 1. The
model consists of an anaerobic continuous stirred reactor
(AnCSTR) of 5 m3<sub> total volume with a diameter of 1.42 m, </sub>
a height of 3.44 m, and a membrane tank that has the same
total volume as the AnCSTR. One ultrafiltration membrane
module (0.05 µm pore size) with a total membrane surface
area of 10 m2<sub> was placed in this membrane tank. The model </sub>
was operated with a flux of 10-50 l/m2<sub>h.</sub>
<b>Fig. 1. The pilot scale anMbR-CSTR model.</b>
<i><b>Operation of the</b><b> model</b></i>
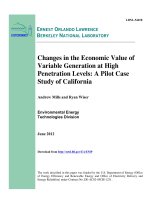
Figure 2 shows the flow diagram of the pilot model. The
system’s treatment medium flowrate was 210 l/h. The pilot
system consisted of one continuous-stirred anaerobic tank
with a volume of 10 m3<sub> and one submerged membrane tank </sub>
with the same volume. Both tanks were connected each other
to ensure that the sludge concentration in the two modules
were the same and a circulating pump was continuously
operated to circulate sludge from the membrane tank into
the anaerobic continuously-stirred tank. The pilot model
was fed with wastewater pre-treated as above description.
The wastewater was first pumped into the anaerobic
continuously-stirred tank. The AnCSTR was completely
mixed using a paddle to increase the contact between the
anaerobic sludge and the wastewater. After a certain retention
time period, the wastewater was continuously pumped into
the membrane tank. Both modules were equipped with
biogas, temperature, and pressure meters. In order to control
membrane fouling and maintain of the trans-membrane
pressure (TMP), the membrane was cleaned with an operating
cycle of 3 min of backwash, 5 sec of relaxation time, and
</div>
<span class='text_page_counter'>(4)</span><div class='page_container' data-page=4>
<i><b>Life ScienceS </b></i>|<i> Biotechnology</i>
<b>Vietnam Journal of Science,</b>
<b>Technology and Engineering</b>
74 march 2021 • Volume 63 Number 1
<b>Fig. 2. Process flow diagram of the pilot scale anMbR.</b>
The operation conditions of AnMBR-CSTR were
summarized in Table 5.
<b>Table 5. anMbR system operation parameters.</b>
<b>Parameter</b> <b>Symbol</b> <b>Unit</b> <b>Value</b>
pH pH - 7-8
Temperature - o<sub>C</sub> <sub>32.4-34.7</sub>
Hydraulic retention time HRT d 2
Sludge retention time SRT d 60
Organic load OLR kg COD/m3<sub>.d <1.3</sub>
Effective volume of the system V m3 <sub>10</sub>
Flow input Q m3<sub>/d</sub> <sub>5</sub>
<i><b>Analysis</b></i>
The pH, COD of the influent, effluent, and membrane
tank, and biogas yield in the effluent were analysed on a
daily basis. TSS, N-NH<sub>4</sub>+<sub>, and P-PO</sub>
43- were measured at
every other day. The operation time (total time of model)
was 60 d.
The pH was measured by an online pH meter system that
was directly installed into the treatment system. The COD,
TSS, N-NH<sub>4</sub>+<sub>, and P-PO</sub>
43- were determined according to
the standard methods for the examination of water and
wastewater (APHA, 2012). The biogas yield was regularly
monitored by an airflow measurement system and the
obtained data were analysed using computer software.
<b>Results and discussion</b>
During 60 operation days, the pH of the influent and
effluent of the AnMBR-CSTR at a SRT of 48 h ranged
between 6.8-7.9±0.3 and 6.7-7.8±0.3, respectively. The pH
was quite stable during the anaerobic degradation process
of the mixture of BOFFW and DWW and suitable for
the growth of anaerobic microorganisms. The pH of the
effluent was slightly higher than that of the influent due
to the accumulation of volatile fatty acids (VFAs) during
acidification stage. However, the fluctuation of the pH was
not significant, which showed there was a good balance
between the metabolism of acidification and methane groups.
<i><b>Total suspended solids (TSS) removal</b></i>
The data in Fig. 3 shows the TSS of the influent and
effluent and TSS removal efficiency of the pilot scale
AnMBR-CSTR over a 60-d period of operation. It can
be seen from Fig. 3 that despite the very high TSS in the
influent, the effluent’s TSS was low. The highest TSS
removal efficiency reached greater than 95%.
The average TSS concentration in the influent was 844
mg/l and the TSS in the effluent was 52 mg/l. This result
can be explained due to the presence of the ultrafiltration
module in the AnMBR-CSTR system. The results were
similar to the results obtained by a lab scale co-digestion
model [12] and other studies [4, 5, 8, 9].
<b>Fig. 3. The TSS removal efficiency. </b>
<i><b> The removal efficiency of COD </b></i>
The influent and effluent COD and COD removal efficiency are presented in Fig. 4. A
total removal efficiency higher than 90% was achieved with total COD values in the
effluent ranging from 103 to 182 mg/l during the 60-d operation period despite an
excellent COD in the influent (1807-2300 mg/l). The COD in the effluent was fairly
stable during the treatment process. With the same HRT of 48 h, the pilot scale
AnMBR-CSTR gave a similar removal efficiency of COD to the lab scale AnMBR-AnMBR-CSTR [12].
<b>Fig. 4. The COD removal efficiency. </b>
<i><b> Nitrogen and phosphorus removal </b></i>
The data in Fig. 5A and 5B show the concentrations of N-NH4+ and TKN,
respectively, in the influent and effluent of the pilot scale AnMBR-CSTR. As can be seen
from Fig. 5A, the N-NH4+ in the influent and effluent of was high and reached 112-149
mg/l and 139-198 mg/l, respectively. There was an increase in N-NH4+ in the effluent,
which can be explained by the anaerobic degradation process where organic nitrogen
derived from urine and some food wastes were converted into ammonium nitrogen by
anaerobic microbial. Additionally, a part of N-NH4+ is used for cell synthesis of
microorganisms. The results in Fig. 5B indicate that the TKN in the influent and effluent
was significantly changed. From Fig. 5A and 5B, it can be seen that most of the N-TKN
in the wastewater existed in the form of N-NH4+. These results agree with the work of
Gouveia, et al., 2015 [5].
80
85
90
95
100
0
200
400
600
800
1000
1 5 9 13 17 21 25 29 33 37 41 45 49 53 57
<b>TS</b>
<b>S </b>
<b>re</b>
<b>m</b>
<b>ov</b>
<b>al</b>
<b> e</b>
<b>fficie</b>
<b>nc</b>
<b>y </b>
<b>(%)</b>
<b>TS</b>
<b>S </b>
<b>(m</b>
<b>g/</b>
<b>l)</b>
<b>Time (day)</b>
Influent (mg/l) Effluent (mg/l) Removal efficiency (%)
80
82
84
86
88
90
92
94
96
98
100
0
500
1000
1500
2000
2500
1 5 9 13 17 21 25 29 33 37 41 45 49 53 57
<b>tC</b>
<b>OD</b>
<b> r</b>
<b>em</b>
<b>ov</b>
<b>al</b>
<b> e</b>
<b>fficie</b>
<b>nc</b>
<b>y </b>
<b>(%)</b>
<b>tC</b>
<b>OD</b>
<b> (m</b>
<b>g/</b>
<b>l)</b>
<b>Time (day)</b>
Influent (mg/l) Effluent (mg/l) Removal efficiency (%)
<b>Fig. 3. The TSS removal efficiency. </b>
<i><b>The removal efficiency of COD</b></i>
The influent and effluent COD and COD removal
efficiency are presented in Fig. 4. A total removal efficiency
higher than 90% was achieved with total COD values in
the effluent ranging from 103 to 182 mg/l during the 60-d
operation period despite an excellent COD in the influent
(1807-2300 mg/l). The COD in the effluent was fairly stable
during the treatment process. With the same HRT of 48
h, the pilot scale AnMBR-CSTR gave a similar removal
efficiency of COD to the lab scale AnMBR-CSTR [12].
<b>Fig. 3. The TSS removal efficiency. </b>
<i><b> The removal efficiency of COD </b></i>
The influent and effluent COD and COD removal efficiency are presented in Fig. 4. A
total removal efficiency higher than 90% was achieved with total COD values in the
effluent ranging from 103 to 182 mg/l during the 60-d operation period despite an
excellent COD in the influent (1807-2300 mg/l). The COD in the effluent was fairly
stable during the treatment process. With the same HRT of 48 h, the pilot scale
AnMBR-CSTR gave a similar removal efficiency of COD to the lab scale AnMBR-AnMBR-CSTR [12].
<b>Fig. 4. The COD removal efficiency. </b>
<i><b> Nitrogen and phosphorus removal </b></i>
The data in Fig. 5A and 5B show the concentrations of N-NH4+ and TKN,
respectively, in the influent and effluent of the pilot scale AnMBR-CSTR. As can be seen
from Fig. 5A, the N-NH4+ in the influent and effluent of was high and reached 112-149
mg/l and 139-198 mg/l, respectively. There was an increase in N-NH4+ in the effluent,
which can be explained by the anaerobic degradation process where organic nitrogen
derived from urine and some food wastes were converted into ammonium nitrogen by
anaerobic microbial. Additionally, a part of N-NH4+ is used for cell synthesis of
microorganisms. The results in Fig. 5B indicate that the TKN in the influent and effluent
was significantly changed. From Fig. 5A and 5B, it can be seen that most of the N-TKN
in the wastewater existed in the form of N-NH4+. These results agree with the work of
Gouveia, et al., 2015 [5].
80
85
90
95
100
0
200
400
600
800
1000
1 5 9 13 17 21 25 29 33 37 41 45 49 53 57
<b>T</b>
<b>SS</b>
<b> r</b>
<b>em</b>
<b>ov</b>
<b>al</b>
<b> e</b>
<b>fficie</b>
<b>nc</b>
<b>y </b>
<b>(%)</b>
<b>T</b>
<b>SS</b>
<b> (m</b>
<b>g/</b>
<b>l)</b>
<b>Time (day)</b>
Influent (mg/l) Effluent (mg/l) Removal efficiency (%)
80
82
84
86
88
90
92
94
96
98
100
0
500
1000
1500
2000
2500
1 5 9 13 17 21 25 29 33 37 41 45 49 53 57
<b>tC</b>
<b>OD</b>
<b> r</b>
<b>em</b>
<b>ov</b>
<b>al</b>
<b> e</b>
<b>fficie</b>
<b>nc</b>
<b>y </b>
<b>(%)</b>
<b>tC</b>
<b>OD</b>
<b> (m</b>
<b>g/</b>
<b>l)</b>
<b>Time (day)</b>
Influent (mg/l) Effluent (mg/l) Removal efficiency (%)
</div>
<span class='text_page_counter'>(5)</span><div class='page_container' data-page=5>
<i><b>Life ScienceS |</b> Biotechnology</i>
<b>Vietnam Journal of Science,</b>
<b>Technology and Engineering</b>
75march 2021 • Volume 63 Number 1
<i><b>Nitrogen and phosphorus removal</b></i>
The data in Figs. 5A and 5B show the concentrations of
N-NH<sub>4</sub>+<sub> and TKN, respectively, in the influent and effluent </sub>
of the pilot scale AnMBR-CSTR. As can be seen from Fig.
5A, the N-NH<sub>4</sub>+<sub> in the influent and effluent of was high and </sub>
reached 112-149 and 139-198 mg/l, respectively. There was
an increase in N-NH<sub>4</sub>+<sub> in the effluent, which can be explained </sub>
by the anaerobic degradation process where organic nitrogen
derived from urine and some food wastes were converted into
ammonium nitrogen by anaerobic microbial. Additionally, a
part of N-NH<sub>4</sub>+<sub>is used for cell synthesis of microorganisms. </sub>
The results in Fig. 5B indicate that the TKN in the influent
and effluent was significantly changed. From Fig. 5A and
5B, it can be seen that most of the N-TKN in the wastewater
existed in the form of N-NH<sub>4</sub>+<sub>. These results agree with the </sub>
work of Gouveia, et al. (2015) [5].
<b>Fig. 5. Nitrogen removal (A) N-NH4+, (B) TKN. </b>
The P-PO43- concentration also significantly changed. The results in Fig. 6 indicate
that there was a slight decline in P-PO43- in the effluent, ranging from 6.0 mg/l to 3.9
mg/l. This decline in phosphorus is due to its use for the synthesis of microorganism
cells.
<b>Fig. 6. Phosphate removal. </b>
<i><b> Biogas Yield </b></i>
The measured daily biogas yield had an average value of 2.12 m3<sub>/d (the highest was </sub>
2.56 m3<sub>/d and the lowest was 1.76 m</sub>3<sub>/d). The amount of obtained biogas per removed </sub>
COD was 0.22 m3<sub>/kg COD</sub>
removed (the highest was 0.24 m3/kgCODremoved and the lowest
was 0.19 m3<sub>/kgCOD</sub>
removed). The biogas yield data is presented in Fig. 7.
50.0
70.0
90.0
110.0
130.0
150.0
170.0
190.0
210.0
1 5 9 13 17 21 25 29 33 37 41 45 49 53 57
<b>N</b>
<b>-NH</b>
<b>4</b>
<b>+ (m</b>
<b>g/</b>
<b>l)</b>
<b>Time (day)</b>
Influent (mg/l) Effluent (mg/l)
0
50
100
150
200
250
1 5 9 13 17 21 25 29 33 37 41 45 49 53 57
<b>T</b>
<b>KN</b>
<b> (m</b>
<b>g/</b>
<b>l)</b>
<b>Time (day)</b>
Influent (mg/l) Effluent (mg/l)
0.0
1.0
2.0
3.0
4.0
5.0
6.0
7.0
1 5 9 13 17 21 25 29 33 37 41 45 49 53 57
<b></b>
<b>P-PO</b>
<b>4</b>
<b>3-(m</b>
<b>g/</b>
<b>l)</b>
<b>Time (day)</b>
Influent (mg/l) Effluent (mg/l)
<b>(A) </b>
<b>(B) </b>
<b>Fig. 5. Nitrogen removal (a) N-NH4+, (b) TKN.</b>
The P-PO<sub>4</sub>3-<sub> co</sub><sub>ncentration also significantly changed. </sub>
The results in Fig. 6 indicate that there was a slight decline
in P-PO<sub>4</sub>3-<sub> in the effluent, ranging from 6.0 mg/l to 3.9 mg/l. </sub>
This decline in phosphorus is due to its use for the synthesis
of microorganism cells.
<b>Fig. 5. Nitrogen removal (A) N-NH4+, (B) TKN. </b>
The P-PO43- concentration also significantly changed. The results in Fig. 6 indicate
that there was a slight decline in P-PO43- in the effluent, ranging from 6.0 mg/l to 3.9
mg/l. This decline in phosphorus is due to its use for the synthesis of microorganism
cells.
<b>Fig. 6. Phosphate removal. </b>
<i><b> Biogas Yield </b></i>
The measured daily biogas yield had an average value of 2.12 m3<sub>/d (the highest was </sub>
2.56 m3<sub>/d and the lowest was 1.76 m</sub>3<sub>/d). The amount of obtained biogas per removed </sub>
COD was 0.22 m3<sub>/kg COD</sub>
removed (the highest was 0.24 m3/kgCODremoved and the lowest
was 0.19 m3<sub>/kgCOD</sub>
removed). The biogas yield data is presented in Fig. 7.
50.0
70.0
90.0
110.0
130.0
150.0
170.0
1 5 9 13 17 21 25 29 33 37 41 45 49 53 57
<b>N</b>
<b>-NH</b>
<b>4</b>
<b>+ (m</b>
<b>g/</b>
<b>l)</b>
<b>Time (day)</b>
Influent (mg/l) Effluent (mg/l)
0
50
100
150
200
250
1 5 9 13 17 21 25 29 33 37 41 45 49 53 57
<b>T</b>
<b>KN</b>
<b> (m</b>
<b>g/</b>
<b>l)</b>
<b>Time (day)</b>
Influent (mg/l) Effluent (mg/l)
0.0
1.0
2.0
3.0
4.0
5.0
6.0
7.0
1 5 9 13 17 21 25 29 33 37 41 45 49 53 57
<b></b>
<b>P-P</b>
<b>O4</b>
<b>3-(m</b>
<b>g/</b>
<b>l)</b>
<b>Time (day)</b>
Influent (mg/l) Effluent (mg/l)
<b>(B) </b>
<b>Fig. 6. Phosphate removal.</b>
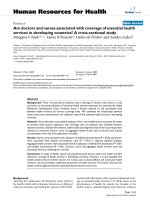
<i><b> Biogas yield</b></i>
The measured daily biogas yield had an average value
of 2.12 m3<sub>/d (the highest was 2.56 m</sub>3<sub>/d and the lowest was </sub>
1.76 m3<sub>/d). The amount of obtained biogas per removed </sub>
COD was 0.22 m3<sub>/kgCOD</sub>
removed (the highest was 0.24
m3<sub>/kgCOD</sub>
removed and the lowest was 0.19 m3/kgCODremoved).
The biogas yield data is presented in Fig. 7.
<b>Fig.7. The biogas yield generated per COD removed. </b>
<b>Conclusion </b>
The co-digestion of domestic wastewater and food waste by a pilot scale anaerobic
membrane bioreactor can solve both issues of wastewater treatment and food waste
management for decentralized residential areas and independent-stationed military units.
The removal efficiency of COD and TSS was quite high, especially with the presence of
the membrane, from which TSS was completely removed. Moreover, supplementing with
the organic fraction of food waste improved biogas generation. In summary, the pilot
scale co-digestion technology performed in this study can be applied to a wider scale to
resolve both wastewater and solid waste for decentralized areas that are far from
concentrated treatment plants.
<b>ACKNOWLEDGEMENT </b>
The authors declare that there is no conflict of interest regarding the publication of this
article.
<b>REFERENCES </b>
[1] H. Kjerstadius, S. Haghighatafshar, Å. Davidsson (2015), "Potential for
nutrient recovery and biogas production from blackwater, food waste and greywater in
urban source control systems", <i>Environ. Technol.</i>, <b>36, </b>pp.1707-1720.
[2] D. Goulding, N. Power (2013), "Which is the preferable biogas utilisation
technology for anaerobic digestion of agricultural crops in Ireland: Biogas to CHP or
biomethane as a transport fuel?", <i>Renew. Energy.</i>, <b>53, </b> pp.121-131,
[3] H. Lin, W. Peng, M. Zhang, J. Chen, H. Hong, Y. Zhang (2013), "A review on
anaerobic membrane bioreactors: Applications, membrane fouling and future
perspectives", <i>Desalination.</i>, <b>314</b>, pp.169-188,
[4] Z. Huang, S.L. Ong, H.Y. Ng (2011), "Submerged anaerobic membrane
bioreactor for low-strength wastewater treatment: effect of HRT and SRT on treatment
performance and membrane fouling", <i>Water Res.,</i><b>45</b>, pp.705-713.
[5] J. Gouveia, F. Plaza, G. Garralon, F. Fdz-Polanco, M. Peña (2015), "Long-term
operation of a pilot scale anaerobic membrane bioreactor (AnMBR) for the treatment of
municipal wastewater under psychrophilic conditions", <i>Bioresource Technology, </i><b>185</b>, pp.
225-233.
[6] D.W. Gao, Q. Hu, C. Yao, N.Q. Ren, W.M. Wu (2104), "Integrated anaerobic
0.00
0.05
0.10
0.15
0.20
0.25
0.30
1 5 9 13 17 21 25 29 33 37 41 45 49 53 57
<b>Ge</b>
<b>ne</b>
<b>rate</b>
<b>d </b>
<b>bi</b>
<b>og</b>
<b>as</b>
<b> v</b>
<b>ol</b>
<b>um</b>
<b>e/</b>
<b> re</b>
<b>m</b>
<b>ov</b>
<b>ed</b>
<b>C</b>
<b>OD</b>
<b> (m</b>
<b>3/k</b>
<b>g </b>
<b>C</b>
<b>OD)</b>
<b>Time (day)</b>
Biogas volume/kg COD removed
<b>Fig. 7. The biogas yield generated per COD removed.</b>
<b>Conclusions</b>
The co-digestion of domestic wastewater and food
waste by a pilot scale anaerobic membrane bioreactor
can solve both issues of wastewater treatment and food
waste management for decentralized residential areas
and independent-stationed military units. The removal
efficiency of COD and TSS was quite high, especially
</div>
<span class='text_page_counter'>(6)</span><div class='page_container' data-page=6>
<i><b>Life ScienceS </b></i>|<i> Biotechnology</i>
<b>Vietnam Journal of Science,</b>
<b>Technology and Engineering</b>
76 march 2021 • Volume 63 Number 1
<b>COMPETING INTERESTS</b>
The authors declare that there is no conflict of interest
regarding the publication of this article.
<b>REFERENCES</b>
[1] H. Kjerstadius, S. Haghighatafshar, Å. Davidsson (2015),
“Potential for nutrient recovery and biogas production from
blackwater, food waste and greywater in urban source control
systems”, <i>Environ. Technol.</i>, <b>36, </b>pp.1707-1720.
[2] D. Goulding, N. Power (2013), “Which is the preferable
biogas utilisation technology for anaerobic digestion of agricultural
crops in Ireland: Biogas to CHP or biomethane as a transport fuel?”,
<i>Renew. Energy</i>, <b>53, </b>pp.121-131, DOI: 10.1016/j.renene.2012.11.001.
[3] H. Lin, W. Peng, M. Zhang, J. Chen, H. Hong, Y. Zhang
(2013), “A review on anaerobic membrane bioreactors: Applications,
membrane fouling and future perspectives”, <i>Desalination</i>, <b>314</b>,
pp.169-188, DOI: 10.1016/j.desal.2013.01.019.
[4] Z. Huang, S.L. Ong, H.Y. Ng (2011), “Submerged anaerobic
membrane bioreactor for low-strength wastewater treatment: effect
of HRT and SRT on treatment performance and membrane fouling”,
<i>Water Res.</i>, <b>45, pp.705-713.</b>
[5] J. Gouveia, F. Plaza, G. Garralon, F. Fdz-Polanco, M. Peña
(2015), “Long-term operation of a pilot scale anaerobic membrane
bioreactor (AnMBR) for the treatment of municipal wastewater under
psychrophilic conditions”, <i>Bioresource Technology</i>,<b>185, pp.225-233.</b>
[6] D.W. Gao, Q. Hu, C. Yao, N.Q. Ren, W.M. Wu (2014),
“Integrated anaerobic fluidized-bed membrane bioreactor for domestic
wastewater treatment”, <i>Chem. Eng. J., </i><b>240</b>, pp.362-368.
[7] M. Galib, E. Elbeshbishy, R. Reid, A. Hussain, H.S. Lee
(2016), “Energy-positive food wastewater treatment using an
anaerobic membrane bioreactor (AnMBR)”, <i>J. Environ. Manage.</i>,
<b>182, pp.477-485.</b>
[8] A.S.J.B. Giménez, A. Robles, L. Carretero, F. Durán, M.V.
Ruano, M.N. Gatti, J. Ribes, J. Ferrer (2011),<i> “</i>Experimental study
of the anaerobic urban wastewater treatment in a submerged
hollow-fibre membrane bioreactor at pilot scale”, <i>Bioresour. Technol.</i>, <b>102</b>,
pp.8799-8806.
[9] G.S. Alessandro, C. Stefania (2012), “Decolourisation of
textile wastewater in a submerged anaerobic membrane bioreactor”,
<i>Bioresour. Technol.,</i><b> 117, pp.180-185.</b>
[10] J.W. Lim (2011), <i>Anaerobic Co-digestion of Brown Water </i>
<i>and Food Waste for Energy Recovery</i>, 11th Ed. World Wide Work.
Young Environ. Sci. (WWW-YES-2011)-Urban waters: resource or
risks, pp.6-10.
[11] P.C. Chan, R. Alves de Toledo, H.I. Iu, H. Shim (2018),
“Co-digestion of food waste and domestic wastewater - effect of copper
supplementation on biogas production copper supplementation on
biogas production”, <i>Energy Procedia</i>, <b>153</b>, pp.237-241.
[12] B.H. Ha (2018), “Co-digestion of food waste and domestic
wastewater by using upflow anaerobic sludge blanket (Uasb) couped
with a microfiltration membrane (Mf)”, <i>Vietnam J. Sci. Technol.</i>, <b>56</b>,
</div>
<!--links-->