- Trang chủ >>
- Sư phạm >>
- Sư phạm địa
De thi vat li quoc te IPHO nam 20075
Bạn đang xem bản rút gọn của tài liệu. Xem và tải ngay bản đầy đủ của tài liệu tại đây (242.41 KB, 8 trang )
<span class='text_page_counter'>(1)</span><div class='page_container' data-page=1>
<b>Experimental Problem</b>
<b> </b>
<b>Determination of energy band gap of semiconductor thin films </b>
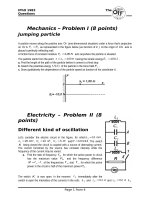
<b>I. Introduction </b>
<i>Semiconductors can be roughly characterized as materials whose electronic properties </i>
fall somewhere between those of conductors and insulators. To understand
<i>semiconductor electronic properties, one can start with the photoelectric effect as a </i>
well-known phenomenon. The photoelectric effect is a quantum electronic
phenomenon, in which photoelectrons are emitted from the matter through the
absorption of sufficient energy from electromagnetic radiation (i.e. photons). The
minimum energy which is required for the emission of an electron from a metal by
<i>light irradiation (photoelectron) is defined as "work function". Thus, only photons </i>
with a frequency <i>higher than a characteristic threshold, i.e. with an energy h ( h </i>
is the Planck s constant) more than the material s work function, are able to knock
<b>out the photoelectrons. </b>
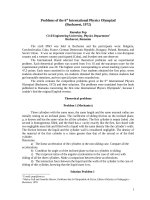
<b>Figure 1. An illustration of photoelectron emission from a metal plate: The incoming photon </b>
should have an energy which is more than the work function of the material.
In fact, the concept of work function in the photoelectric process is similar to the
concept of the energy band gap of a semiconducting material. In solid state physics,
the band gap <i>E is the energy difference between the top of the valence band and the <sub>g</sub></i>
bottom of the conduction band of insulators and semiconductors. The valence band is
completely filled with electrons, while the conduction band is empty however
electrons can go from the valence band to the conduction band if they acquire
sufficient energy (at least equal to the band gap energy).The semiconductor's
<b>conductivity strongly depends on its energy band gap. </b>
<b>Figure 2. Energy band scheme for a semiconductor. </b>
<b>Conduction </b>
<b>band</b>
Unfilled
band
Filled
bands
<b>E</b>
<b><sub>Energy </sub></b></div>
<span class='text_page_counter'>(2)</span><div class='page_container' data-page=2>
Band gap engineering is the process of controlling or altering the band gap of a
material by controlling the composition of certain semiconductor alloys. Recently, it
has been shown that by changing the nanostructure of a semiconductor it is possible
to manipulate its band gap.
In this experiment, we are going to obtain the energy band gap of a thin-film
semiconductor containing nano-particle chains of iron oxide (Fe2O3) by using an
optical method. To measure the band gap, we study the optical absorption properties
of the transparent film using its optical transmission spectrum. As a rough statement,
the absorption spectra shows a sharp increase when the energy of the incident photons
equals to the energy band gap.
<b>II. Experimental Setup </b>
You will find the following items on your desk:
1. A large white box containing a spectrometer with a halogen lamp.
2. A small box containing a sample, a glass substrate, a sample-holder, a grating,
and a photoresistor.
3. A multimeter.
4. A calculator.
5. A ruler.
6. A card with a hole punched in its center.
7. A set of blank labels.
The spectrometer contains a goniometer with a precision of 5 . The Halogen lamp
acts as the source of radiation and is installed onto the fixed arm of the spectrometer
<b>(for detailed information see the enclosed "Description of Apparatus"). </b>
The small box contains the following items:
1. A sample-holder with two windows: a glass substrate coated with Fe2O3 film
mounted on one window and an uncoated glass substrate mounted on the other.
2. A photoresistor mounted on its holder, which acts as a light detector.
3. <b>A transparent diffraction grating (600 line/mm). </b>
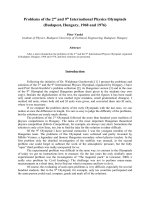
A schematic diagram of the setup is shown in Figure 3:
<b>Figure 3. Schematic diagram of the experimental setup. </b>
<b>Note:</b>
<i> Avoid touching the surface of any component in the small box! </i>
<b>Ohmmeter</b>
<b>(Max. range 200 M ) </b>
<b>Photoresistor </b>
<b>Grating </b>
<b>600 lines/mm</b>
<b>Halogen lamp</b>
<b>Diffusive glass </b>
<b>Entrance </b>
<b>hole </b>
<b>Sample</b>
</div>
<span class='text_page_counter'>(3)</span><div class='page_container' data-page=3>
<b> </b>
<b>III. Methods </b>
To obtain the transmission of a film at each wavelength,<i>T<sub>film</sub></i> , one can use the
following formula:
)
(
/
)
(
)
( <i><sub>film</sub></i> <i><sub>glass</sub></i>
<i>film</i> <i>I</i> <i>I</i>
<i>T</i> <i><b> (1) </b></i>
where <i>I<sub>film</sub></i>and <i>I <sub>glass</sub></i> are respectively the intensity of the light transmitted from the
coated glass substrate, and the intensity of the light transmitted from the uncoated
glass slide. The value of <i>I</i>can be measured using a light detector such as a
photoresistor. In a photoresistor, the electrical resistance decreases when the intensity
of the incident light increases. Here, the value of <i>I</i>can be determined from the
following relation:
1
)
(
)
( <i>C</i> <i>R</i>
<i>I</i>
<b> </b>
<b>(2) </b>
where <i>R</i> <i>is the electrical resistance of the photoresistor, C is a </i> -dependent
coefficient.
The transparent grating on the spectrometer diffracts different wavelengths of
light into different angles. Therefore, to study the variations of <i>T</i> as a function of ,
it is enough to change the angle of the photoresistor ( ) with respect to the optical
axis (defined as the direction of the incident light beam on the grating), as shown in
Figure 4.
From the principal equation of a diffraction grating:
]
sin
)
[sin( <sub>0</sub> <sub>0</sub>
<i>d</i>
<i>n </i> (3)
one can obtain the angle corresponding to a particular <i>: n</i> is an integer number
<i>representing the order of diffraction, d is the period of the grating, and </i> <i><sub>o</sub></i> is the angle
the normal vector to the surface of grating makes with the optical axis (see Fig. 4). (In
this experiment we shall try to place the grating perpendicular to the optical axis
making <i><sub>o</sub></i> 0, but since this cannot be achieved with perfect precision the error
associated with this adjustment will be measured in task 1-e.)
<b>Figure 4. Definition of the angles involved in Equation 3. </b>
Experimentally it has been shown that for photon energies slightly larger than
the band gap energy, the following relation holds:
)
(<i>h</i> <i>E<sub>g</sub></i>
<i>A</i>
<i>h</i> <b>(4) </b>
where is the absorption coefficient of the film, <i>A</i> is a constant that depends on the
film s material, and is the constant determined by the absorption mechanism of the
film s material and structure. Transmission is related to the value of through the
well-known absorption relation:
o
<b>Grating </b>
o
'
</div>
<span class='text_page_counter'>(4)</span><div class='page_container' data-page=4>
t)
(-exp
<i>film</i>
<i><b>T </b></i> (5)
<i>where t is thickness of the film. </i>
<b>IV. Tasks: </b>
<b>0.</b> <i>Your apparatus and sample box (small box containing the sample holder) are </i>
<i><b>marked with numbers. Write down the Apparatus number and Sample number in </b></i>
<i><b>their appropriate boxes, in the answer sheet. </b></i>
<b>1.</b> <b>Adjustments and Measurements:</b>
<b> </b>
<b>1-a </b> Check the vernier scale and report the maximum precision
( ). <i>0.1 pt </i>
<b>Note: Magnifying glasses are available on request. </b>
<b>Step1: </b>
To start the experiment, turn on the Halogen lamp to warm up. It would be better not
to turn off the lamp during the experiment. Since the halogen lamp heats up during
the experiment, please be careful not to touch it.
Place the lamp as far from the lens as possible, this will give you a parallel light
beam.
We are going to make a rough zero-adjustment of the goniometer without utilizing
the photoresistor. Unlock the rotatable arm with screw 18 (underneath the arm), and
visually align the rotatable arm with the optical axis. Now, firmly lock the rotatable
arm with screw 18. Unlock the vernier with screw 9 and rotate the stage to 0 on the
vernier scale. Now firmly lock the vernier with screw 9 and use the vernier
fine-adjustment screw (screw 10) to set the zero of the vernier scale. Place the grating
inside its holder. Rotate the grating's stage until the diffraction grating is roughly
perpendicular to the optical axis. Place the card with a hole in front of the light source
and position the hole such that a beam of light is incident on the grating. Carefully
rotate the grating so that the spot of reflected light falls onto the hole. Then the
reflected light beam coincides with the incident beam. Now lock the grating's stage
by tightening screw 12.
By measuring the distance between the hole and the grating,
estimate the precision of this adjustment ( <i><sub>o</sub></i>). <i>0.3 pt </i>
<b>1-b </b> <sub>Now, by rotating the rotatable arm, determine and report the </sub>
range of angles for which the first-order diffraction of visible light
(from blue to red) is observed.
<i>0.2 pt </i>
<b>Step 2: </b>
</div>
<span class='text_page_counter'>(5)</span><div class='page_container' data-page=5>
Use the vernier fine-adjustment screw to set the zero of the vernier scale.
Report the measured minimum resistance value (<i>R</i><sub>min</sub>(0) ). <i><b>0.1 pt </b></i>
<b>1-c </b>
Your zero-adjustment is more accurate now, report the
<i>precision of this new adjustment (</i> <i><sub>o</sub></i>) .
Note: <i><sub>o</sub></i> is the error in this alignment i.e. it is a measure of
misalignment of the rotatable arm and the optical axis.
<i><b>0.1 pt </b></i>
<b>Hint: After this task you should tighten the fixing screws of the vernier. </b>
Moreover, tighten the screw of the photoresistor holder to fix it and do not remove it
<b>during the experiment. </b>
<b>Step 3: </b>
Move the rotatable arm to the region of the first-order diffraction. Find the angle at
which the resistance of the photoresistor is minimum (maximum light intensity).
<i>Using the balancing screws, you can slightly change the tilt of the grating s stage, to </i>
achieve an even lower resistance value.
<b>1-c </b> Report the minimum value of the observed resistance (
)
1
(
min
<i>R</i> ) in
its appropriate box. <i><b>0.1 pt </b></i>
<i>It is now necessary to check the perpendicularity of the grating for zero adjustment, </i>
<i>again. For this you must use the reflection-coincidence method of Step 1. </i>
<b>Important: From here onwards carry out the experiment in dark (close the cover). </b>
<b>Measurements: Screw the sample-holder onto the rotatable arm. Before you start the </b>
measurements, examine the appearance of your semiconductor film (sample). Place
the sample in front of the entrance hole <i>S </i><sub>1</sub> on the rotatable arm such that a uniformly
coated part of the sample covers the hole. To make sure that every time you will be
working with the same part of the sample make proper markings on the sample holder
and the rotatable arm with blank labels.
<b>Attention: At higher resistance measurements it is necessary to allow the </b>
photoresistor to relax, therefore for each measurement in this range wait 3 to 4
minutes before recording your measurement.
Measure the resistance of the photoresistor for the uncoated
glass substrate and the glass substrate coated with semiconductor
layer as a function of the angle (the value read by the
goniometer for the angle between the photoresistor and your
specified optical axis). Then fill in Table 1d. Note that you need
at least 20 data points in the range you found in Step 1b. Carry
out your measurement using the appropriate range of your
ohmmeter.
<i>2.0 pt </i>
<b>1-d </b>
</div>
<span class='text_page_counter'>(6)</span><div class='page_container' data-page=6>
answer only on your direct readings of the ohmmeter.
<b>Step 4: </b>
The precision obtained so far is still limited since it is impossible to align the
rotatable arm with the optical axis and/or position the grating perpendicular to the
optical axis with 100% precision. So we still need to find the asymmetry of the
measured transmission at both sides of the optical axis (resulting from the deviation
of the normal to the grating surface from the optical axis ( <i><sub>o</sub></i>)).
To measure this asymmetry, follow these steps:
First, measure <i>T <sub>film</sub></i> at 20 . Then, obtain values for <i>T <sub>film</sub></i>
at some other angles around 20 . Complete Table 1e (you can
use the values obtained in Table 1d).
<i>0.6 pt </i>
<b>1-e </b>
Draw <i>T<sub>film</sub></i> versus and visually draw a curve. <i>0.6 pt </i>
On your curve find the angle for which the value of <i>T<sub>film</sub></i>is equal to the <i>T <sub>film</sub></i> that
you measured at 20 (<i>o</i> | <sub>(</sub> <sub>20</sub><sub>)</sub>
<i>film</i>
<i>film</i> <i>T</i>
<i>T</i> ). Denote the difference of this angle
with 20 as , in other words:
20 <b>(6) </b>
<b>1-e </b> Report the value of <i>in the specified box. </i> <i>0.2 pt </i>
Then for the first-order diffraction, Eq. (3) can be simplified as follows:
)
2
/
sin(
<i>d</i> , (7)
where is the angle read on the goniometer.
<b>2.</b> <b>Calculations:</b>
<b> </b>
<b>2-a </b>
Use Eq. (7) to express in terms of the errors of the other
<i>parameters (assume d is exact and there is no error is associated </i>
with it). Also using Eqs. (1), (2), and (5), express <i>T<sub>film</sub></i> in terms
of <i>R</i> and <i>R</i>.
<i>0.6 pt </i>
<b>2-b </b> Report the range of values of over the region of first-order
diffraction. <i>0.3 pt </i>
<b>2-c </b>
Based on the measured parameters in Task 1, complete Table
2c for each . Note that the wavelength should be calculated using
Eq. (7).
<i>2.4 pt </i>
Plot <i>R <sub>glass</sub></i>1 and <i>R <sub>film</sub></i>1 as a function of wavelength together on
the same diagram. Note that on the basis of Eq. (2) behaviors of
1
<i>glass</i>
<i>R </i> and 1
<i>film</i>
<i>R </i> can reasonably give us an indication of the way
<i>glass</i>
<i>I</i> and <i>I<sub>film</sub></i> behave, respectively.
<i>1.5 pt </i>
<b>2-d </b>
In Table 2d, report the wavelengths at which <i>R <sub>glass</sub></i> and
</div>
<span class='text_page_counter'>(7)</span><div class='page_container' data-page=7>
<b>2-e </b>
For the semiconductor layer (sample) plot <i>T <sub>film</sub></i> as a function of
wavelength. This quantity also represents the variation of the film
transmission in terms of wavelength.
<i>1.0 pt </i>
<b>3.</b> <b>Data analysis:</b>
By substituting 12 and <i>A </i> 0.071 ((eV)1/2/nm) in Eq. (4) one can find values for
<i>g</i>
<i>E and t in units of eV and nm, respectively. This will be accomplished by plotting a </i>
suitable diagram in an <i>x</i> <i>y</i> coordinate system and doing an extrapolation in the
<b>region satisfying this equation. </b>
<b>3-a </b>
By assuming <i>x</i> <i>h</i> and <i>y</i> ( <i>th</i> )2 and by using your
measurements in Task 1, fill in Table 3a for wavelengths around
530 nm and higher. Express your results (<i>x</i> <i>and y ) with the </i>
correct number of significant figures (digits), based on the
estimation of the error on one single data point.
<i>Note that h</i> should be calculated in units of eV and wavelength
in units of nm. Write the unit of each variable between the
parentheses in the top row of the table.
<i>2.4 pt </i>
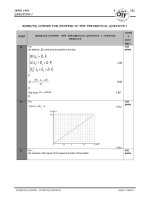
Plot <i>y versus x . </i>
<i>Note that the y</i> parameter corresponds to the absorption of the
film. Fit a line to the points in the linear region around 530 nm.
<b>3-b </b>
Specify the region where Eq. (4) is satisfied, by reporting the
values of the smallest and the largest x-coordinates for the data
points to which you fit the line.
<i>2.6 </i>
<i>pt</i>
<b>3-c </b>
<i>Call the slope of this line m , and find an expression for the </i>
<i>film thickness ( t ) and its error ( t ) in terms of m and A (consider </i>
<i>A</i> to have no error).
<i>0.5 pt </i>
<b>3-d </b> Obtain the values of <i>E and t and their associated errors in g</i>
units of eV and nm, respectively. Fill in Table 3d. <i>3.0 pt </i>
Some useful physical constants required for your analysis:
</div>
<span class='text_page_counter'>(8)</span><div class='page_container' data-page=8>
This document was created with Win2PDF available at .
</div>
<!--links-->
<a href=''>This document was created with Win2PDF available at .</a>