Unit 7 Writing xu
Bạn đang xem bản rút gọn của tài liệu. Xem và tải ngay bản đầy đủ của tài liệu tại đây (2.45 MB, 18 trang )
<span class='text_page_counter'>(1)</span><div class='page_container' data-page=1></div>
<span class='text_page_counter'>(2)</span><div class='page_container' data-page=2>
19%
13%
9%
5%
16%
20%
18%
<b>The Red River</b>
<b> Delta</b>
<b>North Central </b>
<b>Coast</b>
<b>South Central </b>
<b>Coast</b>
<b>Central </b>
<b>Highlands</b>
<b>southeast</b>
<b>The Mekong</b>
<b> Delta</b>
<b>Middle lands </b>
<b>of Northern</b>
</div>
<span class='text_page_counter'>(3)</span><div class='page_container' data-page=3>
Unit 7:
Unit 7:
Lesson D:
</div>
<span class='text_page_counter'>(4)</span><div class='page_container' data-page=4></div>
<span class='text_page_counter'>(5)</span><div class='page_container' data-page=5>
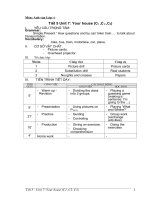
<b>The chart shows the distribution of Vietnam </b>
<b>population by region. It can be seen that, the </b>
<b>Vietnam population is distributed unevenly. </b>
<b>Central Highlands is least populated with only </b>
<b>5%. North Central Coast is higher than Central </b>
<b>Highland with the rate of 13%. Middle Lands of </b>
<b>Northern is more than double population of the </b>
<b>South Central Coast. The Red River Delta </b>
<b>accounts for 19 % of Vietnam population and </b>
<b>Southeast is a bit lower with only 16%. The </b>
<b>Mekong Delta has the largest population with </b>
<b>20% and ranks first in all regions in Vietnam.</b>
</div>
<span class='text_page_counter'>(6)</span><div class='page_container' data-page=6>
The chart shows the distribution of
Vietnam population by region. It can be
seen that, the Vietnam population is
distributed unevenly.
Central Highlands is least populated
with only 5%. North Central Coast is
higher than Central Highland with the
rate of 13%. Middle Lands of Northern is
more than double population of the
South Central Coast. The Red River
Delta accounts for 19 % of Vietnam
population and Southeast is a bit lower
with only 16%. The Mekong Delta has
the largest population with 20% and
ranks first in all regions in Vietnam.
To sum up, more people live in The
Mekong Delta than in other parts of
Vietnam.
How many parts are
there in the
description of a
chart ?
What are they?
- <b>Introduction</b>: Tell the chart is
about (time, location, things
decribed in the chart) and say
what overall trends you see
- <b>Body:</b> Describe the chart in detail
(in a logical order)
</div>
<span class='text_page_counter'>(7)</span><div class='page_container' data-page=7>
<b>You may finish your description with:</b>
Conclusion
<b>How to describe the information in the chart:</b>
Body
<b>You may start your description with:</b>
Introduction - The chart shows/ describes…
- It can be seen that …
- account for…percent/ make up…percent
- more than double the population of…
- half as much as/ nearly half of…
- rank first/ last
- respectively
- the largest/ the least/ the smallest
</div>
<span class='text_page_counter'>(8)</span><div class='page_container' data-page=8>
<b>Oceania</b>
<b>South </b>
<b>Asia </b>
<b> 32 %</b>
<b>Europe </b>
<b> 15%</b>
<b>Africa </b>
<b> </b>
<b>11%</b>
<b>Latin </b>
<b>America</b>
<b> </b>
<b> </b>
<b> </b>
<b> </b>
<b>----8% </b>
<b>Northern </b>
<b>America </b>
<b> 6% </b>
<b>East Asia </b>
<b> 26%</b>
<b>2</b>
<b>%</b>
</div>
<span class='text_page_counter'>(9)</span><div class='page_container' data-page=9>
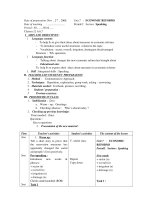
<b>South Asia </b>
<b> 32 %</b>
<b>East Asia </b>
<b> 26%</b>
<b>Europe </b>
<b> 15%</b>
<b>Africa </b>
<b> </b>
<b>11%</b>
<b>Latin </b>
<b>America </b>
<b> 8%</b>
<b>2%</b>
<b>Northern </b>
<b>America </b>
<b> 6%</b>
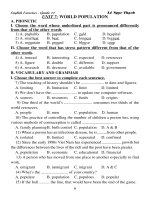
<b>Oceania</b> What can we see from the pie chart?
The chart shows the distribution of world population by region.
- As can be seen that…
- As shown that…
- As seen that…
- As can be seen from the chart that…
</div>
<span class='text_page_counter'>(10)</span><div class='page_container' data-page=10>
How many percent does South Asia have?
<b>South Asia </b>
<b> 32 %</b>
<b>Africa </b>
<b> </b>
<b>11%</b>
<b>Europe </b>
<b> 15%</b>
<b>East Asia </b>
<b> 26%</b>
<b>Latin </b>
<b>America </b>
<b> 8%</b>
<b>Northern </b>
<b>America </b>
<b> 6%</b>
<b>Oceania</b>
<b>2%</b>
South Asia accounts for/makes up 32%
How about Europe?
Europe’s population is nearly half of the population of South
Asia.
South Asia region ranks first
with the largest population
Which has the largest population?
</div>
<span class='text_page_counter'>(11)</span><div class='page_container' data-page=11>
Complete the description of a pie chart,
Complete the description of a pie chart,
using the given words
using the given words
</div>
<span class='text_page_counter'>(12)</span><div class='page_container' data-page=12>
1.
1. The chart / show / the distribution / world population / region. The chart / show / the distribution / world population / region.
2.
2. It / seen/that the world population /be/ distributed unevenly.It / seen/that the world population /be/ distributed unevenly.
3.
3. Population / South Asia / account /32%/ and this region Population / South Asia / account /32%/ and this region
/rank / first.
/rank / first.
4.
4. East Asia / be / at the second rank/ with, / 6% less than East Asia / be / at the second rank/ with, / 6% less than
South Asia.
South Asia.
5.
5. Population rate/ Europe/be / nearly half / South Asia’s Population rate/ Europe/be / nearly half / South Asia’s
population, / with 15%.
population, / with 15%.
6.
6. Africa/ make / up / 11%/ the world population.Africa/ make / up / 11%/ the world population.
7.
7. Coming next / be / Latin America and Northern America,/ with Coming next / be / Latin America and Northern America,/ with
8% and 6% respectively.
8% and 6% respectively.
8.
8. The least populated region/ be / Oceania, / with the smallest The least populated region/ be / Oceania, / with the smallest
percentage of 2%.
percentage of 2%.
9.
9. To sum up, more people/ live / Asia than in other parts of the To sum up, more people/ live / Asia than in other parts of the
</div>
<span class='text_page_counter'>(13)</span><div class='page_container' data-page=13>
<i>Useful language</i>
<i>Useful language</i>
<i></i>
<i>--</i>
<i>It can be seen that/ As can be seen from the </i>
<i><sub>It can be seen that/ As can be seen from the </sub></i>
<i>chart that/ As shown that…</i>
<i>chart that/ As shown that…</i>
<i>- distributed unevenly</i>
<i>- distributed unevenly</i>
<i>- account for…percent/ make up …percent</i>
<i>- account for…percent/ make up …percent</i>
<i>- more than double the population of…</i>
<i>- more than double the population of…</i>
<i>- half as much as/ nearly half of…</i>
<i>- half as much as/ nearly half of…</i>
<i>- rank first/ last</i>
<i>- rank first/ last</i>
<i>- respectively</i>
</div>
<span class='text_page_counter'>(14)</span><div class='page_container' data-page=14>
1.
1. The chart The chart <b>showsshows</b> the distribution world population the distribution world population <b>byby</b> region. region.
2.
2. It It <b>can becan be</b> seen that the world population seen that the world population <b>isis</b> distributed distributed
unevenly.
unevenly.
3.
3. Population Population <b>ofof</b> South Asia accounts South Asia accounts <b>forfor</b> 32% and this region 32% and this region
<b>ranks</b>
<b>ranks</b> first. first.
4.
4. East Asia East Asia <b>isis</b> at the second rank, with 6% less than South Asia. at the second rank, with 6% less than South Asia.
5.
5. Population rate Population rate <b>ofof</b> Europe Europe <b>isis</b> nearly half nearly half <b>ofof</b> South Asia’s South Asia’s
population, with 15%.
population, with 15%.
6.
6. Africa Africa <b>makesmakes</b> up 11% up 11% <b>ofof</b> the world population. the world population.
7.
7. Coming next Coming next <b>isis</b> Latin America and Northern America, with 8% Latin America and Northern America, with 8%
and 6% respectively.
and 6% respectively.
8.
8. The least populated region The least populated region <b>isis</b> Oceania, with the smallest Oceania, with the smallest
percentage of 2%.
percentage of 2%.
9.
9. To sum up, more people To sum up, more people <b>livelive</b> in Asia than in Asia than <b>inin</b> other parts of other parts of
</div>
<span class='text_page_counter'>(15)</span><div class='page_container' data-page=15>
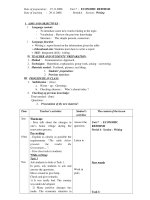
The chart shows the distribution world population by
The chart shows the distribution world population by
region. It can be seen that the world population is
region. It can be seen that the world population is
distributed unevenly.
distributed unevenly.
Population of South Asia accounts for 32% and this
Population of South Asia accounts for 32% and this
region ranks first. East Asia is at the second rank, with
region ranks first. East Asia is at the second rank, with
6% less than South Asia. Population rate of Europe is
6% less than South Asia. Population rate of Europe is
nearly half of South Asia’s population, with 15%. Africa
nearly half of South Asia’s population, with 15%. Africa
makes up 11% of the world population. Coming next is
makes up 11% of the world population. Coming next is
Latin America and Northern America, with 8% and 6%
Latin America and Northern America, with 8% and 6%
respectively. The least populated region is Oceania,
respectively. The least populated region is Oceania,
with the smallest percentage of 2%.
with the smallest percentage of 2%.
To sum up, more people live in Asia than in other
To sum up, more people live in Asia than in other
parts of the world.
</div>
<span class='text_page_counter'>(16)</span><div class='page_container' data-page=16>
A description of the information in the chart.
Introduction tells the chart is about and the overall trend
The chart shows/ describes/ illustrates...
Body describes the information in detail
- As can be seen from the chart that/ It can be seen that/ As seen that/ As shown
that…
- distributed unevenly
- account for…percent/ make up…percent
- more than double the population of
- half as much as/ nearly half of
- rank first/ last
- respectively
- the largest/ the least
- while/ on the contrary/ in contrast….
Conclusion summarizes the main points of the chart.
</div>
<span class='text_page_counter'>(17)</span><div class='page_container' data-page=17>
<b>Homework:</b>
Write a paragraph of 100-120 words ,
describing the information in the chart below.
Learn lesson.
</div>
<span class='text_page_counter'>(18)</span><div class='page_container' data-page=18>
<i>Thank you for your attention!</i>
</div>
<!--links-->