- Trang chủ >>
- Khoa học xã hội >>
- Báo chí
U7D E11
Bạn đang xem bản rút gọn của tài liệu. Xem và tải ngay bản đầy đủ của tài liệu tại đây (238.99 KB, 11 trang )
<span class='text_page_counter'>(1)</span><div class='page_container' data-page=1></div>
<span class='text_page_counter'>(2)</span><div class='page_container' data-page=2>
<i><b>UNIT 7: WORLD POPULATION</b></i>
<i><b>UNIT 7: WORLD POPULATION</b></i>
</div>
<span class='text_page_counter'>(3)</span><div class='page_container' data-page=3>
Vocabulary
<b>Chart (n)</b>
<b>Unevenly (adv)</b>
<b>Account (for) (v)</b>
<b>Distribute (v)</b>
<b>Region (n)</b>
<b>Continent (n)</b>
<i><b>Biểu đồ</b></i>
<i><b>Khơng đều</b></i>
<i><b>Giải thích cho (là </b></i>
<i><b>nguyên nhân của)</b></i>
<i><b>Phân bố</b></i>
<i><b>Vùng, miền</b></i>
<i><b>Lục địa</b></i>
</div>
<span class='text_page_counter'>(4)</span><div class='page_container' data-page=4>
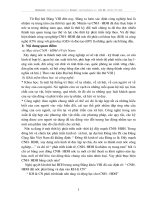
<i><b>Study the chart carefully then write a paragraph of </b></i>
<i><b>Study the chart carefully then write a paragraph of </b></i>
<i><b>100- 120 words, describing the information in the </b></i>
<i><b>100- 120 words, describing the information in the </b></i>
<i><b>chart.</b></i>
</div>
<span class='text_page_counter'>(5)</span><div class='page_container' data-page=5>
<b>Task 1: Ask and answer the </b>
<b>information in the chart:</b>
<b>1. What is the topic of the </b>
<b>chart?</b>
<b>2. How many region are there?</b>
<b>3. Which continent have the </b>
<b>largest population?</b>
<b>4. Which continent has the </b>
<b>smallest population?</b>
<b>5. Is population of Europe larger </b>
</div>
<span class='text_page_counter'>(6)</span><div class='page_container' data-page=6>
<b>1. North American is home to 514M (8%)</b>
<b>2. Asia accounts for over 60% of the world population </b>
<b>which almost 3.8 billion people.</b>
<b>3. Europe’s 710 million make up 11% of the world </b>
<b>population.</b>
<b>4. Africa follows with 840 million people, 12% of the world </b>
<b>population.</b>
<b>5. The chart shows the distribution of the world population </b>
<b>in 2005.</b>
<b>6. Generally, the world population is distributed unevenly </b>
<b>through regions.</b>
<b>7. China and India alone comprise 20% and 16% </b>
<b>respectively.</b>
</div>
<span class='text_page_counter'>(7)</span><div class='page_container' data-page=7>
5-6-2-7-4-3-1
The chart shows the distribution of the world
population in 2005. Generally, the world
population is distributed unevenly through
regions. Asia accounts for over 60% of the world
population which almost 3.8 billion people. China
and India alone comprise 20% and 16%
respectively. Africa follows with 840 million
people, 12% of the world population. Europe’s
</div>
<span class='text_page_counter'>(8)</span><div class='page_container' data-page=8>
<i><b>The chart shows that…</b></i>
<i><b>The chart shows that…</b></i>
<i><b>The chart described that…</b></i>
<i><b>The chart described that…</b></i>
<i><b>The chart presents…</b></i>
<i><b>The chart presents…</b></i>
<i><b>According to the chart…</b></i>
<i><b>According to the chart…</b></i>
<i><b>From the chart, it can be seen </b></i>
<i><b>From the chart, it can be seen </b></i>
<i><b>that…</b></i>
<i><b>that…</b></i>
<i><b>In the chart…</b></i>
<i><b>In the chart…</b></i>
<i><b>In sum…</b></i>
<i><b>In sum…</b></i>
<i><b>Comprise= account for…%...</b></i>
<i><b>Comprise= account for…%...</b></i>
<i><b>Follow…</b></i>
<i><b>Follow…</b></i>
<i><b>Make up… % of the …</b></i>
<i><b>Make up… % of the …</b></i>
</div>
<span class='text_page_counter'>(9)</span><div class='page_container' data-page=9>
<b>Introduction </b>
<b>- Tell the chart is about (time, location, </b>
<b>things described in the chart.</b>
<b>Ex: The chart shows the distribution </b>
<b>of world population in 2005.</b>
<b>Body </b>
-<b>Begin with a sentence to sum up the </b>
<b>overall trend.</b>
-
<b>Described the chart in detail.</b>
<b>Conclusion </b>
<b>Summarize the main points</b>
</div>
<span class='text_page_counter'>(10)</span><div class='page_container' data-page=10>
<b>USEFUL LANGUAGE:</b>
<b>USEFUL LANGUAGE:</b>
• <sub>- </sub>
<b><sub>It can be seen that</sub></b>
•
<b>- Distributed unevenly</b>
•
<b>- Account for….percent</b>
•
<b>- More than double the population of</b>
•
<b><sub>- Half as much as/ nearly half of</sub></b>
•
<b>- Rank first/ last</b>
•
<b><sub>You may begin with:</sub></b>
•
<b>The chart shows the distribution of world </b>
</div>
<span class='text_page_counter'>(11)</span><div class='page_container' data-page=11></div>
<!--links-->