Soil properties in rubber plantation and economic efficirncy in thach thanh district, thanh hoa province, vietnam
Bạn đang xem bản rút gọn của tài liệu. Xem và tải ngay bản đầy đủ của tài liệu tại đây (2.65 MB, 79 trang )
MINISTRY OF EDUCATION AND
MINISTRY OF AGRICULTURE AND RURAL
TRAINING
DEVELOPMENT
VIETNAM NATIONAL UNIVERSITY OF FORESTRY
--------------------
SENG RAVOR
SOIL PROPERTIES IN RUBBER PLANTATION AND ECONOMIC EFFICIENCY
IN THACH THANH DISTRICT, THANH HOA PROVINCE, VIETNAM
MASTER THESIS IN FOREST SCIENCE
Hanoi, 2018
MINISTRY OF EDUCATION AND TRAINING
MINISTRY OF AGRICULTURE AND RURAL
DEVELOPMENT
VIETNAM NATIONAL UNIVERSITY OF FORESTRY
--------------------
SENG RAVOR
SOIL PROPERTIES IN RUBBER PLANTATION AND ECONOMIC EFFICIENCY
IN THACH THANH DISTRICT, THANH HOA PROVINCE, VIETNAM
Major: Forest Science
Code: 8620201
MASTER THESIS IN FOREST SCIENCE
Signature: ……………………………...
Academic advisor: Dr PHI DANG SON
Hanoi, 2018
Abstract
In Vietnam land use for rubber is in the south region; however in the north of
Vietnam still some areas are suitable for natural rubber farming. The soil is
recommended to all stakeholders who want to become rubber farm owner.
There are not many studies existed on the effect of rubber plantation on soil
properties and the sustainability of agricultural development in Vietnam. This study
aimed to evaluate the effects of rubber and turmeric land use on soil property from
0-105 cm depth and separated to two layers (topsoil from 0-30 cm and subsoil at 40105 cm). The results have shown that soil texture almost clay. Soil physical
property such as soil porosity was 63.43% highest in turmeric farm and the lowest
was 43.10% in the rubber plantation established in 1999. The percentages of soil
moisture at 0-30 cm depth was significance at p-value = 0.000 < 0.05 whereas, at
40-105 cm depth not-significant difference under rubber planted in 2007 at p-value
= 0.135 > 0.05. The soil density was significantly different at p-value = 0.010 at the
topsoil. Soil bulk density (g/cm3) at topsoil such as the rubber plantation was
created in 1999, 2017, turmeric and rubber-turmeric there is no-significant
difference at p-value = 0.091. That all soils were acidic in land use types. Soil
chemical property such as nitrogen content has no significance different in land
used types especially, highest at 40-105 cm depth and the p-value was 0.911. In the
rubber and turmeric farms the phosphorous content there were significance different
particularly, at subsoil in rubber-turmeric (p-value = 0.000) and the carbon content
in topsoil with the highest content in rubber-turmeric was 3.453 mg/100g and
lowest in turmeric farm was 2.356 mg/100g of soils while, the carbon content from
40-105 cm were lower significant difference existed in rubber and turmeric farms
was (p-value = 0.007). This suggests that fertilizers including chemical and organic
to make crop root systems better to uptake nutrients from soil depths easily.
To explain the prices of rubber, turmeric and sugarcane, data obtain from surveys
were conducted in Thanh Hoa province, Vietnam that rubber was started from last 2
i
decades. The price of natural rubber always fluctuation in lower, almost rubber
growers have suggested, led to wish to change the crops and major problems.
Agricultural diversifications have done recommend to all rubber growers during
rubber still young age due to enough spaces to practices. The price of rubber in
2018 in Thach Thanh and Cam Thuy districts, Thanh Hoa province was 25,000
VND per kg, turmeric was 6,000 NVD per kg and sugarcane was 900 to 1,000 VND
per kg.
ii
Table of Content
Abstract ................................................................................................................................... i
List of figure .......................................................................................................................... v
List of table ........................................................................................................................... vi
Abbreviation ........................................................................................................................vii
CHAPTER I: INTRODUCTION........................................................................................... 1
1.2.1 Goal ....................................................................................................................... 2
1.2.2 Specific objectives .............................................................................................. 2
1.2.3 Research questions ................................................................................................ 3
CHAPTER II: LITERATURE REVIEW .............................................................................. 4
2.1 General overview rubber plantation in the world and in Vietnam .............................. 4
2.1.1 Rubber plantation history in the world ................................................................. 4
2.1.2 Rubber plantation in Vietnam ............................................................................... 6
2.1.3 Biological characteristics of rubber ...................................................................... 7
2.1.4 Natural condition requirements of rubber ............................................................. 9
2.2 Soil quality indicators ................................................................................................ 10
2.2.1 Soil texture .......................................................................................................... 10
2.2.2 Soil bulk density ................................................................................................. 10
2.2.3 Soil density ......................................................................................................... 11
2.2.4 Soil porosity ........................................................................................................ 11
2.2.5 pH of the soil....................................................................................................... 12
2.2.6 Soil moisture ....................................................................................................... 13
2.2.7 Nitrogen .............................................................................................................. 13
2.2.8 Phosphorus .......................................................................................................... 13
2.2.9 Carbon ................................................................................................................. 14
2.3 Natural rubber-intercropping ..................................................................................... 14
2.3.1 Challenges of intercropping in a rubber plantation ............................................ 16
2.3.2 Benefits of intercropping in a rubber plantation ................................................. 16
2.4 Economic ................................................................................................................... 17
2.4.1 Marketing management ...................................................................................... 17
2.4.2 Labour management ........................................................................................... 17
CHAPTER III: RESEARCH METHODOLOGY ............................................................... 19
3.1 Brief of Thach Quang Farm ....................................................................................... 19
3.1.1 Geographic of the location .................................................................................. 19
3.1.2 Topography ......................................................................................................... 20
iii
3.1.3 The climate ......................................................................................................... 20
3.1.4 The Soil ............................................................................................................... 21
3.1.5 The Vegetation .................................................................................................... 21
3.1.6 The Economic ..................................................................................................... 21
3.1.7 The land use in Thach Quang Farm .................................................................... 22
3.1.8 Labour and employment ..................................................................................... 23
3.2 Data collection ........................................................................................................... 25
3.3 Data analysis .............................................................................................................. 26
3.3.1 Laboratory processing......................................................................................... 26
CHAPTER IV: RESULTS AND DISCUSSION ................................................................ 28
4.1 SOIL PHYSICAL PROPERTY................................................................................. 28
4.1.1 Soil texture .......................................................................................................... 28
4.1.2 Soil porosity ........................................................................................................ 31
4.1.3 Soil moisture content .......................................................................................... 32
4.1.6 Dynamic of soil pH level .................................................................................... 37
4.2 SOIL CHEMICAL PROPERTY ............................................................................... 39
4.2.1 Total content of nitrogen, phosphorus and carbon ............................................. 39
4.3 ECONOMIC EFFICIENCY OF RUBBER, SUGARCANE AND TUMERIC
CROPS ............................................................................................................................. 41
4.3.1 Evaluation of household‟s economic efficiency of rubber owners ..................... 41
4.3.2 Relationship between income and socio-economic growers and agronomic
characteristics of rubber ............................................................................................... 42
4.3.3 The opinions of farmers on the rubber, sugarcane and turmeric crops ............... 44
4.4 Recommendation ....................................................................................................... 45
CHAPTER V: CONCLUSION ........................................................................................... 46
ACKNOWLEDGEMENT ................................................................................................... 48
REFERENCES .................................................................................................................... 49
APPENDIX .......................................................................................................................... 53
iv
List of figure
Figure 2.1 Map of rubber plantation areas in the world…………………………………… 6
Figure 2.3 Possible pH ranges under the natural soil…………………………………….. 12
Figure 3.1 Map of study area…………………………………………………………….. . 19
Figure 3.2 Plot design…………………………….……………….……………………… 25
Figure 4.1 Particle size compositions of soil texture in rubber and turmeric land use types
at topsoil …………………………………… ...................................................................... 29
Figure 4.2 Particle size compositions of soil texture in rubber and turmeric land use types
at subsoil …………………………………… ..................................................................... 30
Figure 4.3 Soil porosity in rubber and turmeric land use types at topsoil ………….….….31
Figure 4.4 Soil moisture in rubber and turmeric land use types at topsoil …………..…....33
Figure 4.5 Soil moisture in rubber and turmeric land use types at subsoil……....…33
Figure 4.6 Soil density in rubber and other plantation at topsoil……………………….....34
Figure 4.7 Soil bulk density in rubber and other plantation at topsoil………………….....36
Figure 4.8 Soil pH (H2O) unit in rubber and turmeric land use types at topsoil…...37
Figure 4.9 Soil pH (H2O) unit in rubber and turmeric land use types at subsoil……….....37
Figure 4.10 Soil pH (KCl) unit in rubber and turmeric land use at topsoil ….…………....38
Figure 4.11 Soil pH (KCl) unit in rubber and turmeric land use at topsoil ….…………....38
Figure 4.12 Evaluation of household‟s economic efficiency of rubber, sugarcane and
turmeric owners………………………………………………………………………........42
Figure 4.13 Opinions of farmers on the rubber, sugarcane and turmeric crops ………......44
v
List of table
Table 2.1 Rubber areas, production and average annual yield ...................................7
Table 3.1 Land use in the Thach Quang farm ...........................................................22
Table 3.2 Employing situation at Thach Quang farm ...............................................23
Table 4.1 Summary result from SPSS (Soil texture at topsoil in rubber and turmeric
land use) ....................................................................................................................30
Table 4.2 Summary result from SPSS (Soil texture at subsoil in rubber and turmeric
land use) .....................................................................................................................30
Table 4.3 Summary result from SPSS (Soil porosity in rubber and turmeric land use) .....32
Table 4.4 Summary result from SPSS (Soil moisture in rubber and turmeric land use).....33
Table 4.5 Summary result from SPSS (Soil density in rubber and turmeric land use) ......34
Table 4.6 Summary result from SPSS (Bulk density in rubber and turmeric land use)......36
Table 4.7 Summary result from SPSS (Soil pH (H2O) in rubber and turmeric land use).. 38
Table 4.8 Summary result from SPSS (Soil pH (KCl) in rubber and turmeric land use) ...40
Table 4.9 Chemical property of soil under rubber, turmeric and rubber-turmeric
farms (mg/100g) ........................................................................................................41
Table 4.10 Summary result from SPSS (Total content of N, P and C in rubber and turmeric
land use types) .............................................................................................................41
Table 4.11 The relationship between income and socio-economic growers and
agronomic characteristics of rubber ..........................................................................43
vi
Abbreviation
ANRPC
=
Association of Natural Rubber Producing Countries
A(n)
=
Annuity
C
=
Carbon
Df
=
Degree of freedom
VND
=
Vietnamese Dong
g/cm3
=
Gram per cubic centimetre
GDP
=
gross national product
Ha
=
Hectare
KCl
=
Potassium chloride
M (%)
=
Moisture content
Mw
=
Mass of waters
Ms
=
Mass of solids
NR
=
Natural rubber
N
=
Nitrogen
pH
=
Power of hydrogen
P
=
Phosphorous
PV
=
Present value
RB
=
Rubber
RSS
=
Ribbed smoked sheets
TSR
=
Technically specified rubber
vii
CHAPTER I: INTRODUCTION
1.1 Background
Rubber is a very good economic, useful and valuable crop to companies
and farmers in Southeast Asia. In recent decades rubber has attracted a great
number of scientists focusing on practices for propagations and cultivation
methods which includes nutrition management and mixed cropping species
plantations with rubber trees. Rubber-mixed with other crops are more valuable in
term of income. This study will provide information and awareness of soil
properties on rubber and arable farms conditions to the local people in Thach
Thanh district, Thanh Hoa province.
Rubber tree (Hevea brasiliensis) is a good species that crucial to producing natural
latex. The conversion from tropical forest to rubber plantation can change the soil
properties, for examples, soil organic matter content, nitrogen and soil moisture (Li
et al., 2012).
In the Southeast region of Viet Nam, rubber trees are encouraged to plant where
suitable climate are fullfil for rubber plantation. The mountainous and coastal area
in the north of Vietnam, cultivation of rubber crop has been subsequently expanded.
Even annual rainfall is enough in the rainy season but, around 6 months are in dry
has marked often suffer to these regions. The average of temperature in the
Northern Mountains in some months are coldest can even reach 16 oC. It means that
the temperature in south of Vietnam is remarkable higher than North Vietnam in
some months (Tran and Nguyen, 2016). The changing effects are normally
externalized, for the whole society is being higher than farming operating. Farm
size extension with mechanization using is increased. Crop conversions and noncrop features losing in diversity have been decreasing (Stoate et al., 2001).
The soil properties under rubber at different ages were analyzed and compared to
check the changing of physical and chemical properties. During the first 18 years,
the changing of total soil porosity and bulk density content were slight. The results
1
after an analyzed total of soil organic carbon and nitrogen contents increase there
was non-significance. Soil layers, from 0-10 cm and 10-30 cm nutrient-elements
(calcium and magnesium) declined on soil exchanging when the age of rubber trees
are increasing. The changing of potassium level was declined, at the topsoil of the
soil profiles. According to some observations during the first 11 years in rubber
plantations in experimental plots, soil mineral-nutrients appeared reduce (Aweto,
1987). In the winter, spring and summer, soil organic carbon for microbial activities
from 0 cm to 100 cm depth availability of the soil decreased in the soil profile in
agricultural. The availability reduction of organic carbon to microorganism when
organic carbon content in the depth of soil. For the clay fraction organic carbon also
decrease (Nelson et al., 1994).
However, the effect of rubber plantation in Central Highland of Vietnam to
its soil properties is still ambiguous and lacking scientific information. Therefore,
the study is implemented to (i) evaluate the change of soil properties under rubber
plantation in Thanh Hoa province; (ii) assess the economic efficiency of rubber with
sugarcane and turmeric crops. Accordingly, we hypothesize that soil physical and
chemical properties decreased with increasing age of rubber trees. The economic
value of rubber plantation is lowest as compared to sugarcane and turmeric crops in
2018.
1.2 Goal, objectives and research questions
1.2.1 Goal
- To show about the rubber is suitable to plant or not in Thach Thanh district,
Thanh Hoa province, Vietnam.
1.2.2 Specific objectives
(1) To measure soil physical property in the study area in rubber and
turmeric crops.
(2) To identify soil chemical property in the study area in rubber and
turmeric crops.
(3) To evaluate economic efficiency of rubber, sugarcane and turmeric
crops.
2
1.2.3 Research questions
(1)What are the soil physical property such as soil texture, soil porosity, soil moisture
content, soil density, bulk density and soil pH level?
(2) What are the soil chemical property such as total content of nitrogen, phosphorus
and carbon?
(3) What is economic efficiency of rubber, sugarcane and turmeric crops?
3
CHAPTER II: LITERATURE REVIEW
2.1 General overview rubber plantation in the world and in Vietnam
2.1.1 Rubber plantation history in the world
Rubber (Hevea brasiliensis Muell.-Arg) is native to the tropical region of the
Great Amazonian basin, Brazil in South America. These places are located near
the equator and 15° S is described by a damp equatorial climate (Strahler, 1969).
Brazil provides characteristics ideal for rubber crop growing, viz., 2000-4000 mm
precipitation concentrated by 100-150 days of raining per annum (Baulkwill, 1989;
Pushparajah, 1977; Yew, 1982), the mean yearly temperature is about 28 ± 2°C
with a daytime disparity of around 7°C (Barry, R. G. and Chorley, 1976) and
sunlight per annum nearly 2000 hours, could be 6 h/day in all months. The Amazon
Basin is the largest area in the world with a characteristic equatorial climate
(Pushparajah, 2001). In 1902, the first large rubber plantation is established in
Sumatra‟s East Coast (Dijkman,1951). Present-day, Thailand leads in natural rubber
production (2,400,000 tons) followed by Indonesia, India, Malaysia, China, Sri
Lanka, Vietnam, Nigeria, Côte d‟ Ivoire, Philippines, Cameroon, Cambodia,
Liberia, Brazil, Myanmar, Bangladesh, Papua New Guinea, Ghana, Gabon,
Guatemala, and Zaire (Barlow, 1996; IRSG, 2002). In last 1970s, several rubberproducing countries recognized sub-optimal sites marked as non-traditional,
evidently (i) to fulfil demanding of growers and consumers; (ii) to reward for crops
diversification cultivated in the traditional areas; and (iii) to develop the living
standards of people in non-traditional areas (Priyadarshan et al., 2005; Priyadarshan
and Goncalves, 2003; Pushparajah, 1983).
In 1839, the vulcanization manner established and was measured as an
essential breakthrough in the improvement of the rubber industry. In 1876, 70,000
rubber seeds (later known as the Wickham's Collection) were taken from Brazil to
the Royal Botanic Garden at Kew, England. In 1877, some of these seedlings were
sent to Ceylon (now Sri Lanka), thirteen to the Singapore Botanic Garden and nine
4
to Kuala Kangsar. Might be this was how the rubber tree came to the East, still
believed that the rubber trees widespread until today (in the East) Wickham's
Collection is originated (Board, 2009).
Seedlings about 1919 were the last packed delivery in movable greenhouses
was sent to Ceylon but, 90 per cent of these seedlings were survived; 18 of
seedlings were sent to the Botanic Gardens at Bogor, Indonesia and only two
survived. 50 seedlings were sent to Singapore and only one survived. In some of
these countries; Sri Lanka, Java, Singapore and afterwards Malaya had obtained
seedlings from Kew Garden in 1876 and extra 22 trees were sent to Singapore
during 1877 (Priyadarshan, 2003).
The Association of Natural Rubber Producing Countries (ANRPC, 2010)
expected that from 2003 to 2010 the land expansion more than 1,500,000 ha were
changed to rubber in southern China, Thailand, Vietnam, and Cambodia. To an
increasing extent, the economic reimbursements should be focus and compare to
other resources losing (Tiva et al., 2016). During the last decade, the highest global
demanding for natural rubber is motivating the increase of industrial‐scale and
smallholders with > 2 million ha recognized. Our evaluation that 4.3–8.5 million ha
of supplementary rubber estates are compulsory to meet projected demand by 2024,
bullying important areas of Asian forest, as well as various protected areas (Thomas
et al., 2015).
5
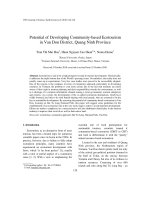
Figure 2.1 Map of rubber plantation areas in the world Source: Eleanor WarrenThomas, Paul M. Dolman and David P. Edwards (2015). Increasing Demand for
Natural Rubber Necessitates a Robust Sustainability Initiative to Mitigate Impacts
on Tropical Biodiversity. Conservation letters. Article first published online: 17
APR 2015. DOI: 10.1111/conl.12170
2.1.2 Rubber plantation in Vietnam
Rubber plantation was familiarized into Vietnam and has been established
since 1906 in the Southeast Region. Vietnam has gotten a huge portion of the Hevea
germplasm collection of the IRRDB mission in 1981 (Van Lam et al., 2012).
Rubber expansion area in Vietnam is credited to the growth of the rubber
smallholders. Its division in total rubber land increased from 27.2% to 37.2 %
(1999-2004). In 2020, the target of rubber is reached to 700,000 ha and the rubber
smallholders factor will more escalation (EVRA, 2006). In Vietnam, areas under
rubber estates are mostly in the South-eastern region (65.2%), the highlands
(23.4%), central coastal area (9.7%) and the new areas mechanized in the Northwestern region, 1.6% (Hoa, 2010; Van Lam et al., 2012).
6
Table 2.2 Rubber areas, production and average annual yield (PHAN
THÀNH DŨNG, 2015)
Years
Total area
Rubber
Average annual
(ha)
production (Ton)
yield
(Kg/ha/year)
1976
76,600
40,200
700
1980
87,700
41,100
703
1985
180,200
47,900
753
1990
221,700
57,900
714
1995
278,400
124,700
849
2000
421,200
290,800
1,256
2005
482,700
481,600
1,441
2010
748,700
751,700
1,712
2011
801,600
811,600
1,716
2012
917,900
877,100
1,720
2013
958,800
946,900
1,728
2014
977,700
953,700
1,692
2015
980,000
1,000,000
1,740
2.1.3 Biological characteristics of rubber
Rubber leaves develop on the leaf stalks acknowledged as the petioles and
linked by the petiolules. While the petiole drops off, a scar is left on the twig,
branch or stem. Leave of rubber have known that defoliates its leaves annually,
during the dry season (January to March). In the winter, transpiration through the
rubber leave to the atmosphere is reduced. The bud found among the petiole and the
branch is known as the axillary bud. The leaf scar left by the falling petiole also has
a bud known as the scale bud. The bud that grows into a branch is known as latent,
while the one that does not is called a dormant bud. At the very tip of the rubber
plant, there is also a bud known as the apical bud, which is ever-growing and forms
7
the tree height. The Para rubber is a flower-bearing tree and the flowers are of the
inflorescence type, where both the males and females can be found. Flowers linked
to the axis, the central and the sides. The female flowers are found only at the tip of
the axis (central and sides) and the male flowers in the inflorescence. The male
flower contains the anther and the pollen grains, while the female contains the
stigma and the ovary. While the pollen grains come in the female flower by the
stigma, fertilisation takes place. We have known that the pollination process always
involves from insects. Pollination produces fruits existing of two to five seeds in
each pod. The processing of pollination to seed fall is around five months. The
pollination of its flowers we can conduct by manually that had known that manual
practice. Hand pollinated seeds are generally compulsory for the breeding purpose.
The whole outer hardcover of the rubber seed and fruit is purely made up of the
female tissue. The realization of the fruit cannot follow without fertilization
between the fusion of male and female gametes. The embryo which is found in the
centre of the seed is the result of the union between the male and the female cells
and inherits the characteristics of both. The embryo germinates and eventually
grows into a tree. Seeds of a single mother tree (clone) exhibit visual characteristics
that can be accurately identified.
The trunk contains the central column known as the pith or medulla which is
fenced by the bark. The tree bark there is three main layers, the outermost of which
is the soft bast where latex-bearing vessels are found. The Center between of bark
and the wood as known cambium, a soft thin layer, which by mitosis keeps a supply
of new conducting pipes for the upward and downward streams, by producing new
wood cells inwardly and new bast outwardly as the tree grows in size. The
medullary rays are horizontally situated in the bark. Their functions are to source
water to the bark in one direction and food to the wood in the other direction. Latex
is the yield of the rubber tree and establishes in the latex vessels. It is a whitish
milky fluid containing rubber hydrocarbon in the form of small globules floating in
an aqueous solution containing proteins, amino acids, carbohydrates and various
8
electrolytes. Latex has still measured a byproduct of the rubber tree, but a highly
valuable raw material to mankind.
The roots are part of the plant that attaches it to the ground. Para rubber there
is 3 root types. The taproot is the main central root that penetrates deep down the
soil and keeps the rubber tree upright. The main and sub-laterals grow on it and
provide anchorage to the tree. Feeder roots, which are numerous, grow on the
laterals. Their functions are to absorb water by osmosis. At the tips of the feeder
roots are the root hairs which absorb the nutrient solution. The water absorbed by
the feeder roots is forced into the central cylinder of the wood vessels and to the
leaves. These remove the mineral food, retain water that is needed by the plant, and
release the excess moisture through the stomata. The rubber tree takes in oxygen
from the atmosphere through the stomata and lenticels and gives out carbon dioxide
as a waste product of the respiratory process (Board, 2009).
2.1.4 Natural condition requirements of rubber
Research conducted by several authors (Tran and Nguyen, 2016;
Priyadarshan et al., 2005; Rao and Vijayakumar, 1992) showed the optimum
climatic for rubber trees as follows:
- A rainfall of 2000 mm or more evenly distributed without any marked dry
season and with at least 100 rainy days per year.
- Temperature range from 20 to 34°C, with a monthly mean of 25 to 28°C.
- The high atmospheric humidity of around 80% with the absence of strong
wind.
- Bright sunshine amounting to about 2000 hours per year at the rate of six hours
per day throughout the year.
- Soil depth is at least 100 cm with the absent stone
- Clay 30%, Sand 30% and pH level: 4.5-5.5.
- Slope not stronger than 16 degrees.
- Water table below 1.0 m.
9
2.2 Soil quality indicators
The climate change in the present, land degradation and biodiversity loss,
soils have become one of the most vulnerable resources in the world (ITPS, 2015).
Soils are one of the Earth's essential natural resources, yet they are often taken for
granted. Most people do not realise that soils are a living, breathing world
supporting nearly all terrestrial life. Soils and the functions they play within an
ecosystem vary greatly from ODe location to another as a result of many factors,
including differences in climate, the animal and plant life living on them, soil's
parent material, the position of the soil on the landscape, and the age of soil
(Jhonson, 2009). A proper understanding of the physical and chemical properties of
the soil is necessary to make proper amendments early enough that would ensure a
good return on investment at later productive stages of rubber (Orimoloye et al.,
2010).
2.2.1 Soil texture
The soil texture representation with the standard textural fraction triplet
“sand-silt-clay” is commonly used to estimate soil properties (Martín et al., 2018).
Texture refers to the size of the particles that make up the soil. The terms sand, silt,
and clay refer to relative sizes of the soil particles. Sand, being the larger size of
particles, feels gritty. Clay, being the smaller size of particles, feels sticky. It takes
12,000 clay particles lined up to measure one inch. Silt, being moderate in size, has
a smooth or floury texture (Whiting et al., 2005). The texture of the soil determines
whether the soil can retain water and nutrients. It is, therefore, considered important
in terms of soil fertility (Board, 2009).
2.2.2 Soil bulk density
Soil bulk density is one of the most frequently used measures of compaction. Dry
bulk density is determined by the value of weight (mass) of dry matter in a soil
sample that occupies a core of known volume. The core sampling method usually
determines bulk density (Abu-Hamdeh and Al-Jalil, 1999; Prikner et al., 2004).
10
Many of the physical properties important for assessing soils in agricultural systems
are the same for forest soils. However, because of the nature of forest soils and
terrain associated with forest ecosystems, the most appropriate methods for
agricultural soils are not always suitable for forest soils. Coarse fragments, large
roots, and steep slopes limit the suitability of some methods for forest soils (PageDumroese et al., 1999; Maynard and Curran, 2008). Soil bulk density is the mass
per unit volume of soil. In agriculture, the reference massif after oven-drying, and
the volume is for the < 2-mm fabric, inclusive of solids and pore space (Grossman
and Reinsch, 2002).
2.2.3 Soil density
The degree of compaction of a soil is measured by determining the apparent
(bulk) density of the soil. The determination is a simple procedure, involving the
insertion of a small (5-cm diam. X2-cm deep) ring into the soil. The ring is carefully
excavated, trimmed level at the top and bottom and dried for 48 hours at l00 oC. The
density is the dry weight of the soil in each cubic centimetre of volume; this volume
includes both solid particles and the spaces between the particles - the porosity. The
more compact a soil the higher the density; that is, the higher the weight of soil
particles compressed into each cubic centimetre and the smaller the air spaces
(R.W.Sheard, 1991).
2.2.4 Soil porosity
Effective porosity is generally defined for solute transport as that portion of
the soil or rock through which chemicals move, or that portion of the media that
contributes to flow (Domenico and Schwartz, 1990; Fetter, 1993; Stephens et al.,
1998). Soil porosity is widely recognized to be the best indicator of soil structure
quality (Marcello et al., 2006).
A soil‟s porosity and pore size distribution characterize its pore space, that portion
of the soil‟s volume that is not occupied by or isolated by solid material. The basic
character of the pore space affects and is affected by critical aspects of almost
11
everything that occurs in the soil: the movement of water, air, and other fluids; the
transport and the reaction of chemicals; and the residence of roots and another biota
(Nimmo and Hillel, 2004).
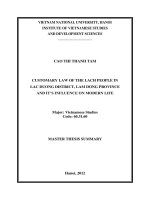
2.2.5 pH of the soil
pH is used to measure the acidity or alkalinity the growth medium. Plants
grown in soils with inappropriate pH will fail. The pH at which most nutrients are
freely available for absorption by plant roots is pH 6.5 in soils and pH 5.8 in
composts. Similarly, there are many plants grown in commercial crop production
that will only tolerate a narrow band of acidity. Accurate pH management is
therefore vital to ensure success.
Soil pH is known to have a considerable effect on the activities of microbial
communities and the biogeochemical processes which they mediate. Soil pH will
affect the chemical form, concentration and availability of substrates (Kemmitt et
al., 2006) and will influence cell growth and activity. There is also strong evidence
that soil pH is an important determinant of bacterial diversity and community
structure on a global scale (Fierer and Jackson, 2006). The mechanisms by which
soil pH influences the growth and activity of some microbial functional groups have
been determined through a combination of physiological and soil microcosm studies
(Nicol et al., 2008).
Figure 2.2 Possible pH ranges under the natural soil, Source: (GLOBE, 2005)
12
2.2.6 Soil moisture
Water and energy fluxes at the surface/atmosphere interface are strongly
dependent upon soil moisture. Evaporation, infiltration and runoff are driven by
surface soil moisture (SSM), while soil moisture in the vadose zone governs the rate
of water uptake by vegetation. Soil moisture is thus a key variable in the hydrologic
cycle. The spatiotemporal evolution of soil moisture fields is an important factor for
numerical weather and climate models and should be accounted for in hydrology
and vegetation monitoring (Kerr et al., 2001). Actual transpiration decreased with
decreasing soil moisture content and increasing potential transpiration (Denmead
and Shaw, 1962).
2.2.7 Nitrogen
Nitrogen is the seventh most abundant element in the universe. It‟s the single
most common element in the earth‟s atmosphere, comprising about 78% (4,000
trillion tons) of the gas that makes up our atmosphere. Nitrogen is found in all soils
and is required by all living creatures. In plants, nitrogen is the nutrient required in
the largest amounts. It is a key constituent of critical organic molecules such as
amino acids, nucleic acids, and proteins. Nitrogen is found in marine and
freshwaters and is present in some minerals. In short, nitrogen is found in every
ecosystem and in every part of the global environment (Walworth, 2013). The
system of agriculture which relies heavily on soil reserves to meet the nitrogen
requirements cannot long be effective in the producing high yields of crops
(Stevenson, 1965).
2.2.8 Phosphorus
Phosphorus (P) is one of the most limiting nutrients for the productivity of
the majority of crops grown on the highly weathered soils of tropical environments
(Novais and Smyth, 1999). Particularly, in soils under forest cover and pasture,
organic forms of P (Po) may represent 15 to 37 % of total extracted P, and 41 to 87
% of the total labile P is in organic form (Mello Cunha et al., 2007). Under these
13
conditions, Po becomes a major source of P to plants through decomposition and
mineralization of the labile Po fraction, which is easily mineralized, thereby
contributing to the availability of P to plants (Gatiboni, 2003; George et al., 2006;
Rita et al., 2013).
2.2.9 Carbon
Carbon (C) is one of the most common elements in the universe and found
virtually everywhere on earth: in the air, the oceans, soil, and rock. Carbon is part of
geologic history in rock and especially the ancient deposits that formed coal, oil and
other energy sources we use today. Carbon is also an essential building block of life
and a component of all plants and animals on the planet (Eli Corning et al., 2016).
At low organic carbon contents, the sensitivity of the water retention to changes in
organic matter content was highest in sandy soils. Increase in organic matter content
led to an increase in water retention in sandy soils, and to a decrease in fine-textured
soils. At high organic carbon values, all soils showed an increase in water retention.
The largest increase was in sandy and silty soils. Results are expressed as equations
that can be used to evaluate the effect of carbon sequestration and management
practices on soil hydraulic properties (Rawls et al., 2003).
2.3 Natural rubber-intercropping
Most of the income comes from rubber, complemented with temporary food
and cash crops during the early years. Perennial species that grow spontaneously
with rubber provide fruits, fuelwood and timber, mostly for household consumption
(Gouyon et al., 1993).
Turmeric is the rhizome or underground stems of ginger-like a plant. The
plant is a herbaceous perennial, 60-90 cm high with a short stem tufted leaf. Its
flowers are yellow, between 10-15 cm in length and they group together in dense
spikes, which appear from the end of spring until the middle session. No fruits are
known for this plant. The whole turmeric rhizome, with a rough, segmented skin.
The rhizome is yellowish-brown with a dull orange interior that looks bright yellow
14
when powdered. Rhizome measures 2.5-7.0 cm (in length), and 2.5 cm (in diameter)
with small tuber branching off. Turmeric held a place of honour in Indian traditional
Ayurvedic medicine. In ayurvedic it was prescribed for the treatment of many
medical problems ranging from constipation to skin diseases. It was used as
digestive aid and treatment for fever, inflammation, wounds, infections, dysentery,
arthritis, injuries, trauma, jaundice and other liver problems. In Unani turmeric is
considered to be the safest herb of choice for all blood disorders since it purifies,
stimulates and builds blood. Turmeric is a relatively broad spectrum antifungal.
Turmeric exhibits antioxidant activity and protects from free radical damage.
Curcumas also exhibits anti-tumour activities and prevent cancer. It inhibits the
topoisomerase enzyme, which is required for cancer (Lal, 2012). Turmeric is a kind
of crop which suitable for planting in the rubber rows despite less sunlight.
The sugarcane is a labour intensive crop, requires human workers for various
unit operations like planting, weeding, earthling up, fertilizer application, and
harvesting. Labour shortage during planting, weeding and harvesting periods of
sugarcane growing hamper agricultural operations causing crop losses. The labour
intensive methods lead to considerable losses in crop production (Dharmawardene,
2006).
Analysis of the cost components of sugarcane cultivation shows that
harvesting and loading of cane comprise 35% of the costs followed by land
preparation (21%), planting (16%), weeding (10%), fertilizer application (10%) and
irrigation (8%). Timely planting with a proper application of nutrients and plant
protection improves crop stand as well as sugar yield. The planting methods largely
affect the economics of sugarcane production.
Planting technology includes harvesting and detrashing seed cane,
preparation of seed, and placement of the planting material into the well-prepared
seedbed. The effectiveness of planting is affected by the quality and type of planting
material, layout, spacing, seed rate, nutrients and method of placement.
Mechanization of various operations reduces labour dependency and help in
15
performing farm operations at the proper time. Mechanization of the sugarcane
planting has been effected through the development of machines for different unit
operations separately or in combination (Nalawade et al., 2017).
2.3.1 Challenges of intercropping in a rubber plantation
In order to prevent further conversion of rubber to other crops, a technology
that can be developed is the cultivation of rubber with a wide row spacing (18 m x 2
m) x 2.5 m. The population of rubber using this planting distance is 400 trees/ha.
Using this wide spacing, smallholders could cultivate intercrops such as maize,
Pueraria phaseoloides, turmeric, cassava, etc. between rubber rows. The main
constraint in developing rubber intercropping is the low intensity of light because of
the shade canopy of the rubber plant. When the rubber plant is four years old, with a
planting distance of 6 m x 3 m, the light reduction could be 75%. The intercrops
planted in the shade gave 50% lower yield compared to the same crop planted
without shade (Sahuri, 2015; Sopandie et al., 2002; Wirnas et al., 2005). Therefore,
there is a need for change in the spacing of the rubber. However, with the planting
distance of 6 m x 4 m, at the age of 27 months, the light intensity was 20%,
whereas, at the distance of (12 m + 4 m) x 2.5 m, the light intensity was 60%. The
intercropping could be established until 5 years for planting distance of 12 m x 1.66
m, while for hedge row planting distance (12 m + 4 m) x 2.5 m the intercropping
could be established until 6 years (Sahuri, M., and Dwi Shinta, 2016).
2.3.2 Benefits of intercropping in a rubber plantation
One possible method is the development of rubber intercropping. Show that
intercropping between rubber rows could increase the income of smallholders. It
also helped in maintaining the rubber plantation, increase soil organic matter and
improve soil physical and chemical fertility. Wide row spacing in rubber plantation
has a good prospect, because, until the third year, smallholders obtained a yield
from the intercrops, whereas the growth of rubber was normal (Sahuri, M., and Dwi
Shinta, 2016). During maintenance around 6 years, in rubber plantations all
16