Tài liệu Trade2001 pptx
Bạn đang xem bản rút gọn của tài liệu. Xem và tải ngay bản đầy đủ của tài liệu tại đây (55.82 KB, 11 trang )
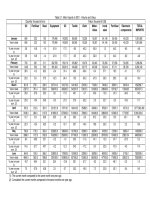
Table 2.1: Main Imports in 2001 - Volume and Value.
(Quantity: thousand of tons) (Value: thousand of US$)
Oil Fertiliser Steel Equipment Oil Textile Cloth Motor-
bikes
Iron&
steel
Fertiliser Electronic
components
TOTAL
IMPORTS
January
666 222 193 178,495 142,903 88,580 15,236 18,957 54,146 29,455 45,033 1,051,885
Year to date
666 222 193 178,495 142,903 88,580 15,236 18,957 54,146 29,455 45,033 1,051,885
% year on year
(1)
5.8 14.8 -1.4 -21.8 17.5 -9.5 -40.3 -52.9 1.2 44.3 -9.0 -4.8
% year on year
cum. (2)
5.8 14.8 -1.4 -21.8 17.5 -9.5 -40.3 -52.9 1.2 44.3 -9.0 -4.8
February
760 281 311 202,769 159,110 105,802 15,479 30,043 79,268 37,656 53,695 1,208,264
Year to date
1,426 502 503 381,264 302,013 194,382 30,715 49,000 133,414 67,111 98,728 2,260,149
% year on year
(1)
36.5 -0.3 82.2 -2.4 31.4 49.9 -29.4 8.4 57.1 18.3 4.1 27.2
% year on year
cum. (2)
20.2 5.9 37.5 -12.5 24.4 15.3 -35.3 -27.9 28.3 28.5 -2.3 10.0
March
901.8 279.1 296.5 207214.3 191270.6 149199.3 23198.3 71000.0 74646.2 38081.5 34918.4 1392288.7
Year to date
2327.8 781.4 800.0 588478.2 493283.3 343581.5 53913.5 120000.0 208060.3 105192.7 133646.5 3652437.5
% year on year
(1)
35.8 -37.8 30.3 0.6 17.8 48.1 -5.7 45.9 13.8 -31.5 -34.9 14.5
% year on year
cum. (2)
25.8 -15.4 34.8 -8.3 21.8 27.6 -25.2 2.9 22.7 -2.5 -13.6 11.7
April
870.2 212.6 367.0 221521.8 179716.7 166418.5 25086.5 64000.0 87939.7 27807.3 43712.2 1,377,562,460
Year to date
3198.0 994.0 1167.0 810000.0 673000.0 510000.0 79000.0 184000.0 296000.0 133000.0 177358.7 5,030,000,0
% year on year
(1)
13.7 0.9 62.9 30.5 4.6 56.2 -3.3 67.2 35.6 12.5 42.1 18.1
% year on year
cum. (2)
22.3 -12.4 42.5 -0.2 16.7 35.7 -19.4 18.8 26.3 0.3 2.2 13.4
May
798.0 178.0 363.0 232000.0 186000.0 167000.0 33000.0 42000.0 91000.0 21000.0 30854.7 1438000.0
Year to date
3996.0 1172.0 1530.0 1042000.0 859000.0 677000.0 112000.0 226000.0 387000.0 154000.0 208213.4 6468000.0
% year on year
(1)
-8.4 -50.9 35.1 -0.2 -1.0 30.3 -11.6 -19.1 12.0 -57.7 -27.8 5.2
% year on year
cum. (2)
14.6 -21.7 40.7 -0.2 12.3 34.3 -17.2 9.3 22.6 -15.5 -4.3 11.4
June
844.0 190.0 368.0 239000.0 179000.0 150000.0 23000.0 59000.0 90000.0 24000.0 51108.1 1362000.0
Year to date
4840.0 1362.0 1898.0 1281000.0 1038000.0 827000.0 135000.0 285000.0 477000.0 178000.0 259321.5 7830000.0
% year on year
(1)
-18.7 -50.4 52.1 22.4 -13.9 39.1 -21.7 -0.2 23.3 -48.1 0.5 1.5
% year on year
cum. (2)
7.0 -27.6 42.8 3.3 6.7 35.2 -18.0 7.2 22.8 -22.1 -3.4 9.6
(1): The current month compared to the same month one year ago
(2): Cumulated: the current months compared to the same months one year ago.
(Quantity: thousand of tons) (Value: thousand of US$)
Oil Fertiliser Steel Equipment Oil Textile Cloth Motor-
bikes
Iron&
steel
Fertiliser Electronic
components
TOTAL
IMPORTS
July
703.0 263.0 338.0 249000.0 146000.0 119000.0 19000.0 52000.0 82000.0 31000.0 39266.8 1324600.0
Year to date
5543.0 1625.0 2236.0 1530000.0 1184000.0 946000.0 154000.0 337000.0 559000.0 209000.0 298588.3 9154600.0
% year on year
(1)
1.4 -9.9 40.9 26.1 -6.1 4.8 -20.3 -2.2 17.0 -16.1 -14.4 6.6
% year on year
cum. (2)
6.2 -25.2 42.5 6.5 4.9 30.4 -18.3 5.6 21.9 -21.3 -5.0 9.1
August
607.0 242.0 390.0 228000.0 124000.0 122000.0 19000.0 64000.0 92000.0 29000.0 40756.5 1303400.0
Year to date
6150.0 1867.0 2626.0 1758000.0 1308000.0 1068000.0 173000.0 401000.0 651000.0 238000.0 339344.8 10458000.0
% year on year
(1)
4.3 -43.4 73.1 17.2 -15.9 14.3 -18.3 -6.8 38.3 -48.7 -17.2 -0.1
% year on year
cum. (2)
6.0 -28.2 46.3 7.7 2.5 28.4 -18.3 3.4 24.0 -26.1 -6.7 7.9
September
432.436 116.248 223.603 222046 91823 114737 16964 59964 53851 13878 50328.197 1179524
Year to date
6582.436 1983.248 2849.603 1980046 1399823 1182737 189964 460964 704851 251878 389673 11637524
% year on year
(1)
-37.3 -69.9 21 37 -53.3 5.1 -25 -33.7 3.7 -72.8 -18.3 -8.4
% year on year
cum. (2)
1.4 -33.6 44 10.4 -4.9 25.6 -19 -3.6 22 -32.5 -25.1 6
October
942 320 307 279,355 185,297 133,075 26,006 53,519 75,755 39,606 37,079 1,509,627
Year to date
7,524 2,304 3,157 2,259,401 1,585,120 1,315,812 215,970 514,483 780,606 291,484 426,752 13,147,151
% year on year
(1)
72.0 -9.0 45.2 -2.6 21.8 14.0 2.5 -33.5 24.8 -19.8 -52.0 6.9
% year on year
cum. (2)
6.9 -31.0 44.1 8.6 -2.4 24.4 -16.9 -7.9 22.4 -31.0 -28.6 6.1
November 736 589 294 216,495 125,972 140,364 48,706 24,079 72,400 73,277 40,990 1,394,437
Year to date
8,260 2,892 3,451 2,475,896 1,711,092 1,456,176 264,676 538,562 853,006 364,761 467,742 14,541,588
% year on year
(1)
-22.6 81.9 18.1 7.5 -49.2 -3.7 66.3 -65.7 5.6 68.4 -39.6 -0.4
% year on year
cum. (2)
3.4 -21.0 41.4 8.5 -8.6 21.0 -8.4 -14.4 20.8 -21.7 -29.7 5.4
December
1,738 297 487 265,314 116,446
133,420 50,324
131,151 111,608 39,229 35,293 1,620,753
Year to date
9,998 3,189 3,938 2,741,210 1,827,538 1,589,596 315,000 669,713 964,614 403,990 503,035 16,162,341
% year on year
(1)
120.3 -4.8 14.0 -8.3 -37.2 -38.7 107.6 -17.1 5.8 -8.1 -57.2 -12.0
% year on year
cum. (2)
13.9 -19.7 37.3 6.6 -11.2 11.8 0.5 -14.9 18.8 -20.6 -32.7 3.4
(1): The current month compared to the same month one year ago
(2): Cumulated: the current months compared to the same months one year ago.
Chart 2.1.1
Socio-economic statistical bulletin - UNDP
Main Imports in 2001
Year to date (December)
-
50
100
150
200
250
300
Jan Feb Mar Apr May Jun Jul Aug Sept. Oct Nov Dec
USD million
Equipment Oil Textile Cloth Elec. components Iron & steel Fertiliser Motorbikes
Chart 2.1.2
Socio-economic statistical bulletin - UNDP
Share of main imports in total imports in 2001
Year to date
(December)
Other
45%
Motorbikes
4%
Fertiliser
2%
Textile
10%
Oil
11%
Iron & steel
6%
Cloth
2%
Elec. components
3%
Equipment
17%
Chart 2.1.5
Socio-economic statistical bulletin - UNDP
Total Imports in 2000 and 2001
-
2,000
4,000
6,000
8,000
10,000
12,000
14,000
16,000
18,000
Jan Feb March April May June July Aug Sept Oct Nov Dec
USD million
2000 2001