Tài liệu CDMA Capacity and Coverage pdf
Bạn đang xem bản rút gọn của tài liệu. Xem và tải ngay bản đầy đủ của tài liệu tại đây (479.94 KB, 8 trang )
WHITE PAPER
CDMA
Capacity and Coverage
CDMA
Capacity and Coverage
Abstract
The performance of a CDMA system can be difficult to assess. Link budget
calculations can be used to verify performance margins for a particular set of
parameters, but fail to tell the “whole” story in an easy to understand, visual
way. In this paper, a graphical depiction of CDMA coverage vs. capacity is
shown to be a useful tool in evaluating the performance of a CDMA system.
The graphical results are used to show scenarios in which CDMA can be both
uplink and downlink limited. In particular, it is shown that in either case, the
addition of a low noise tower mounted amplifier (TMA) can benefit both the
coverage and the capacity of the CDMA system. The analysis is then extended
to demonstrate how a TMA can be used to benefit the uplink performance of a
1xEV-DO data system.
Unanswered Questions
Is CDMA uplink or downlink limited?
Is CDMA capacity or coverage limited?
Is CDMA noise or interference limited?
Are tower mounted low-noise amplifiers of any benefit in CDMA voice or data
applications?
Literature surveys and conversations with “experts” will reveal contradictory
answers to each of these questions. Often, the answers are based on
assumptions which are not always stated or even understood. Sometimes
the answers are based on equipment limitations, rather than on any inherent
limitations of CDMA[1]. In other cases, the answers are buried so deeply within
the mathematics that they are unintelligible to the reader.
In reality, the answer to each of these questions is “it depends…” The goal of
this paper is to take existing mathematical analyses of CDMA performance and
present the results in a way that allows the system designers to understand how
various system parameters affect the answers to the above questions.
CDMA Capacity and Coverage
Page 3
CDMA Basics
The performance of any digital modulation technique
can be described in terms of a normalized ratio of energy
per bit (Eb) to noise density (No) required to achieve the
minimum desired bit error ratio (BER)[8]. The relationship
between this normalized value and the signal-to-noise
ratio over the entire occupied bandwidth (S/N) is given
by:
Solving for Eb/No, we have:
CDMA is a spread spectrum technique, which means
that the occupied bandwidth (W) is much greater
than the information bit rate (R). The ratio W/R then
becomes a factor by which the E
b
/N
o
is improved over
the full bandwidth S/N. The ratio W/R is known as the
“processing gain”. For a given modulation technique,
there is a minimum or threshold value of E
b
/N
o
(defined as g
t
) which is required to achieve acceptable
performance.
Given a set of system design parameters, and knowing
the required E
b
/N
o
, the allowable path loss can be
calculated. In order to perform this analysis, the
following parameters need to be defined:
g
t
Required E
b
/N
o
. This is defined by the modulation
technique and the detection method. A value of
9 dB is typical for EIA/TIA-95 [12], or 7 dB for EIA/
TIA-95 with receive dual-diversity [4].
R User (traffic channel) data rate. For EIA/TIA-95
voice, this can be either 9600 or 14400 bps.
W Occupied bandwidth after spreading. For EIA/TIA-
95, this is 1.2288 MHz.
P
bts
Composite base station transmit power per RF
channel. This is the combined total of all traffic,
paging and synch channels at the antenna input,
including the effects of cable loss on the tower.
x Percentage of base station power allocated to
traffic channels; typically about 0.8 (80%).
P
mob
Maximum mobile unit transmit power. This is the
mobile transmit power when the power control
parameter is set to maximum power.
NF
bts
Base station noise figure, including effects of cable
loss.
NF
mob
Mobile unit noise figure, including the effects of
receiver noise figure and environmental noise.
y Voice activity factor. CDMA systems can reduce
self-interference by muting transmission during
pauses in speech. This factor is the percentage of
time the voice is active. Qualcomm uses 0.375 [4];
other more conservative treatments use 0.4 [9] to
0.67 [5]. The effective value is slightly higher on
the downlink due to the need to send occasional
power control bits, even during pauses in speech.
h Loading factor. This is the ratio of “other cell”
interference to “own cell” interference. It is 0
in the case of no mutual interference (isolated
cells), and increases as cells overlap, and as mutual
interference thereby increases. h = 0.65 is used as
a typical value. [4]
F
r
Frequency reuse factor. This is calculated from the
loading factor as follows:
1/(1+h), or h = (1/F
r
)-1.
1
The value is 1 for no
interference (isolated cells), and decreases as
interference increases. F
r
= 0.6 is used as a typical
value [12].
u Orthogonality factor. Downlink channels are
transmitted with codes that are orthogonal to one
another; that is, they are encoded for minimal
mutual interference. Multipath propagation
causes the downlink signal to be “smeared”
in time, destroying some of this orthogonality.
The orthogonality factor is the percentage of
downlink orthogonality remaining at the mobile
receiver. The value will be 1 for a perfect signal
(no multipath) and near zero for a pure Rayleigh
fading environment. Typical values used range
from 0.4 to 0.9 [7])
G
sho
Soft-handoff gain. This is the downlink
improvement achieved by maximal ratio combining
in the mobile unit of signals from multiple base
stations. Typical values 0.4 to 1.5 dB [2].
C
sho
Soft handoff capacity overhead. This is the
percentage increase in the number of base station
channels which is required to support subscribers
in either two-way or three-way soft handoff.
Typical designs allow for approximately 30% of
calls to be in soft handoff [1]; that is, 30% of
the calls in process require channels from two,
or in some cases three, base stations. C
sho
will be
0 if there is no soft handoff (isolated cells), and
approximately 0.18 if 30% of calls are in soft
handoff.
1
Some authors define “frequency reuse” inversely to the way it
is defined here, i.e. as F= 1+h, or F= (total interference)/(own cell
interference) [9]. This parallels the general ambiguity in defining
“frequency reuse factor”. Some authors would define a seven cell reuse
pattern as having a frequency reuse factor of 7, while others would
define it as 1/7. When comparing various treatments, one must be sure
to understand which definition is being used. This paper assumes a
sense in which the reuse factor decreases as interference increases.
WN
RE
N
S
o
b
=
=
R
W
N
S
N
E
o
b
CDMA Capacity and Coverage
Page 4
Knowing these parameters, one can calculate, for a given
number of users (M), the maximum allowable path loss
between base station and mobile in both the uplink
and downlink paths. Then, for a given a set of antenna
gains, propagation models and desired fading margins,
this path loss can be equated to a radius of coverage.
In real world situations however, particularly in urban
areas, the desired results may be evident more in the
elimination of coverage holes and reduction in mobile
unit power, than by an increase in coverage radius.
For this reason, the results will be generalized to the
relationship between capacity and allowed path loss,
rather than coverage radius.
Details of the calculations are provided in Appendices A
and B.
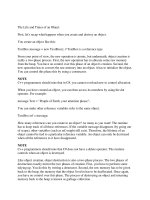
“Uplink Limited” Scenario
The first scenario assumes a relatively “clean”
propagation path, with little multipath, and therefore a
high orthogonality factor (0.9). Results for one typical
set of parameters are shown in Fig. 1.
Coverage vs. capacity is plotted for both the uplink and
downlink. The combinations of coverage and capacity
for which the system can operate are those below and to
the left of the lower of the two curves. In this case, an
8 dB base station noise figure (5 dB receiver noise figure,
plus 3 dB cable loss) results in a system in which both
capacity and coverage are strictly uplink limited (that is,
the dark blue curve is the limiting factor).
Reducing the effective base station noise figure to 3
dB through the use of a tower top amplifier improves
the uplink performance to the level described by the
light blue curve. Now, the system is limited by the
lower of the red and light blue curves. Because these
curves intersect, the system is no longer strictly uplink or
downlink limited.
The arrows show the amount of improvement achieved.
This improvement can be viewed either as an increase in
allowed path loss (and therefore, coverage) for a fixed
capacity, an increase in capacity for a fixed coverage
area, or a reduction in mobile transmit power for a given
capacity/coverage combination.
“Downlink Limited” Scenario
The next example assumes a less benign environment,
with considerable multipath propagation, resulting in a
low orthogonality factor of 0.3. Results for one typical
set of parameters are shown in Fig. 2
Unlike the previous example, this scenario shows a
system in which the coverage is uplink limited, but the
capacity is downlink limited. Such a capacity limit
is what leads some system designers to call CDMA
a “downlink” limited system. However, even in this
situation, tower-mounted low noise amplifiers (TMAs)
can still improve coverage and capacity.
Although the downlink limits the maximum, or “pole”
capacity of the system, the graph shows that at a typical
operating point, a TMA will still provide a significant
coverage improvement for a given number of users.
The amount of coverage improvement is greatest when
the typical usage is less than about half the theoretical
maximum capacity. The improvement, therefore, will be
greatest in more lightly loaded cells.
In addition to increasing the coverage possible at
maximum mobile transmit power, this improvement
also means that mobiles not at the edge of the cell will
be able to maintain communication with less transmit
power. This translates not only into longer battery life for
all users, but a potential increase in uplink coverage and
capacity for adjacent cells, because of the reduction of
intercell interference that occurs when mobile powers are
reduced [15].
Similarly, for a fixed coverage area, the addition of a TMA
can provide an increase in capacity. The increase is likely
to be somewhat less than was predicted in the “uplink
limited” scenario. However, the increase can still be
significant, again depending on the design parameters of
the system.
"Uplink Limited" Case
120
0 10 20 30 40
125
130
135
140
145
150
155
160
Number of users
Allowed path loss (dB)
Downlink
Uplink (no TMA)
Uplink (with TMA)
Coverage increase
for fixed #users
Capacity increase
for fixed coverage
Figure 1
Figure 2
0 10 20 30
Downlink
Uplink (no TMA)
Uplink (with TMA)
"Downlink Limited" Case
130
135
140
145
150
155
160
Number of users
Allowed path loss (dB)
Capacity
downlink
limited
Coverage
uplink
limited
Coverage increase for
fixed #users
Capacity increase for
fixed coverage
CDMA Capacity and Coverage
Page 5
Additional Factors
Not included in these calculations are the effects
of sectorization, imperfect power control, or such
techniques as smart antennas or multi-user detection.
A spreadsheet tool with graphical output makes a
useful tool for assessing system performance based on a
customized set of system parameters and/or technology
specific equations.
1xEV-DO Systems
We will now turn our attention to CDMA-based high
speed data systems, specifically to 1xEV-DO, including
1xEV-DO Rev. A.
Up to this point we have assumed voice-only systems, in
which capacity requirements are defined by the number
of users, which will be inherently the same for uplink and
downlink. In data systems, uplink and downlink capacity
requirements are not necessarily the same and, in fact,
may be highly asymmetric. Plotting uplink and downlink
performance on the same graph is therefore of limited
value. Not only is the uplink to downlink capacity ratio an
unknown, but the nature of data services allows a soft
degradation of service by limiting the data rate available
to each user.
For this reason, it is sufficient to treat uplink and
downlink performance independently. In this discussion,
we will focus on the uplink path only.
Total data throughput for a 1xEV-DO Rev. A sector is
given by [13] :
where
C
sector
total sector uplink throughput
R
c
chip rate (1.2288 Mcps for 1xEV-DO)
K number of active users per sector
E
cp
/N
t
pilot energy (per chip) to noise density ratio seen
at BTS
E
b
/N
t
data energy (per bit) to noise density ratio seen at
BTS
E[] expected value
f other-cell interference factor (typical value 0.68 [3])
G
ovhd
1+G
DRC
+G
RRI
+G
DSC
(Data Rate Control, Reverse Rate
Indicator and Data Source Control channel gains
relative to pilot)
and RoT is “Rise over Thermal”, which is the ratio of total
power (uplink signals, interferers and noise) to thermal
noise as seen at the base station front end [13]:
1xEV-DO power control algorithms work to keep E
cp
/N
t
and E
b
/N
t
at the minimum necessary for successful
demodulation, resulting in a fixed RoT for a targeted
coverage area and sector throughput.
Effect of Noise Figure Reduction on 1xEV-DO
Uplink Performance
Case 1
For a system set up to operate at a fixed RoT and sector
throughput, a reduction in base station noise figure
(through the use of a tower-mounted amplifier) benefits
system performance in two ways:
First of all, a lower value of N
o
means that the
targeted E
b
/N
o
and RoT values can be achieved with a
proportionally lower value of received energy. Therefore,
in the original coverage area, all access terminals can
operate with a proportionally lower uplink transmit
power. If the noise figure reduction is implemented
at all adjacent sites as well (so that the adjacent cell
interference factor drops proportionally), the relationship
is direct: a 5 dB reduction in noise figure will allow all
access terminals in the original coverage area to operate
at 5 dB lower transmit power.
As a corollary to this, the same operating point can
be achieved by access terminals operating up to their
maximum uplink power, but with a proportionally higher
path loss. The result is an increased coverage area.
Again, if the noise figure reduction is implemented at
adjacent sites, the improvement is directly proportional:
a 5 dB reduction in noise figure increases the path loss
budget by 5 dB.
Case 2
If the system operator is satisfied with the coverage area,
but needs to increase uplink data throughput, a tower-
mounted amplifier can help here as well.
Typically, 1xEV-DO systems operate at an RoT of 3-5 dB,
depending on loading factor and intercell interference
levels. This results in a fixed relationship between the
number of users and total sector throughput [3].
In order to increase sector throughput, operation
at a higher level of RoT is required. This can lead to
instabilities in uplink power control loops; however,
1xEV-DO Revision A includes improvements to stabilize
these algorithms, making operation at higher RoT more
practical.
o
oavg
N
NEKf
RoT
++
=
)()1(
[ ]
+
=
ovhd
avg
t
cp
avg
t
b
ctor
GE
N
E
K
f
RoT
E
N
E
RC
1
1
1
1
sec