Slide thương mại quốc tế chapter 3 labor productivityand comparative advantagethe ricardian model
Bạn đang xem bản rút gọn của tài liệu. Xem và tải ngay bản đầy đủ của tài liệu tại đây (1.16 MB, 33 trang )
Chapter 3
Labor Productivity
and Comparative Advantage:
The Ricardian Model
Preview
Opportunity costs and comparative advantage
A one factor Ricardian model
◦ Production possibilities
◦ Gains from trade
◦ Wages and trade
Misconceptions about comparative advantage
3-2
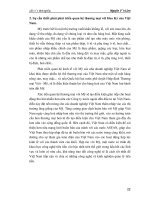
Introduction
Theories of why trade occurs can be grouped
into three categories:
◦ Market size and distance between markets determine
how much countries buy and sell (Gravity model).
◦ Differences in labor, physical capital, natural resources
and technology create productive advantages for
countries (Countries are different).
◦ Economies of scale (larger is more efficient) create
productive advantages for countries.
=> Practical international trade patterns reflect the
interaction of all of these motives.
1
Vu Thanh Huong, UEB – VNU, Hanoi
CuuDuongThanCong.com
/>
Gravity model
The gravity model postulates that, other things
equal, the larger (and the more equal in size) and
the closer the two countries are, the larger the
volume of trade between them is expected to be.
The volume of trade in goods increases with the
size and proximity of trading partners.
US: expect that US trade more with its neighbors
Mexico and Canada than with similar but more
distant nations
US: expect that US trade more with large nations
such as China and Japan than with smaller ones.
4
Gravity model (cont.)
Country
Exports (billion
USD)
Imports (billion
USD)
Exports plus
imports (billion
USD)
Canada
212.2
293.3
505.5
Mexico
120.3
172.1
292.4
China
41.8
234.5
276.3
Japan
53.3
138.0
191.3
Germany
33.6
84.6
118.2
United Kingdom
376
50.5
88.1
South Korea
27.1
43.8
70.9
Taiwan
21.5
34.8
56.3
France
22.3
33.8
56.1
Italia
11.2
31.0
41.2
5
Introduction (cont.)
Theory of Group 2
◦ The Ricardian model (chapter 3) says
differences in productivity of labor
between countries cause productive
differences, leading to gains from trade.
Differences in productivity are usually explained by differences
in technology.
◦ The Heckscher-Ohlin model (chapter 4) says
differences in labor, labor skills, physical
capital and land between countries cause
productive differences, leading to gains from
trade.
3-6
2
Vu Thanh Huong, UEB – VNU, Hanoi
CuuDuongThanCong.com
/>
Absolute advantage
Adam Smith:
◦ trade between countries is based upon absolute
advantage
When one country is more efficient than
another in the production of a commodity
but less efficient than the other country in
the production of another commodity, then
both countries can gain from specializing in
the production of the commodity of its
absolute advantage
Illustration of absolute advantage
US
UK
Wheat (bushels/hour of labor)
6
1
Cloth (meters/hour of labor)
4
5
The US has an absolute advantage over
the UK in wheat production
The UK has an absolute advantage over
the US in cloth production
Illustration of absolute advantage (cont.)
US
UK
Wheat (bushels/hour of labor)
6
1
Cloth (meters/hour of labor)
4
5
The US would specialize in wheat and the
UK in cloth production.
The US would be better off by 2m of cloth
The UK would be ahead by 24m of cloth
=> Both nations gain, but the UK gain more.
3
Vu Thanh Huong, UEB – VNU, Hanoi
CuuDuongThanCong.com
/>
Comparative Advantage and Opportunity Cost
The Ricardian model uses the concepts of
opportunity cost and comparative advantage to
explain why it is the interests of countries to
trade.
The opportunity cost of producing something
measures the cost of not being able to produce
something else.
◦ Going to work and going to university
◦ An enterprise: 1 hour can produce 2 tons of R or 10
tons of Steel => OC of producing a ton of R?
◦ An enterprise: needs 2 hours to produce 1 R and 4
hours to produce 1 S => OC of producing a ton of
R?
310
Comparative Advantage
and Opportunity Cost (cont.)
A country faces opportunity costs when it
employs resources to produce goods and
services.
E.g: Opportunity costs related to roses and
computers between the US and Ecuador.
The model: two countries, two commodities,
one factor model.
Comparative Advantage
and Opportunity Cost (cont.)
Workers could be employed to produce either
roses or computers
◦ The opportunity cost of producing computers:
the amount of roses not produced.
◦ The opportunity cost of producing roses:
the amount of computers not produced.
A country faces a trade off: how many
computers or roses should it produce with the
limited resources that it has?
4
Vu Thanh Huong, UEB – VNU, Hanoi
CuuDuongThanCong.com
/>
Comparative Advantage
and Opportunity Cost (cont.)
Suppose:
◦ US: 10 million roses can be produced with the same
resources that could produce 100,000 computers.
◦ Ecuador: 10 million roses can be produced with the
same resources that could produce 30,000
computers.
Quick quiz:
◦ What are goods of comparative advantage of each
country?
Comparative Advantage
and Opportunity Cost (cont.)
Ecuador has a lower opportunity cost of
producing roses.
◦ Ecuador can produce 10 million roses, compared to
30,000 computers that it could otherwise produce.
◦ The US can produce 10 million roses, compared to
100,000 computers that it could otherwise produce.
Comparative Advantage
and Opportunity Cost (cont.)
The US has a lower opportunity cost in
producing computers.
◦ Ecuador can produce 30,000 computers, compared to
10 million roses that it could otherwise produce.
◦ The US can produce 100,000 computers, compared
to 10 million roses that it could otherwise produce.
◦ The US can produce 30,000 computers, compared to
3.3 million roses that it could otherwise produce.
5
Vu Thanh Huong, UEB – VNU, Hanoi
CuuDuongThanCong.com
/>
Comparative Advantage
and Opportunity Cost (cont.)
A country has a comparative advantage in
producing a good if the opportunity cost of
producing that good is lower in the country
than it is in other countries.
A country with a comparative advantage in
producing a good uses its resources most
efficiently when it produces that good compared
to producing other goods.
Comparative Advantage
and Opportunity Cost (cont.)
The US
◦ has a comparative advantage in computer production
◦ uses its resources more efficiently in producing computers
compared to other uses.
Ecuador
◦ has a comparative advantage in rose production
◦ it uses its resources more efficiently in producing roses
compared to other uses.
Suppose initially that Ecuador produces
computers and the US produces roses, and that
both countries want to consume computers and roses.
Can both countries be made better off?
Comparative Advantage and Trade
Millions of
Roses
Thousands of
Computers
U.S.
-10
+100
Ecuador
+10
-30
0
+70
Total
The US gives up
producing roses
and only
produce
computers
Ecuador gives
up producing
computers and
only produce
roses
6
Vu Thanh Huong, UEB – VNU, Hanoi
CuuDuongThanCong.com
/>
Comparative Advantage and Trade (cont.)
When countries specialize in production in
which they have a comparative advantage,
◦ more goods and services can be produced and
consumed.
◦ Initially, the world consumes10 million roses and 30
thousand computers.
◦ After specialization: still consume 10 million roses,
but could consume 70,000 more computers.
Copyright © 2006 Pearson Addison-Wesley.
All rights reserved.
319
A One Factor Ricardian Model
Copyright © 2006 Pearson Addison-Wesley.
All rights reserved.
320
Assumptions
1.
Only two countries are modeled: domestic and foreign.
2.
Only two goods are important for production and consumption:
wine and cheese.
3.
Labor is the only production factor
4.
Labor productivity varies across countries, usually due to
differences in technology, but labor productivity in each country
is constant across time.
5.
The supply of labor in each country is constant.
6.
Labor is fully employed and mobile between industries.
7.
Competition allows laborers to be paid a “competitive” wage, a
function of their productivity and the price of the good that they
can sell, and allows laborers to work in the industry that pays the
highest wage.
Copyright © 2006 Pearson Addison-Wesley.
All rights reserved.
321
7
Vu Thanh Huong, UEB – VNU, Hanoi
CuuDuongThanCong.com
/>
Unit labor requirement
An unit labor requirement: the constant
number of hours of labor required to produce
one unit of output.
◦ aLW : the unit labor requirement for wine in the
domestic country.
aLW = 2???
◦ aLC : the unit labor requirement for cheese in the
domestic country.
aLC = 1???
◦ A high unit labor requirement means low labor
productivity.
Copyright © 2006 Pearson Addison-Wesley.
All rights reserved.
322
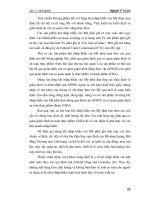
Production Possibilities
The production possibility frontier (PPF) of an economy shows
the maximum amount of goods that can be produced for a fixed
amount of resources.
The total number of labor hours worked in the domestic country: L.
QC : the quantity of cheese produced
QW: the quantity of wine produced,
Then the production possibility frontier of the domestic economy has
the equation:
aLCQC + aLWQW = L
Labor required for
each unit of
cheese production
Total units
of cheese
production
Labor required for
each unit of wine
production
Total amount of
labor resources
Total units
of wine
production
Copyright © 2006 Pearson Addison-Wesley.
All rights reserved.
323
Production Possibilities (cont.)
Then the production possibility frontier of the domestic economy has
the equation:
aLCQC + aLWQW = L
Labor required for
each unit of
cheese production
Total units
of cheese
production
Labor required for
each unit of wine
production
Total amount of
labor resources
Total units
of wine
production
QW = L/aLW – (aLC /aLW )QC
8
Vu Thanh Huong, UEB – VNU, Hanoi
CuuDuongThanCong.com
/>
Production Possibilities (cont.)
Home wine
production
QW (gallons)
L/aLW
PPF
Absolute value of
slope equals OCC in
terms of wine
L/aLC
Home
cheese
production
QC (pounds)
Production Possibilities (cont.)
aLCQC + aLWQW = L
QC = L/aLC when QW = 0
QW = L/aLW when QC = 0
QW = L/aLW – (aLC /aLW )QC: the equation for the PPF, with a slope equal
to – (aLC /aLW )
When the economy uses all of its resources, the opportunity cost of
cheese production is the quantity of wine that is given up (reduced) as
QC increases: (aLC /aLW )
When the economy uses all of its resources, the opportunity cost is
equal to the absolute value of the slope of the PPF, and it is constant
when the PPF is a straight line.
Copyright © 2006 Pearson Addison-Wesley.
All rights reserved.
326
Production Possibilities (cont.)
Copyright © 2006 Pearson Addison-Wesley.
All rights reserved.
327
9
Vu Thanh Huong, UEB – VNU, Hanoi
CuuDuongThanCong.com
/>
When there is only one factor of
production, PPF is simply an straight line.
Constant OC
No scale economics
Home wine
production
QW (gallons)
A
.
Increasing OC PPF
.
B
Home
cheese
production
QC (pounds)
Production Possibilities (cont.)
In general, the amount of the domestic
economy’s production is defined by
aLCQC + aLWQW ≤ L
This describes what an economy can
produce
To determine what the economy does
produce, we must determine the prices of
goods.
Copyright © 2006 Pearson Addison-Wesley.
All rights reserved.
329
A numerical example
Cheese
Wine
Home
aLC = 1hour/kg
aLW = 2hours/l
Foreign
aLC* = 6 hours/kg
aLW* = 3 hours/kg
Develop PPF of Home and Foreign.
Sketch PPF of each nation
- What is its opportunity cost of producing wine in
Chinese? what is its opportunity cost of producing
cheese in Chinese?
- Which country has an absolute advantage in wine?
Cheese?
- Which country has a comparative advantage in cheese
production?
-
10
Vu Thanh Huong, UEB – VNU, Hanoi
CuuDuongThanCong.com
/>
PRODUCTION, PRICE AND WAGES
Hourly Wages
PC : the price of cheese
PW: the price of wine.
Because of competition:
◦ Hourly wages of workers = market value of products they can
produce in one hour
◦ Market value of products produced in one hour = P/aL
◦ hourly wages of cheese makers are equal to the market value of
the cheese produced in an hour: Pc /aLC
◦ hourly wages of wine makers are equal to the market value of
the wine produced in an hour: PW /aLW
Because workers like high wages, they will work in the
industry that pays a higher hourly wage.
332
Production and Prices (cont.)
(cont.)
If PC /aLC > PW/aLW => Which product will
be produced?
◦ workers will make only cheese.
◦ If PC /PW > aLC /aLW => Which product will be
produced?
◦ workers will only make cheese.
◦ The economy will specialize in cheese
production if the price of cheese
relative to the price of wine exceeds the
opportunity cost of producing cheese.
333
11
Vu Thanh Huong, UEB – VNU, Hanoi
CuuDuongThanCong.com
/>
QW
Home
PPF: QW = L/aLW – (aLC /aLW )QC with the slope of OC
Price line with the slope of –(PC/PW)
QC
Produciton point
Production and Prices (cont.)
If PC /aLC < PW /aLW => which product be
specialized?
◦ workers will make only wine.
If PC /PW < aLC /aLW => which product be
specialized?
◦ workers will only make wine.
If PW /PC > aLW /aLC workers will only make
wine.
The economy will specialize in wine
production if the price of wine relative
to the price of cheese exceeds the
opportunity cost of producing wine.
◦ If PC /aLC = PW /aLW workers will have no incentive to
flock to either the cheese industry or the wine
industry, thereby maintaining a positive amount of
production of both goods.
◦ PC /PW = aLC /aLW
◦ Production (and consumption) of both goods occurs
when relative price of a good equals the opportunity
cost of producing that good.
◦ Relative prices must be adjusted so that wages are
equal in the wine and cheese industries.
12
Vu Thanh Huong, UEB – VNU, Hanoi
CuuDuongThanCong.com
/>
QW
Price line with the slope of –(PC/PW)
Produciton point
PPF: QW = L/aLW – (aLC /aLW )QC
with the slope of OC
QC
Wages in autarky
In autarky, each naiton should produce both
products to serve consumers’ demand.
If the domestic country wants to consume both
wine and cheese (in the absence of international
trade),
◦ What are wages in wine and cheese industry? Which
is higher?
338
Wages in autarky (cont.)
If wage in cheese industry is higher than
that in wine industry
PC/aLC >PW/aLW
⇒PC /PW > aLC /aLW (relative price of cheese is
higher than OC of producing cheese)
The country will specialize in cheese
production.
⇒ the naiton can not satisfy customers’
demand of both goods
13
Vu Thanh Huong, UEB – VNU, Hanoi
CuuDuongThanCong.com
/>
Wages in autarky (cont.)
If wage in cheese industry is lower than
that in wine industry
PC/aLC
lower than OC of producing cheese)
The country will specialize in wine
production.
⇒ the naiton can not satisfy customers’
demand of both goods
Wages in autarky (cont.)
If wage in cheese industry is equal to that in wine industry
PC/aLC = PW/aLW
⇒ PC /PW = aLC /aLW (relative price of cheese is lower than OC of
producing cheese)
Workers will have no incentive to flock to either the cheese
industry or the wine industry, thereby maintaining a positive
amount of production of both goods.
⇒ In
autarky, if a nation wants to consume both wine and
cheese, then Relative prices must be adjusted so that
wages are equal in the wine and cheese industries.
⇒ In
other goods, Production (and consumption) of both goods
occurs when relative price of a good equals the
opportunity cost of producing that good.
QW
Price line with the slope of –(PC/PW)
PPF: QW = L/aLW – (aLC /aLW )QC
with the slope of OC
QC
14
Vu Thanh Huong, UEB – VNU, Hanoi
CuuDuongThanCong.com
/>
Note
If relative price of a good is higher
than the opportunity cost of
producing that good => a nation will
specialize in producing that good.
If relative price of a good equals the
opportunity cost of producing that
good, a nation will produce both
goods.
TRADE IN THE RICARDIAN MODEL
Assumption
Suppose that the domestic country has a
comparative advantage in cheese production:
(its opportunity cost of producing cheese is
lower
than it is in the foreign country).
aLC /aLW < a*LC /a*LW
where “*” notates foreign country variables
345
15
Vu Thanh Huong, UEB – VNU, Hanoi
CuuDuongThanCong.com
/>
PPF of two nations
QW
QW
Foreign
Home
QC
QC
Benefit from trade under
comparative advantage
Suppose the domestic country has an absolute advantage in
production of both wine and cheese
◦ aLC < a*LC and aLW < a*LW
A country can be more efficient in producing both goods,
but it will have a comparative advantage in only one
good—the good that uses resources most efficiently
compared to alternative production.
Even if a country is the most (or least) efficient producer
of all goods, it still can benefit from trade.
347
Trade in the Ricardian Model (cont.)
To see how all countries can benefit from trade,
we calculate relative prices when trade exists.
◦ Without trade, relative price of a good equals the
opportunity cost of producing that good.
To calculate relative prices with trade, we must
◦ Calculate relative supply
◦ Calculate relative demand.
◦ Then, find the intersection between these two.
16
Vu Thanh Huong, UEB – VNU, Hanoi
CuuDuongThanCong.com
/>
Relative Supply
Relative supply of cheese: the quantity of
cheese supplied by all countries relative to the
quantity of wine supplied by all countries at
each relative price of cheese, Pc /PW.
(QC + Q*C )/(QW + Q*W)
Relative Supply (cont.)
Relative price
of cheese, PC/PW
a*LC/a*LW
RS
aLC/aLW
L/aLC
L*/a*LW
Relative quantity
of cheese, QC + Q*C
QW + Q*W
Relative Supply and Relative Demand (cont.)
When PC /PW < aLC /aLW < aLC*/aLW *=> There is no
supply of cheese.
◦ Why? because Home will specialize in wine
production whenever PC /PW < aLC /aLW
◦ And we assumed that aLC /aLW < a*LC /a*LW so Foreign
won’t find it desirable to produce cheese either.
When PC /PW = aLC /aLW , Home will be
indifferent between producing wine or cheese,
but Foreign will still produce only wine.
◦ Relative supply of wine of the world will be between
0 and L/aLC/L*/a*LW
17
Vu Thanh Huong, UEB – VNU, Hanoi
CuuDuongThanCong.com
/>
Relative Supply and Relative Demand (cont.)
When a*LC /a*LW > Pc /PW > aLC /aLW ,
◦ Home specializes in cheese production because they can
earn higher wages
◦ Foreign workers will still produce only wine.
◦ Relative supply of cheese is equal to L/aLC/L*/a*LW
When a*LC /a*LW = PC / PW,
◦ Foreign will be indifferent between producing wine or
cheese
◦ Home will still produce only cheese.
There is no supply of wine if the relative price of
cheese rises above a*LC /a*LW
Relative Supply (cont.)
Relative price
of cheese, PC/PW
a*LC/a*LW
RS
aLC/aLW
L/aLC
L*/a*LW
Relative quantity
of cheese, QC + Q*C
QW + Q*W
Relative Demand
Relative demand of cheese is the quantity of
cheese demanded in all countries relative to the
quantity of wine demanded in all countries at
each relative price of cheese, PC /PW.
As the relative price of cheese rises
◦ Consumers in all countries will tend to purchase less
cheese and more wine
◦ The relative quantity of cheese demanded falls.
18
Vu Thanh Huong, UEB – VNU, Hanoi
CuuDuongThanCong.com
/>
Relative Demand (cont.)
Relative price
of cheese, PC/PW
RD
Relative quantity
of cheese, QC + Q*C
QW + Q*W
Relative Supply and Relative Demand
Where the relative demand curve and the relative supply
curve intersect gives the trade equilibrium price of cheese
Relative price relative to wine.
of cheese, PC/PW
a*LC/a*LW
RS
1
RD
aLC/aLW
L/aLC
L*/a*LW
Relative quantity
of cheese, QC + Q*C
QW + Q*W
Relative Supply and Relative Demand (cont.)
QW
QW
Foreign
Relative price
of cheese, PC/PW
Home
QC
a*LC/a*LW
QC
RS
1
RD
aLC/aLW
Trade will take place
L/aLC
L*/a*LW
Relative quantity
of cheese, QC + Q*C
QW + Q*W
357
19
Vu Thanh Huong, UEB – VNU, Hanoi
CuuDuongThanCong.com
/>
Relative Supply
and Relative Demand (cont.)
358
QW
At point 2, Foreign
completely specialize
in wine production.
Home does not
specialize
=> trade will not
take place because
Home is not willing
to participate in
trade.
QW
Foreign
Home
QC
QC
Note
Relative supply curve
Relative demand curve
Relative prices
Conditions for trade to take place:
international relative price must lie
between two internal (domestic relative
prices)
20
Vu Thanh Huong, UEB – VNU, Hanoi
CuuDuongThanCong.com
/>
GAINS FROM TRADE
Gains From Trade
Gains from trade come from
◦ specializing in production that use resources most
efficiently (means producing a good in which a
country has a comparative advantage).
◦ using the income generated from that production to
buy the goods and services that countries desire.
⇒Trade:
an indirect method of production
(converts cheese into wine or vice versa).
Gains From Trade (cont.)
Benefits for workesrs:
◦ Domestic workers earn a higher income from cheese
production because the relative price of cheese
increases with trade.
◦ Foreign workers earn a higher income from wine
production because the relative price of cheese
decreases with trade (making cheese cheaper) and
the relative price of wine increases with trade.
21
Vu Thanh Huong, UEB – VNU, Hanoi
CuuDuongThanCong.com
/>
Relative Supply and Relative Demand (cont.)
QW
QW
Foreign
Relative price
of cheese, PC/PW
Home
QC
a*LC/a*LW
Pw
QC
RS
1
RD
aLC/aLW
L/aLC
L*/a*LW
Relative quantity
of cheese, QC + Q*C
QW + Q*W
Gains From Trade (cont.)
Expansion of consumption possibilities
◦ Without trade, consumption is restricted to
what is produced.
◦ With trade, consumption in each country is
expanded because world production is
expanded when each country specializes in
producing the good in which it has a
comparative advantage.
Gains From Trade (cont.)
22
Vu Thanh Huong, UEB – VNU, Hanoi
CuuDuongThanCong.com
/>
Relative Wages
Political discussion of international trade: comparison
of wage rates in different countries (Mexico: 2$ per
hour compared with 15$ in the US).
Relative wages are the wages of the domestic country
relative to the wages in the foreign country.
Although the Ricardian model predicts that relative
prices equalize across countries after trade, it does not
predict that relative wages will do the same.
Productivity (technological) differences determine wage
differences in the Ricardian model.
◦ A country with absolute advantage in producing a good will
enjoy a higher wage in that industry after trade.
Recall from the earlier numerical example
Unit labor requirements for domestic and
foreign countries
Cheese
Wine
Domestic
aLC = 1 hour/kg
aLW = 2 hours/L
Foreign
a*LC =
a*LW = 3 hours/L
6 hours/kg
aLC /aLW = 1/2 < a*LC /a*LW = 2
Home: cheese production
Foreign: wine production
Identify relative wages of each nation?
Relative Wages (cont.)
Suppose that PC = $12/kg and PW = $12/L
After trade, domestic workers specialize in cheese
production, their hourly wages will be
(1/aLC)PC = (1/1)$12 = $12
After trade, foreign workers specialize in wine
production, their hourly wages will be
(1/a*LW)PW = (1/3)$12 = $4
The relative wage of domestic workers is
therefore
$12/$4 = 3
23
Vu Thanh Huong, UEB – VNU, Hanoi
CuuDuongThanCong.com
/>
Relative Wages (cont.)
The relative wage lies between the ratio of the
productivities in each industry.
◦ Home is 6/1 = 6 times as productive in Foreign in
cheese production,
◦ But Home is only 3/2 = 1.5 times as productive as
Foreign in wine production.
◦ Relative wage of Home is three times as high as
Foreign’s.
Relative Wages (cont.)
The relative wage of domestic
workers is $12/$4 = 3
Home has high
wages relative
to Foreign
Home cheese
workers have a
higher
productivity
Home
workers have a
cost advantage
in cheese
The cost of high wage can be
offset by high productivity
Relative Wages (cont.)
The relative wage of domestic
workers is $12/$4 = 3
Foreign
workers have a
wage that is
only 1/3 of the
Home workers
Foreign has
lower
productivity
Foreign
workers have a
cost advantage
(in wine
production)
The cost of low productivity can be
offset by low wage.
24
Vu Thanh Huong, UEB – VNU, Hanoi
CuuDuongThanCong.com
/>
Relative Wages (cont.)
These relationships imply that both
countries have a cost advantage in
production.
◦ The cost of high wages can be offset by high
productivity.
◦ The cost of low productivity can be offset by
low wages.
Do Wages Reflect Productivity?
In the Ricardian model, relative wages reflect relative
productivities of the two countries.
Is this an accurate assumption?
Some argue that low wage countries pay low wages
despite growing productivity, putting high wage
countries at a cost disadvantage.
But evidence shows that low wages are associated
with low productivity.
Do Wages Reflect Productivity? (cont.)
375
25
Vu Thanh Huong, UEB – VNU, Hanoi
CuuDuongThanCong.com
/>