Phenotypic characterization and map based cloning of a novel mutant causing abnormal leaf in arabidopsis thaliana
Bạn đang xem bản rút gọn của tài liệu. Xem và tải ngay bản đầy đủ của tài liệu tại đây (1.73 MB, 44 trang )
THAI NGUYEN UNIVERSITY
UNIVERSITY OF AGRICULTURE AND FORESTRY
LE VIET TRINH
PCHARACTERIZATION AND MAP-BASED CLONING OF A NOVEL
MUTANT CAUSING ABNORMAL LEAF IN Arabidopsis Thaliana
BACHELOR THESIS
Study Mode:
Full Time
Major:
Biotechnology
Faculty:
Biotechnology & Food Technology
Batch:
2012-2016
Thai Nguyen, 2016
THAI NGUYEN UNIVERSITY
UNIVERSITY OF AGRICULTURE AND FORESTRY
LE VIET TRINH
PHENOTYPIC CHARACTERIZATION AND MAP-BASED CLONING OF A
NOVEL MUTANT CAUSING ABNORMAL LEAF IN Arabidopsis Thaliana
BACHELOR THESIS
Study Mode:
Full Time
Major:
Biotechnology
Faculty:
Biotechnology & Food Technology
Batch:
2012-2016
Supervisors:
Professor Soon- Ki Park ............................
Doctor Bang Phuong Pham .......................
Thai Nguyen, 2016
DOCUMENTATION PAGE WITH ABSTRACT
Thai Nguyen University of Agriculture and Forestry
Major
Biotechnology
Student name
Student ID
Viet Trinh Le
Thesis title
Supervisor(s)
DTN1153150084
PHENOTYPIC CHARACTERIZATION AND MAP-BASED
CLONING OF A NOVEL MUTANT CAUSING ABNORMAL
LEAF IN ARABIDOPSIS THALIANA
Professor Soon-Ki Park
Dr. Bang Phuong Pham
Abstract:
This study was carried out to identify the mutant gene causing Leaf Rolled Inside
(LRI) phenotype of mutant line named as AP-44-1. Mutant line obviously showed curly
leaf for all rosette leaves, less leaf number compared to wild type. To identify mutant
gene, F2 mapping population was generated for map-based cloning using SSLP markers.
Based on PCR analysis, the LRI gene was predicted to locate between 32160 and 32580
markers that containing 49 candidate in the region of approximately 163kb. At2g32460
gene that was identified by sequencing and compared with previous report (An et al.,
2014) is a strong candidate causing abnormal leaf phenotype. Based on the Arabidopsis
database (TAIR; ), At2g32460 is the gene coding for a
member of the R2R3-MYB transcription factor family and was designated MYB101.
The expression and genetic complementation of At2g32460 is being carried out to
investigate the responsible of gene to abnormal leaf phenotype.
Keyword:
Arabidopsis, map-based, cloning, curly leaf, leaf-rolled inside
Number of pages: 36
Date of
submission:
2016/08/29
ACKNOWLEDGEMENT
I would like to sincerely thank my supervisor, Prof. Soon-Ki Park, for all the
guidance and support me to develop an understanding of the subject. I am also thankful to
Dr. Sung-Aeong Oh and Dr. Tien- Dung Nguyen for all advices. I also would like to
thank MSc. Thi Hoai Thuong Nguyen, MSc. Hyo-Jin Park for their technical support. I
wish to thank to graduate students Rupesh Tayade, Saima Samin and Thu Huong Nguyen,
for their help and friendship. It is a pleasure to thank those who made this thesis possible
to complete.
I would like to give a very special thanks to my supervisor committee members, Dr.
Bang Phuong Pham.
Despite the geographical distance, my family was always nearby. I am grateful for
their love and believing in me.
This thesis would not have been possible unless their support.
Lastly, I would like to thank Faculty of Biotechnology and Food Technology
members for their support through my internship.
CONTENT
LIST OF FIGURES ..................................................................................................... i
LIST OF TABLES ....................................................................................................... ii
LIST OF ABBREVIATIONS ...................................................................................... iii
PART I. INTRODUCTION ........................................................................................ 1
PART II. MATERIALS AND METHODS ................................................................. 8
1. Plant materials and growth condition .. ................................................... 8
2. Methods ................................................................................................... 9
2.1.
DNA extraction ......................................................................... 9
2.2.
Genetic analysis using SSLP markers for positional cloning of AP-
44-1 .................................................................................................... 9
2.2.1.
PCR analysis ............................................................................. 10
2.2.2.
Gel electrophoresis . .................................................................. 10
2.3.
Phenotypic characterization of a novel mutant causing abnormal
leaf ................................................................................................... 11
2.4.
DNA Purification ....................................................................... 16
PART III. RESULT AND DISCUSSION .................................................................... 18
1. Plant morphological analysis . ................................................................ 18
1.1. Morphological phenotypes of AP-44-1 mutants showing defects and
sterility ........................................................................................................ 18
1.2. Comparative analysis of growth and biological activity .............. 18
2. Fine mapping of AP-44-1 locus .............................................................. 21
PART IV. SUMMARY AND CONCLUSION ........................................................... 29
REFEFENCES.............................................................................................................. 30
Appendix 1 ................................................................................................................... 32
Appendix 2 ...... ............................................................................................................ 33
LIST OF FIGURE
Figure No.
Title
Page
Figure 1
Arabidopsis Thaliana model
2
Figure 2
Procedure of map and clone mutation
6
Figure 3
Figure 4
Arabidopsis growth room
Generation of F2 mapping population
8
14
Figure 5
Procedure of a typical map-based cloning experiment
15
Figure 6
Figure 7
Principle of PCR-based mapping using SSLP markers
Steps of PCR purification
15
17
Figure 8
Comparative analysis of the morphological phenotypes of
wild-type, and AP-44-1 plants
19
Figure 9
Plants at flower stage
20
Figure 10
Example of linkage analysis with four markers using wildtype plants in the mapping population (AP-44-1)
22
Figure 11
Example of linkage analysis with four SSLP markers to
narrow down the region of mutant gene using wild-type
plant in the mapping population (AP-44-1)
23
Figure 12
Result of PCR analysis with three sets of primer 32460
24
Figure 13
Schematic representation of SSLP markers positions used
in the genetic mapping experiment
25
Figure 14
A schematic of the positional cloning of the AP-44-1 gene
(A) and structure of candidate gene
28
i
LIST OF TABLE
Table
No.
Table 1
Table 2
Table 3
Title
Page
Primer sequences used in this study
12
Identification of chromosome containing the gene of
interest
Recombinants by PCR analysis of a large mapping
population with flanking markers
27
28
ii
LIST OF ABBREVIATIONS
ADW
Autoclaved distilled water
Col-0
Columbia
CTAB
Cetyltriethy-ammonium bromide
Ler-0
Landsberg erecta
DNA
Deoxyribonucleic acid
EDTA
Ethylenediaminetetraacetic acid
IAA
Isoamyl Alcohol
LRI
Leaf rolled inside
PCR
Polymerase Chain Reaction
SSLP
Simple Sequnce Length Polymophic
TAE
Tris-acetate-EDTA
dNTPs
Deoxynucleotide
WB
Ethanol 75%
CLF
Curling leaf
CTAB
Cetyl trimethylammonium bromide
iii
PART I. INTRODUCTION
Arabidopsis Thaliana is a small flowering plant that is widely used as a model
organism in plant biology. Arabidopsis has been used as an ideal model for studying the
plant biology and genetics. As a model organism for agricultural biotechnology,
Arabidopsis presents the opportunity to provide key insights into the way that gene
function can affect commercial crop production (Boyes et al., 2001). There is ample
reason to believe that Arabidopsis will serve as a resource base for breeders of crop plant
and as a model plant that furthers the knowledge of plant scientists (Hayashi and
Nishimura, 2006). Classified in a member of the mustard and cabbage plants, Arabidopsis
has several advantages that make it an excellent experimental model (Hartwell et al.,
2004). Not only the smallest genome makes Arabidopsis useful for genetic mapping and
sequencing, also it could be easily grown in the laboratory. In addition, its small size and
rapid life cycle, approximately 6-8 weeks, are also advantageous for research. Finally,
mutants are easily induced by treating the seeds with various chemical mutagens. The
surviving seeds are the germinated and mutant progeny are recovered for analysis
(Hopkins et al., 2004).
Over 750 natural accessions of Arabidopsis thaliana have been collected from
around the world and are available from the two major seed stock centers, ABRC
(Arabidopsis Biological Resource Center) and NASC (Nottingham Arabidopsis Stock
Centre). These accessions are quite variable in terms of form and development (e.g. leaf
shape, hairiness) and physiology (e.g. flowering time, disease resistance). Researchers
around the world are using these differences in natural accessions to uncover the complex
genetic interactions such as those underlying plant responses to environment and
evolution of morphological traits. While many collections of natural accessions may not
meet a strict definition of an ecotype, they are commonly referred to as ecotypes in the
scientific literature.
1
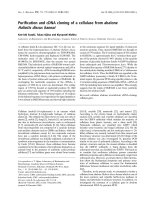
Figure 1. Arabidopsis Thaliana model (TAIR)
Proper leaf development is essential for plant growth and development, and leaf
morphogenesis is under the control of intricate networks of genetic and environmental
cues (An et al., 2014). Optimum leaf shape and size are very important for photosynthesis
process that directly effect on seeds of yield and quality also. Leaf physiological functions
are supported by several specialized cell types, such as paired guard cells in the epidermis
for gas exchange, mesophyll cells for photosynthesis, and vascular cells for internal fluid
and nutrient transport. As a fundamental component of the plant body, the continuous
vascular network provides not only mechanical strength but also the key role of transport:
the vascular tissue xylem transports water and minerals, and phloem translocates
dissolved photoassimilates efficiently. Leaf morphogenesis corresponds closely with
genetic controls and environmental factors and often used to distinguish different plant
species (Tsukaya, 2005). Over the past two decades, the isolation of leaf morphological
mutants of Arabidopsis thaliana has been commonly used to further genetic studies of
leaf development (Scarpella et al., 2010).
2
The morphology of multicellular organisms is attributable to mechanisms that
regulate the shapes, sizes, and numbers of the constituent cells. In higher animals, the
body plan is basically established at the stage of gastrulation. By contrast, in plants, the
body plan is not strictly determined and, throughout the life cycle of the plant, new organs
are added to the body via meristems located at the apices of the roots and shoots. The
fundamental unit of each vegetative shoot system can be considered to consist of a leaf,
an internode, and a lateral bud (Kim et al., 1998). Our current goal is the identification of
the various genes that control the development of the leaf, a fundamental component of
the shoot.
Map-based cloning is an iterative approach that identifies the underlying genetic
cause of a mutant phenotype. The major strength of this approach is the ability to tap into
a nearly unlimited resource of natural and induced genetic variation without prior
assumptions or knowledge of specific genes (Jander et al., 2002). Genetic mapping of a
mutation-defined gene is the first step toward isolating and cloning the corresponding
normal gene and ultimately identifying its encoded protein. Various techniques are used
to produce a genetic map of a chromosome, which indicates the positions of genes
relative to one another along the length of the chromosome. In a physical map, the
number of nucleotides between known genes is indicated (Lodish et al., 2000).
Mapping a novel mutation to a well-defined chromosomal region is an essential
step in the genetic analysis of this mutant, and is also (unless the mutant is tagged) a
prerequisite for molecular cloning of the corresponding gene. Determining the map
position of a gene (as identified by its mutant phenotype) consists in testing linkage with a
number of previously mapped markers. Once linkage with a specific marker is detected, a
refined mapping can be achieved by analysing linkage relations to more markers in that
region (Giraudat et al., 2006). By comparing a genetic map and corresponding physical
map, the actual physical position of any gene can be determined. Whereas reverse
genetics strategies seek to identify and select mutations in a known sequence, forward
genetics requires the cloning of sequences underlying a particular mutant phenotype.
3
Map-based cloning is tedious, hampering the quick identification of candidate genes.
With the unprecedented progress in the sequencing of whole genomes, and perhaps even
more with the development of saturating marker technologies, map-based cloning can
now be performed so efficiently that, at least for some plant model systems, it has become
feasible to identify some candidate genes within a few months (Janny et al., 2003).
Historically, mapping in Arabidopsis primarily utilised morphological markers such
as mutants with an easily scorable phenotype and a defined map position. Typically, the
mutant of interest is crossed to another mutant used as phenotypic marker, the resulting
F1 double heterozygote is allowed to self, and the segregation of the two phenotypes is
analysed in the F2 population. The mutation used as marker should of course not interfere
with the phenotype of the mutant to be mapped. The genetic distance is the number of
meiotic recombination events that occur between the two loci in 100 chromosomes. To
facilitate mapping, tester lines that are recessive for several morphological markers have
been constructed and can be ordered from NASC (). In other word,
to map a novel mutation that was generated in ecotype A, this mutant is crossed with a
wild-type plant of a polymorphic ecotype B, and the F1 progeny is allowed to self. The
resulting F2 population can then be used to analyse the linkage between the mutation of
interest and any DNA marker that distinguishes ecotypes A and B. As compared to
morphological markers, an additional advantage of molecular markers is that in most
cases homozygous and heterozygous individuals can be readily distinguished (Giraudat et
al., 2006).
• Map-based cloning in Arabidopsis.
In the course of map-based cloning, mutant genes are identified through linkage to a
sufficiently small region of the genetic map and subsequent DNA sequencing. This
process has become fairly straightforward for Arabidopsis mutations, owing to the
completed genome sequence and the discovery of many thousands of molecular markers.
Initially, plants with the desired phenotype are identified in populations treated with
4
ethylmethanesulfonate (EMS) or other mutagens. A typical mutation- mapping project
has four phases (Figure 2). First, the mutant line is crossed to another Arabidopsis ecotype,
preferentially one with known DNA differences. Phenotypic analysis of the F1 and F2
plants is used to determine whether the mutation is dominant or recessive. Second, approx.
50 homozygous mutant (for recessive mutations) or homozygous wild-type (for dominant
mutations) F2 plants are identified based on the phenotype. These F2 plants are genotyped
with markers on each of the five chromosomes to narrow the position of the mutation
about 20cM (1cM~250kb) resolution. Additional markers in the 2cMinterval are used to
narrow the position as much as possible, ideally to less than 5cM. Third, a larger
population of 1000 to 2000 plants is generated and genotyped with markers flankig the
5cM or smaller interval containing the mutation. The phenotypes are tested for plants that
are recombinant in this interval to infer the genotype at the site of the mutation and to
determine on which side the mutation the meiotic crossover occurred. Additional DNA
markers are used to narrow down the position of the crossover and thereby also the site of
the mutation. Fourth, once the position of the mutation has been narrowed less than 50kbp,
the DNA sequences is analyzed to determine the underlying genetic lesion. Because the
entire Arabidopsis genome sequence is known, it is often possible to pick out candidate
genes that might be mutated to cause a given phenotype. Therefore, the iterative mapping
process can be short- circuited at any stage to sequence likely candidate genes and
identify the mutation (Jander., 2006).
5
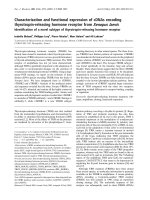
Figure 2: Procedure of Map and Clone Mutation (Jander., 2006).
Left: Phase of map-based cloning project, with possible time link leading to gene
identification in 1 year.
Right: Schematic of the five pairs of Arabidopsis chromosomes during critical
stages of a sample mapping of a recessive mutation on chromosome 1 in the Col background, crossed to wild-type Ler.
The CURLY LEAF (CLF) gene in Arabidopsis thaliana is required for stable
repression of a floral homeotic gene, AGAMOUS in leaves and stems (Kim et al., 1998).
The clf mutants had normal roots, hypocotyls, and cotyledons, but the foliage leaves and
the stems had reduced dimensions. A decrease both in the extent of cell elongation and in
the number of cells was evident in the mutant leaves, suggesting that the CLF gene might
be involved in the division and elongation of cells during leaf morphogenesis. An analysis
of the development of clf mutant leaves revealed that the period during which cell
6
division or cell elongation occurred was of normal duration, while the rates of both cell
production and cell elongation were lower than in the wild type. Two phases in the
elongation of cells were also recognized from this analysis. Thus, the CLF gene appears
to affect cell division at an earlier stage and cell elongation throughout the development
of leaf primordial (Kim et al., 1998).
Morphological variation within organisms is integrated and often modular in nature.
That is to say, the size and shape of traits tend to vary in a coordinated and structured
manner across sets of organs or parts of an organism. The genetic basis of this
morphological integration is largely unknown (Juenger et al., 2005).
In this study, we carried out to identify gene responsible for abnormal leaf
phenotype which has the same morphological phenotypes with CLF gene- leaf rolled
inside (LRI) by map-based cloning approach using a large mapping population. Results
suggested that At2g32460 coding for a member of the R2R3-MYB transcription factor
family is a strong candidate causing leaf rolled inside phenotype. Our analysis of the
leaves of leaf rolled inside mutant plants has allowed us to identify a gene that appears to
regulate both the division and the elongation of cells during leaf development. Although
this phenotypes were results of ectopically expressed genes, our work do demonstrate the
utilities of gain-of-function genetic approaches in uncovering potential regulators of plant
development and this genes may be exploited in the future for generating curly leaf traits
when desired. Development analysis of this mutant may play as new important roles apart
from rolling inside leaf, such as slow plant grow and short silique, …
7
PART II. MATERIALS AND METHODS
1. Plant materials and growth condition
The following plants were use: Arabidopsis Thaliana. ecotype Columbia (Col-0);
Landsberg erecta (Ler-0). These mutants, which were isolated on an Ler-0 back-ground,
were back-crossed twice to Col wild type to allow analysis of the phenotype in a
comparison with strains with the Ler back-ground. The Ler-0 wild type was also analyzed
in order to estimate the effects of the genetic background. All the backcrossed mutants
were comparable with wild-type Ler-0. All seeds were sown in the soil (soil mixed with
vermiculite at the ratio 1:1) and cold-treated at 4ºC in the dark for 3-4 days before
transferring to plant growth room for germination. Wild-type and AP-44-1 mutants were
grown under condition of 16 hours light, 23ºC/21ºC of day/night temperatures in a
controlled- environment growth room.
Figure 3. Arabidopsis growth room
8
2. Methods
2.1.
DNA extraction
Mature leaves, cauline leaves, flowers, and roots were harvested from flowering
plants of about 3–6 weeks of age. DNA was extracted from leaf tissue that collected from
3-week-old seedling using CTAB method following below steps:
1. Collect 0.3g of leaf tissue into 2mL eppendorf tube and adding a bead into.
2. Freeze in liquid nitrogen.
3. Homogenize the sample in liquid nitrogen using a Tissue Layer machine (QIAGEN,
)
4. Immediately, add 250µL of extraction buffer (CTAB buffer), vortex briefly and
incubate at room temperature for 15-20 minutes.
5. Add 250µL of 24:1 solution (chloroform: isoamyl alcohol), mix well.
6. Spin for 12 minutes at 12000RPM and transfer aqueous layer to fresh tube (approx.
200µL) containing 0,7 transfer volume of Iso-propanol (approx. 140µL)
7. Shaking and incubating at room temperature for 5 minutes.
8. Mix, then spin for 7 minutes at 12000RPM and discard supernatant.
9. Wash DNA pellet with 700µL 70% ethanol, centrifuge at 12000RPM for 5 minutes.
10. Pour of ethanol, remove remainder with pipette and leave to dry on clean bench for
approx. 30 minutes.
11. Dissolve pellet in 50µL ADW (autoclaved distilled water).
12. Store DNA solution at -20ºC.
A successful DNA extraction will yield a sample with long, non-degraded strands
of DNA which require further preparation according to the sequencing technology to be
used.
2.2.
Genetic analysis using SSLP markers for positional cloning of AP-44-1
To generate mapping population for the positional cloning of AP-44-1 locus, AP-441 plants in the Ler-0 background were crossed to wild-type Col-0 to obtain F1 plants and
9
self-fertilized. Genomic DNA was prepared from leaves of F2 plants according to the
modified Cetyl Trimethyl Ammonium Bromide (CTAB) method (Murray et al., 1980).
PCR-based mapping was conducted using Simple Sequence Length Polymorphic
(SSLP) markers which showed clear polymorphism between Ler-0 and Col-0.
Information of existing molecular markers were obtained from public database (TAIR,
), and new markers also designed based on the sequence
polymorphism found between Ler-0 and Col-0. The primer sequences used in the
mapping are shown in Table 1.
2.2.1. PCR analysis
Polymerase Chain Reaction (PCR) is a powerful method for amplifying particular
segments of DNA, distinct from cloning and propagation within the host cell. PCR uses
the enzyme DNA polymerase that directs the synthesis of DNA from deoxynucleotide
substrates on a single-stranded DNA template. DNA polymerase adds nucleotides to the 3’
end of a custom-designed oligonucleotide when it is annealed to a longer template DNA.
Thus, if a synthetic oligonucleotide is annealed to a single-stranded template that contains
a region complementary to the oligonucleotide, DNA polymerase can use the
oligonucleotide as a primer and elongate its 3’ end to generate an extended region of
double stranded DNA (Aryal., 2015).
In our work, PCR reactions were conducted in 15µL in 40 cycles. A 1µL volume of
DNA samples with mixture consisting of 1.5µL e-taq buffer, 0.3µL dNTPs, 0.075µL etaq polymerase, 0.375µL gene-specific primers and 11.375 autoclaved distilled water was
used for PCR amplification at 95ºC for 2 minutes and 40 cycles at 94ºC for 30 seconds,
55ºC for 15 seconds and 72ºC for 15 seconds. The final extension was carried out at 72ºC
for 5 minutes.
2.2.2. Gel electrophoresis
Agarose gel electrophoresis is a method to separate DNA molecules by size. This is
achieved by moving negatively charged nucleic acid molecules through an agarose matrix
10
with an electric field (electrophoresis). Shorter molecules move faster and migrate farther
than longer ones. The amplified products were loaded into 4% agarose gel with 100 bp
ladder marker in 1X TAE buffer (Elpis Bio) and stained with ethidium bromide.
2.3.
Phenotypic characterization of a novel mutant causing abnormal leaf
Wild-type and AP-44-1 mutants grown in a controlled- environment growth room
after 3 weeks were observed leaf phenotype. To have a clear view of the rosette leaves,
the inflorescence stems were removed prior to photographing.
The second platform consists of an extensive set of measurements from plants
grown on soil for a period of ∼2 months. When combined with parallel processes for
metabolic and gene expression profiling, these platforms constitute a core technology in
the high throughput determination of gene function.
We present here analyses of the development of wild-type plants and selected
mutants to illustrate a framework methodology that can be used to identify and interpret
phenotypic differences in plants resulting from genetic variation.
11
Table 1: Primer sequences used in this study
No.
1
2
3
4
5
6
7
8
9
10
11
12
Name
nga63-for
nga63-rev
nga280-for
nga280-rev
21930-for
21930-rev
nga168-for
nga168-rev
nga162-for
nga162-rev
nga6-for
nga6-rev
nga8-for
nga8-rev
nga1107-for
nga1107-rev
26400-for
26400-rev
26870-for
26870-rev
27130-for
27130-rev
29130-for
29130-rev
Gene
name
At1g09910
At1g55840
At2g21930
At2g39010
At3g13950
At3g62220
At4g08840
At4g38770
At2g26400
At2g26870
At2g27130
At2g29130
Sequence (5’-3’)
Purpose
ACCCAAGTGATCGCCACC
Mapping
AACCAAGGCACAGAAGCG
(SSLP)
GGCTCCATAAAAAGTGCACC
Mapping
CTGATCTCACGGACAATAGTGC
(SSLP)
AGCTCACTCCAAATCGAGAAG
Mapping
TATGGACATAGTCTCGGCATG
(SSLP)
GAGGACATGTATAGGAGCCTCG
TCGTCTACTGCACTGCCG
CTCTGTCACTCTTTTCCTCTGG
CATGCAATTTGCATCTGAGG
ATGGAGAAGCTTACACTGATC
TGGATTTCTTCCTCTCTTCAC
Mapping
(SSLP)
Mapping
(SSLP)
Mapping
(SSLP)
TGGCTTTCGTTTATAAACATCC
Mapping
GAGGGCAAATCTTTATTTCGG
(SSLP)
CGACGAATCGACAGAATTAGG
Mapping
GCGAAAAAACAAAAAAATCCA
(SSLP)
TGGACACACCTCACATAAGTC
Mapping
TCTCGTGGTTACTCCTACATG
(SSLP)
TACGTCATATAATCTTGTTGTCG
Mapping
GTTGTTGTAAGATGAGCATTTGC
(SSLP)
GTAATTTGGACTGTCCGATTCG
Mapping
TATTTCCTATTTCAAGACTTTGC
(SSLP)
CTTATGAAATTTTACTGTTATGGAC
ATCTTACTTTGGTATCGCCAC
Mapping
(SSLP)
12
Table 1: Primer sequences used in this study (continued)
No.
13
14
15
16
17
18
19
20
21
22
23
Name
30220-for
30220-rev
32830-for
32830-rev
33793-for2
33793-rev2
30680-for
30680-rev
31370-for
31370-rev
32160-for
32160-rev
32580-for
32580-rev
32360-for2
32360-rev2
32460-for1
32460-rev1
32460-for2
32460-rev2
32460-for3
32460-rev3
Gene
name
At2g30220
At2g32830
At2g33793
At2g30680
At2g31370
At2g32160
At2g32580
At2g32360
At2g32460
At2g32460
At2g32460
Sequences (5’-3’)
GGAGCACTTAGAAGATCTTCAC
AAATGTATACGCCATAATGCCAAG
GTATGTGTGAGGCCAAGAACC
GTTTAAGATGAAACCAAAACCAAGC
Purpose
Mapping
(SSLP)
Mapping
(SSLP)
GGATTAGTCTGGATCTTGTATC
Mapping
CTGAGTGCTTCAGAGCTGATG
(SSLP)
ACAGCGAAGACCTGCCTGCCG
Mapping
CGCAAGTCCGAGACGATATAATG
(SSLP)
TGCCCTGTATGATTACTAATCAG
Mapping
GTGATGAATTGATTGAGTCTGTC
(SSLP)
CGTACTCTACAAACCCCCGGTC
Mapping
TCCTCATTGTCCAGAAGACAGG
(SSLP)
CCAAAACAACAAAGGATTAGTGG
GATCTAACAATACACCTTGCC
Mapping
(SSLP)
AATCTATCCTCAAGTTTACCCAAC
Mapping
TGACTTTCGTAATGTGGTAGGCGC
(SSLP)
TCCTCTCCTTGATCGGAGGGTCGC
Sequencing
GATCTTGGTTTTGGAACTGAAAGG
and RT-PCR
CCTGGAAGAACAGACAATGAGATC
Sequencing
CACATAGGTCACTGGAGGAAACCC
and RT-PCR
GACCCATTCGTTCAGTTCTAGTCC
Sequencing
CAGTTCATAGCACATCCCAAG
and RT-PCR
13
Use 689 plants (or 1378 chromosomes) of AP-44-1
Figure 4.Generation F2 mapping population.
14
Figure 5.Procedure of a typical map-based cloning experiment.
Figure 6.Principle of PCR-based mapping using SSLP markers.
15
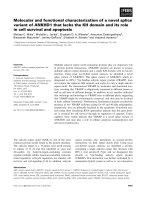
2.4.
DNA purification
After narrowed down to an approximately 163kb region containing 49 predicted
genes (Appendix 2), we choose At2g32460 as a putative gene cause leaf rolled inside
phenotype of AP-44-1 mutant because a former research paper reported that enhanced
expression of At2g32460 underlines the leaf curling up phenotypes [1]. DNA purification
is considered to be of vital importance for most methods involved in molecular biology,
genomics, biotechnology and clinical research since it can help determine the success or
failure of all your immediate and downstream experimentations. In our case, to find out
the points mutation of At2g32460 gene by sequencing methods, DNA was purified from
PCR product using HiGene™Gel & PCR Purification System (BIOFACT) following
below steps:
1.
On the electrophoresis gel, the location which contain band of DNA was
cut to collect DNA and then put into 2 ml of tube.
2.
Add UB solution with volume is three times as much as gel volume.
3.
The tube is incubated in 60ºC for 10 min and after that add isopropanol (it
is the same with the volume of gel).
4.
Transfer 800µL solution into tube containing filter membrane and
centrifuge for 1min at 7000 rpm.
5.
Discard the solution, and then add 750µL WB (ethanol 75%).
6.
Centrifuge for 1min at 13,000 rpm and then remove the supernatant, add
750µL WB (ethanol 75%).
7.
Spin for 3 min at 13,000 rpm.
8.
Transfer tube containing filter membrane into 1.5 mL tube.
9.
Add 35µL EB solution and incubate at room temperature 1 min.
10. Centrifuge for 1 min at 13,000 rpm.
11. Store DNA elution at -20ºC.
DNA fragments purified with the HiGene™Gel& PCR Purification System are
ready for direct use in all applications, including sequencing and PCR. We sent to DNA
16
sequencing company homozygous and wild-type samples with 3 set of primer 32460
(For1-Rev1), 32460 (For2-Rev2), 32460 (For3-Rev3). The result was received after 2 day
of work.
Figure 7. Procedure of DNA purification
17