Tài liệu Chapter 3: Report Painter/Report Writer doc
Bạn đang xem bản rút gọn của tài liệu. Xem và tải ngay bản đầy đủ của tài liệu tại đây (554.02 KB, 38 trang )
Report Development Tools 3–1
Chapter 3: Report Painter/Report Writer
Contents
Learning the Basics of Report Painter/Report Writer.........................................3–2
Creating a Report with Report Painter .................................................................3–7
Understanding the Report List............................................................................3–26
Getting the Most from Report Painter/Report Writer: Tips & Tricks...............3–26
Review ...................................................................................................................3–38
Where to Learn More............................................................................................3–38
3
In this chapter you will:
Understand the difference
between Report Painter
and Report Writer
Learn how to create a
simple report with Report
Painter
Explore helpful hints and
information on the
Report/Report Interface,
formula variables, and
creating your own
evaluation structures
Chapter 3: Report Painter/Report Writer
Learning the Basics of Report Painter/Report Writer
Reporting Made Easy
3–2
Learning the Basics of Report Painter/Report Writer
In this chapter you will learn about Report Painter/Report Writer, tools that let you report
on data from multiple applications. Before jumping into how you can use Report
Painter/Report Writer to create reports, it is important to understand its features and basic
organization.
Overview
Report Painter/Report Writer can be used to easily create currency- or quantity-type reports
in the R/3 System. Examples of such reports include, financial statements, sales reports, and
inventory reports.
Earlier releases of the R/3 System were delivered only with Report Writer. Later, the user
interface of Report Writer was enhanced and offered to users as Report Painter. As shown in
the graphic below, Report Painter adds an easy-to-use graphical interface to the core
functionality of Report Writer.
Graphical
Interface
Graphical
Interface
Report Writer
+
Report Painter
=
What Is Report Painter?
With Report Painter you can report on data from multiple applications. It uses a graphical
report structure which forms the basis for report definition. When defining a report, you
work with a structure that corresponds to the final structure of the report. With Report
Painter’s intuitive WYSIWYG approach to report design, you define a report on a form that
displays the rows and columns as they will appear in the report output.
What Is Report Writer?
Just like Report Painter, Report Writer lets you report on data from multiple applications.
Using elements such as sets, variables, formulas, cells, and key figures, you can create
complex reports that meet specific reporting requirements.
Note: Since Report Painter provides the core functionality of Report Writer, most users
may not need to use Report Writer. A general understanding of Report Writer should
suffice for most users.
Chapter 3: Report Painter/Report Writer
Learning the Basics of Report Painter/Report Writer
Report Development Tools
3–3
How Is Report Painter Different From Report Writer?
Although there are a few differences between the two tools, both Report Painter and Report
Writer share the same execution engine. Since both tools work with the same reporting
control tables, you can use either tool to create reports on the configured tables.
Here are some of the important differences between Report Painter and Report Writer:
Report Painter Report Writer
Page breaks occur only between row
elements
Page breaks occur at arbitrary summation-
levels within a report.
Allows use of single lines (--) only for over-
and underscoring
Allows use of any characters (for example,
double-line ==) for over- and under-scoring
Before 4.0A, authorization groups for
report handling are not supported. Refer to
OSS note 69090 for a workaround. Starting
in Release 4.0A it is possible to maintain the
header of a Report Painter report via the
menu path: Environment
→
report header.
Allows set up of authorization groups for
report handling
Key figures can only be used in columns Key figures can also be used in rows and
data selection
Row-detail is restricted to three levels: No
explosion, single values, and all levels
In addition to the levels supported by
Report Painter, you can also select
intermediate levels
Copying reports between Report Painter and Report Writer
If you want to build a report using features that are only available in Report Writer, then
the report must be created in Report Writer—not Report Painter.
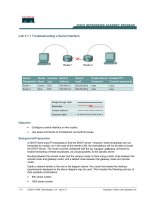
As shown in the graphic on the following page, Report Painter reports can only be
changed or displayed using Report Painter.
Later, if you want to change a Report Painter report using Report Writer, you must first
copy it into a Report Writer report (with a different name) and then modify the copied
report. When the report is copied, the necessary sets are automatically generated; you
can define a 5-character prefix for the set name.
Note: In Release 4.5 you no longer have to define a prefix since the system automatically
attaches one to your “automatically created sets”. The system-created set is deleted when
you delete the report.
Reports written in Report Writer cannot be edited using Report Painter.
Chapter 3: Report Painter/Report Writer
Learning the Basics of Report Painter/Report Writer
Reporting Made Easy
3–4
Report
Painter
Report
Writer
Copy to a
Report Writer
Report
Display
or
Change
Report
Display
or
Change
Report
Data tables
supported
Both Report Painter and Report Writer can be used to report on the following tables and
tables types:
< Evaluation structures set up in the Logistics Information System (LIS). These
structures normally begin with an “S” or “ZF.” Several different tables and views
within the R/3 System can be added as evaluation structures.
Note: You cannot add cluster tables, such as BSEG.
< CCSS is used for Cost Center Accounting (CO-CCA), Internal Orders (CO-OPA),
Activity Based Costing (CO-ABC) and for cost element reports in Project Systems (PS).
< GLFUNCT is used for functional area reporting in cost-of-sales accounting.
< GLPCT and GLPCOP are used for Profit Center Accounting (CO-PCA/EC-PCA).
< FILC is used for Legal Consolidations (FI-LC).
< COFIT is used for the Controlling Reconciliation Ledger (CO-CEL).
< ZZ tables are created for the Special Purpose Ledger (FI-SL).
< FIMC is used for consolidations in the Enterprise Controlling module (EC-LC).
< GLT0 is used for Financial Accounting (General Ledger) reports by account, company,
and business area (FI-GL).
< KKBC, KKBE, and KKBU are used for the Controlling Product Costing module (CO-
Costing).
New in Release 4.0A: RWCOOM is used for CO-CCA, CO-OPA and CO-ABC. RWCOOM
is used for special standard reports like internal order budget reports, cost center budget
reports and cost component reports.
Note: RPPS was used for Project Systems (PS). However, it is obsolete and is no longer
supported in Release 4.0. In Release 3.x there were only two special reports (6P70 and
6P71) using RPPS. These reports cannot be called directly, but via ABAP reports
RKOPLAN0 and RKOPLAN1.
Chapter 3: Report Painter/Report Writer
Learning the Basics of Report Painter/Report Writer
Report Development Tools
3–5
How Is Report Painter/Report Writer Organized?
Report Painter/Report Writer has four main components:
< Sets: Logical groupings of characteristic values. For example, a cash line on a balance
sheet is made up of a set of cash accounts, or an energy product line on an inventory
report is made up of a set of the energy products. Variables can also be created which
are placeholders for sets, or values within sets.
< Libraries: Control what characteristics and key figures from a table are available for
reporting.
< Reports: Hold a definition of the rows, columns, and overall data selection. They also
include the header and footer texts and layout settings.
< Report Groups: Can contain one or more reports. The report group is what you
execute—not the actual report. A report group is generated to create a set of ABAP
programs that produce the reports.
Related Terminology
The following is a list of key terms you need to understand when working with Report
Painter/Report Writer tools.
Report Definition
A report definition has three main components:
< Rows: The rows of a Report Painter report contain characteristics that determine how
the rows will appear in the report. In the first report example on page 3–8, materials and
material types drive the outcome of the rows, therefore only these characteristics are
included in the rows of the report.
< Columns: The columns of a Report Painter report must have key figures. If needed,
columns may also contain characteristics. In the second report example on page 3–18,
plants are shown across the page, which means the plant characteristic is included in the
columns as well as a key figure for net value of a billing document.
< General Data Selection: The general data selection area contains the additional
characteristics that should control the data included in the report. In the second example
on page 3–18, you may want to limit the selected data by material group or industry.
Since these fields do not affect the outcome of the rows or columns, they are included in
the general data selection as additional selection criteria. Any required fields that are not
in the rows or columns are also included in the general data selection. In the first
example on page 3–8, ledger, version, and record-type are all required but not included
in the rows or columns. Therefore, these fields must be included in the general data
selection in order for the report to run. Each table has certain required fields. To check
your report for missing fields, choose the Check icon in Report maintenance.
Key Figures
Key figures are the currency or quantity buckets for a report. Some examples of key figures
include the local currency amount in profit center accounting, the costs bucket in cost center
Chapter 3: Report Painter/Report Writer
Learning the Basics of Report Painter/Report Writer
Reporting Made Easy
3–6
accounting, the net value of a billing line item, and the quantity of materials sold in a sales
order.
Characteristics
Characteristics are the fields—other than currency or quantity—needed to build the report.
For example, company code, plant, sales organization, G/L account, cost center, or period.
In a balance sheet report, G/L accounts probably appear in the rows of your report. In a
customer sales report, customers are likely to appear in the rows of the report.
How to Access Report Painter/Report Writer?
To access Report Painter, choose the following menu path from the SAP main menu:
Information systems
→
Ad hoc reports
→
Report painter
Report Writer functions can be accessed from within Report Painter. To access Report
Writer, choose the following menu path from the SAP main menu:
Information systems
→
Ad hoc reports
→
Report painter
→
Report Writer.
How Does Report Painter Differ from Other Reporting Tools?
< With the exception of row titles which have text fields, Report Painter/Report Writer
reports display numerical fields only (for example, dollar and quantity fields). This is
not a requirement for ABAP Query and typical line item reporting tools, which can
display arbitrary text columns.
< The printed Report Painter/Report Writer reports appear much the same way on paper
as they do on screen. In contrast, the Drilldown reporting tool produces a different
output format. Drilldown is an online analytical tool which can be used to drilldown to
different levels of detail but is infrequently used for printing. For more information, see
chapter 4.
< Report Painter/Report Writer reports are hierarchical and take advantage of configured
hierarchies (for example, with cost center hierarchies). You can also execute Report
Painter/Report Writer reports from each level within a hierarchy.
< Report Painter/Report Writer reports can handle multiple currency/quantity units
within a single column.
< Report Painter/Report Writer is well-suited to handle reports which require mass
production. For example, Report Painter/Report Writer is a particularly effective tool for
creating month-end reports.
What Are the Prerequisites?
< Table: You must know the table you need for the report as well as the data within the
table. Every table has characteristics and key figures, or evaluation structures that are
required for a report. Each table’s characteristics and key figures are different. For
example, in the Special Ledger the key figures are based on currency: transaction, local,
and group. In Cost Center Accounting structure CCSS, the key figures are based on
currency and the type of cost: cost, quantity, statistical quantity, and variances.
Chapter 3: Report Painter/Report Writer
Creating a Report with Report Painter
Report Development Tools
3–7
< Sets: You will need to build sets that include the values for the characteristics that are
needed for your report. Although the values can be directly entered into the report, it is
recommended that you use sets. Sets can be used in multiple reports because when
values change, only the sets are changed and not each individual report. As an example,
cost center hierarchies (groups) are sets and can be used directly (as with profit center
groups). The same holds true for cost elements, activity types, statistical key figures,
orders, and business processes (you do not have to create technical sets for these
characteristics in order to use Report Painter).
< Library: You must create a library for the table or evaluation structure. Most tables
supported by Report Painter/Report Writer have one or more libraries you can use.
When creating evaluation structures in the Logistics Information System, the system
creates a library beginning with a 2. Since the Special Ledger is not delivered with the
libraries, you will need to create a library on each new special ledger table.
Creating a Report with Report Painter
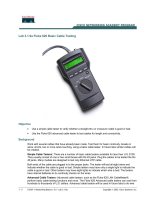
The main steps in creating a report are shown in the graphic below:
Add your report to a report group
Add your report to a report group
Trained Employee Available?
Create your report
Create your report
Find or create variables for the fields in your report
Find or create variables for the fields in your report
Find or create required sets for your reports
Find or create required sets for your reports
Find or create a library for the table
Find or create a library for the table
Determine the table you need for your report
Determine the table you need for your report
1
2
3
4
5
6
In this section you learn how to create the following two reports with Report Painter:
< Profit Center Accounting report
Chapter 3: Report Painter/Report Writer
Creating a Report with Report Painter
Reporting Made Easy
3–8
< Billing report
For these sample reports, you should focus on the tables that correspond to the SAP
application areas you are working with. For example, if your expertise is PCA (Profit Center
Accounting), you should work with table GLPCT. Take a few minutes to familiarize
yourself with the scenario and the desired report. For more information, see page 3-4.
The examples shown in this section were created in Release 4.0B.
Example 1: Gross Profit Margin Report
Bungee Corporation wants to use Report Painter to create a Gross Margin Report. This
Profit Center Accounting report will use data table GLPCT. The desired PCA report
displays the gross margin for each profit center. The following general data selection
values were used: Fields version (0), Record type (0), Period (1-12), Company code
(3000), Profit center (3010–N999), and Ledger (8A).
Below is an illustration of the completed gross margin report.
The rows in this report list the G/L accounts and the columns contain the current as well as
prior years (with the company code currency key figure).
Chapter 3: Report Painter/Report Writer
Creating a Report with Report Painter
Report Development Tools
3–9
Guided Tour
Step 1: Determine the Table
Before you can start creating the report, you must select the table you need to use. In this example, we use
table GLPCT in Profit Center Accounting.
Step 2: Find the Library
Select the library you want to use for the table chosen in step 1. If necessary, choose the following menu
path to create a library: Information systems
→
Ad hoc reports
→
Report painter
→
Report Writer
→
Libraries
→
Create.
As shown in step 5, we use an existing library 8A2 for this report.
Step 3: Create Sets
Create required sets for your report. To create a set, choose: Information systems → Ad hoc reports → Report
painter → Report Writer → Set → Create.
Note that this step is not necessary for this sample report.
Step 4: Create Variables
Create any variables for the fields that must be entered before the report is executed. To create a variable,
choose: Information systems
→
Ad hoc reports
→
Report painter
→
Report Writer
→
Variable
→
Create.
Note that this step is not necessary for the sample report.
Step 5: Create Report
1. From the SAP main menu, choose
Information Systems
→
Ad hoc reports
→
Report painter
→
Report
→
Create.
2. In Library, enter the name of the
library to be used for the report (for
this example, we use 8A2).
3. In the Report field, enter a name for
your report and a short text
description.
4. Choose Continue.
2
3
4
Chapter 3: Report Painter/Report Writer
Creating a Report with Report Painter
Reporting Made Easy
3–10
To help you better understand how to create a report in Report Painter, this step has been divided into the
following substeps:
< Define the rows
< Define the columns
< Define the general data selection
Define Rows
1. When defining the rows of a report,
notice the Lead column at the top of
the rows. Report Painter refers to the
rows of a report as the Lead column.
You can type over this with your
own description.
2. To start defining the rows, double-
click on Row 1.
3. In Row 1: Choose Characteristics, select
the desired characteristics. For this
example, select Account number from
the list of available characteristics.
4. Choose Enter to continue.
5. Enter the account number(s) you
want to include in the row
definition. Either enter to/from
values or a group (set). See
Tips&Tricks on page 3-12 for more
information.
6. Choose Enter.
2
1
4
3
5
6
Chapter 3: Report Painter/Report Writer
Creating a Report with Report Painter
Report Development Tools
3–11
7. Enter a name for the row you are
defining. In this example, Row 1 is
defined as Revenue.
8. Choose Enter.
You have now defined the first row.
Repeat steps 1-8 shown above to add the
second row titled Cost of Goods Sold (not
shown here). For Row 2, use accounts
400000-490000.
9. In the Report Painter: Create Report
screen, double-click on Row 3.
10. Select Formula as the row element
type.
11. Choose Enter.
12. Enter the formula for Row 3. You can
either type it in or use your mouse
and the formula components
buttons. If you type the formula, do
not forget the spaces. In this
example, Y001 and Y002 represent
Revenue and Cost of Goods Sold
respectively.
13. Choose Enter.
14. In the popup screen (not shown
here), enter the text Gross
Margin.
You have now defined the three rows
(Revenue, Cost of Goods Sold, and Gross
Margin) you will need for this report.
8
7
13
12
10
11
Chapter 3: Report Painter/Report Writer
Creating a Report with Report Painter
Reporting Made Easy
3–12
Creating a set
Instead of separately defining each row, you can also create a set to save you time. The
set you use in a report row is referred to as a row block and may consist of one or more
physical rows. If you create a basic set containing account numbers as a row block, then
the system automatically creates a physical row for each account number in the set.
In this example, you could have skipped steps 5 through 14 simply by creating a basic
set called “Gross Margin” in step 3. This set (row block) would include the account
numbers for Revenue (800000) and Cost of Goods Sold (400000-490000). The system
automatically generates a physical row for Revenue and Cost of Goods Sold without
requiring you to define it from scratch. To do this, you must set the “explode option” to
explode or single values. After that, one will automatically get one line for each account,
not 2 lines for each single value (800000) and the interval. You will only get 2 lines if the
standard layout parameter “form print” is set—but this is not the default setting.
For more information on how to use sets, refer to the online documentation in the R/3
Library.
Define Columns
1. Double-click on the first column,
Column 1.
2. In the Select Element Type window,
select Key Figure with characteristics.
3. Choose Enter.
4. In the Key figures window, select
Amount in company code currency.
5. Choose Enter.
2
3
1
4
5
Chapter 3: Report Painter/Report Writer
Creating a Report with Report Painter
Report Development Tools
3–13
6. In the Choose Characteristics window,
select Fiscal Year as the desired
characteristic for column 1.
7. Choose Enter.
If you want to be prompted for the fiscal
year at the time of running the report,
you must make this a variable instead of
a value.
8. Place your cursor in the From value
field and choose Variable on/off.
9. Select from the list of available
variables or enter a variable for
Current year.
10. Choose Enter.
11. Enter the texts for the column
header.
12. Choose Enter.
Column 1 has now been defined for your
report.
Since the following steps are similar to those shown above, they have not been pictured in this guided tour.
13. Define column 2 (Prior Year): You can define column 2 either by repeating steps 1 through 12, or by
copying columns. For column 2, choose Prior year as the desired variable.
14. Define column 3 (Variance): Enter a formula that calculates the difference between column 1 (current
year) and column 2 (prior year). The column text should read Variance. Adding a column or formula is
similar to adding a row formula. Follow steps 10 through 13 shown in the section Define Rows.
You have now defined the three columns (Current Year, Prior Year, and Variance) needed for your report.
6
7
8
9
10
11
12
Chapter 3: Report Painter/Report Writer
Creating a Report with Report Painter
Reporting Made Easy
3–14
General Data Selection
Now that you have defined the rows and
columns, you are ready to enter the
general data selection.
1. From the menu on the Report Painter:
Create Report screen, choose Edit
→
General data selection
→
Display/Change.
2. Select the fields to add to the general
data selection.
3. Choose Enter.
4. Enter the values for each field. The
standard ledger for PCA is 8A.The
U.S. company code in IDES is 3000.
5. In the Profit center field, we want to
include a set variable so that we can
enter the profit centers or profit
center group when executing the
report. Place your cursor in the group
field for the profit center.
6. Choose Variable on/off.
7. Enter the variable name 8A-PC-1 in
the group field.
8. This is a year-to-date report, so all 12
periods are in the range. The
standard Version in PCA is 000 and
the Record type for actual dollars is 0.
9. Choose Enter.
10. Choose Edit
→
General data selection
→
Variation (not shown here)
11. To create multiple lists for the
characteristics, select Explode.
12. Choose Enter.
3
2
4
5
6
12
11
7
9
4
8
Chapter 3: Report Painter/Report Writer
Creating a Report with Report Painter
Report Development Tools
3–15
Your report is now ready.
13. Choose Save to save the report.
14. To go to the display mode of the
report, choose Report
→
Display.
15. Make sure the correct Library and
Report names have been selected.
16. Choose Continue.
17. Review the report display.
18. To execute the report, choose Report
→
Execute.
You need to display the report before
you execute it so that you can later
change the report layout directly from
the report list.
16
15
17
18
13
14