Tài liệu Chapter 4: Drilldown Reporting ppt
Bạn đang xem bản rút gọn của tài liệu. Xem và tải ngay bản đầy đủ của tài liệu tại đây (754.32 KB, 34 trang )
Report Development Tools
4–1
Chapter 4: Drilldown Reporting
Contents
Learning the Basics of Drilldown Reporting .......................................................4–2
Creating a Drilldown Report: Profitability Analysis............................................4–7
Getting the Most from Drilldown Reporting: Tips & Tricks..............................4–23
Review ...................................................................................................................4–33
Where to Learn More............................................................................................4–34
4
In this chapter you will learn:
What makes Drilldown
reporting an effective
reporting tool
How the components of
Drilldown reporting are
organized
How Drilldown differs
from other reporting tools
How to create and execute
a form (drilldown) report
Chapter 4: Drilldown Reporting
Learning the Basics of Drilldown Reporting
Reporting Made Easy
4–2
Learning the Basics of Drilldown Reporting
Drilldown reporting contains interactive functionality that lets you analyze the data
collected in your application or information systems. Compared with other reporting tools,
Drilldown offers greater flexibility in mining data. You can slice and dice data without the
restrictions of formatted and fixed reports.
Before jumping into how you can use Drilldown reporting to create and use reports, it is
important to understand its features and basic organization.
Note: Many users may not know of a tool called Drilldown reporting, but are instead
familiar with other tools such as the Executive Information System (EIS) and Profitability
Analysis (CO-PA) reporting. Drilldown reporting is the engine for both EIS and CO-PA
reporting. However, as previously mentioned, there are times when report development
tools are known by different names within certain applications. This is the case with
Drilldown reporting. In this chapter we will discuss the applications in which Drilldown
reporting is used, but for additional references to Drilldown reporting, see chapter 1 of
this guidebook.
What Is Drilldown Reporting?
With Drilldown reporting you analyze data based on any of the characteristics or objects
that describe the accessible data. Drilldown reporting allows you to:
< Choose key figures or performance measures to categorize your data (we will further
describe both key figures and characteristics and their use)
< Display a number of objects for a given key figure
< Display a number of key figures for a given object
< Carry out any number of variance analyses (for example, plan/actual comparisons,
fiscal year comparisons, and comparisons of different objects)
Drilldown Functions
Drilldown reporting provides you with easy-to-use functions for navigating through your
data. Using drilldown functions, you can:
< Jump to the next level of detail or to the next report object at the same level
< Hide individual levels of detail
< Switch between the detail and drilldown lists
< Process lists interactively (sorting, conditions, ranking lists, and more)
< Deploy SAP Graphics, SAPmail, and the Excel List Viewer.
Once you have built the initial view of the data, you have dynamic control over how the
data is viewed. For example, you can sort selected characteristics in a different order
without having to rerun the query. By manipulating “hotspots” in a report, you can also
Chapter 4: Drilldown Reporting
Learning the Basics of Drilldown Reporting
Report Development Tools
4–3
change the level of detail. Hotspots influence the appearance of the cursor and the effect of
clicking.
To make a distinction between “Drilldown” (the tool) and “drilldown” (the function), the
Drilldown reporting tool is optimized for online viewing of report data; you do not have to
constantly scroll up or down a long list to find the appropriate subset of desired
information. Drilldown allows you to stay on the same page while it interactively presents
data.
Where Is Drilldown Reporting Used?
Drilldown reporting is primarily used to access the following selected data structures:
< Controlling and Profitability Analysis (CO-PA)
< Executive Information System (EIS)
< General Ledger (Financial versions)
< Project Systems
With Release 4.0 Drilldown reporting has been expanded to include:
< Consolidations
< Accounts Payable
< Accounts Receivables
< Special Ledger
< Real Estate
< Funds Management
< Treasury Management
< Investment Management
< Profit Center Accounting
Drilldown reporting is not possible for data structures that are outside these areas unless
you are able to pull the data into one of these applications first.
Types of Drilldown Reports
Drilldown reporting is designed to make it easy to define simple adhoc reports while still
providing all the functionality required for more complex ones.
Consequently, you can define two different types of reports:
< Basic report
< Form report
Basic Report
This report is often useful when you quickly want to search for a specific effect in your data
without exactly knowing what you are looking for, or where you are likely to find it. The
structure of the basic report is simple and of a more general nature than a form report.
Chapter 4: Drilldown Reporting
Learning the Basics of Drilldown Reporting
Reporting Made Easy
4–4
Form Report
In form reports the structure of the list is more complex but also allows you greater
flexibility. Form reports are often used for official company reports, and are particularly
suitable for printing reports.
Do not confuse the term form as used in Drilldown reporting (or Report Painter) with
any other use of the word “form” in the R/3 System. Note that the term “form,” as used
here bears no relationship to the same term that appears in the area of printing forms.
For more information on printing forms, see the Printout Design Made Easy guidebook
(now called SAPscript Made Easy).
Form reports are based on a structure of rows and columns called a form (template), which
you define separately. Form reports are divided according to the degree of complexity,
depending on whether they have one axis or two, and whether or not a key figure is used in
the form definition.
How Is Drilldown Reporting Organized?
As shown below, you can use characteristics, key figures, and forms to define reports. When
you create a report, the result is a series of lists and graphics that you can display on screen.
You can also print reports, send them by fax or e-mail, or save them as files for PC
applications such as Microsoft Word and Excel.
CharacteristicsKey Figures
Form
Report Name
Create
Change
Execute
20 %
20 %
20 %
20 %
20 %
Online
Background
MS Word
MS Excel
Export Save
Fax
Internet
Send
List Graphics
Chapter 4: Drilldown Reporting
Learning the Basics of Drilldown Reporting
Report Development Tools
4–5
Key Figures
Key figures (value fields) contain amounts, quantities, or events. Your application contains a
number of key figures that may be relevant for analysis purposes. Key figures include not
only stored values and quantities, but also values that are calculated from these, based on
formulas that you can define.
Examples of key figures:
< Value: Costs, sales, sales deductions
< Quantity: Number of employees, sales quantity, amount of billings posted
< Calculated value: Sales per employee, contribution margin
Characteristics
Characteristics refer to unique, keyed information that you use to select, sort, and
summarize data. Characteristics determine how your data can be classified. The SAP
organizational units Controlling area, Company code, Business area, and Division are examples
of characteristics. For each characteristic, a hierarchy (or many hierarchies) may be defined
in order to reflect semantic relationships between the characteristic values. For example, you
could set up a hierarchy for a characteristic sales region starting with worldwide sales at the
top level and then subdivide it by continents, countries, and regions. In Drilldown
reporting, these characteristic hierarchies are presented as a tree structure you can
interactively expand or collapse to the desired level.
Forms
Forms are the basic building blocks of drilldown reports. A form determines the content and
formal structure of a report. A form can be thought of as template and a semifinished report,
which you complete by specifying (additional) characteristics and key figures when you
define the individual report.
< Since forms can be shared across many reports, we recommend that you name them in
such a way that the name does not limit their use.
< The content of a form should generally be fixed and change only under rare
circumstances. When you change a form, it impacts every report that uses the form.
Related Terminology
< Drilldown: This term is somewhat loosely used in the R/3 System. In this guidebook,
drilldown implies drilling down within the confines of the report you are viewing—not
drilling down to lower levels of detail across the R/3 System. However, we mean to
distinguish between the function of drilling down (as is available with several R/3
report development tools) and the Drilldown reporting tool, which is the focus of this
chapter.
< Painter: Graphical point-and-click technology in the R/3 System, the Painter allows you
to quickly build report queries against selected databases. The term “Painter” used here
is different from the “Report Painter” tool covered in chapter 3.
Chapter 4: Drilldown Reporting
Learning the Basics of Drilldown Reporting
Reporting Made Easy
4–6
< Variables: These are generally attached to certain characteristics of the report. Variables
allow you to prompt the user to select different characteristics for running a report. This
feature makes it possible to create reports that are flexible for different needs. You can
define global and local variables, depending on how often the variable is used. If the
variables are used more frequently, define them as global. You can use global variables
in any forms.
< Axis: Refers to the X and Y axes of the body of a form report. A one-axis report display
is made up of just rows or just columns. A two-axis report display has a more
conventional row and column look and feel.
< Freezing: Drilldown can save only the data that an individual report requires. This
allows a report to run many times without having to go back to large volumes of the
original data store.
How Does Drilldown Reporting Differ From Other Reporting Tools?
A fundamental difference between Drilldown reporting and other R/3 report development
tools is that with other tools a user can develop reports from application areas (such as
accounts payable in FI, shipping in SD, or payroll accounting in HR). Reports can also be
developed within the menu of the reporting tool itself. However, with Drilldown reporting,
you can only develop reports within the application menus. Other than the application area
menus, there is no central report development for drilldown reports. Consequently, the
reports you develop in the Executive Information System or Profitability Analysis (for
example) are available for use only within those specific applications.
Note: Drilldown reporting is often confused with Report Painter/Report Writer, a tool
that is most commonly used in FI and CO. Both use the term “form painter,” but use the
forms differently.
Because the Drilldown tool is specifically designed for reporting, it simplifies the steps
necessary to write reports. Double-clicking on hotspots does much of the development, with
the hotspots prompting you along the way. Thus, Drilldown reporting tool makes it easy to
create reports.
What are the Prerequisites?
Drilldown reporting tends to access summary data that requires a one-time configuration
effort. Once the summary tables have been configured and are populated with data, there is
little need for further configuration.
Chapter 4: Drilldown Reporting
Creating a Drilldown Report: Profitability Analysis
Report Development Tools
4–7
Quick View of the Output
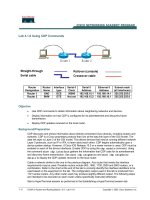
Shown below is the output of a sample drilldown report. With just a few hours of basic
training, you should be able to create this two-axis report in 30 minutes or less.
Creating a Drilldown Report: Profitability Analysis
In this section, you get a guided tour of how to create a two-axis form report. This step-by-
step approach is built around a sample report (see the graphic on the next page). Take a
minute to familiarize yourself with the scenario and the desired report.
Note: Drilldown reporting is a report development tool used as a background engine in
several applications. In this chapter, we provide an example of creating a drilldown
report in the application area of Profitability Analysis (CO-PA).
Appendix F provides an additional perspective on how to create a drilldown report
using the Executive Information System (EIS).
Example: Bungee Corporation wants to build a graphical, interactive, and user-friendly
form report against its profitability analysis data. Design a two-axis form report to allow
users to drill down by customer or customer group.
Chapter 4: Drilldown Reporting
Creating a Drilldown Report: Profitability Analysis
Reporting Made Easy
4–8
Note: The example shown here was created using Release 4.5A. While this guidebook
set generally provides information about Release 4.0B, we created this example in
Release 4.5A to take advantage of some of the settings provided in the 4.5A IDES system.
If you are familiar with profitability analysis in R/3, you may know what a CO-PA
operating concern is and what the characteristics and key figures contained in an
operating concern are. If not, you may not fully appreciate all of the business logic in the
example. However, you will see how reports are created with the Drilldown tool.
The graphic below shows what the finished example report looks like.
< First axis: The columns (beginning with Machinery) form the first axis for this report.
< Second axis: The rows (beginning with Sales Quantity) form the second axis.
< Characteristics: The drilldown characteristics in this example are Customer Group and
Customer. The graphic shows report data, grouped by customer.
Second axis (Rows)
Characteristics
First axis (Columns)
Chapter 4: Drilldown Reporting
Creating a Drilldown Report: Profitability Analysis
Report Development Tools
4–9
Basics Steps in Creating Drilldown Reports in CO–PA
To create a drilldown report in CO-PA, follow the steps shown below:
1. Enter a name for the report.
2. Decide whether you want to create a basic report or a form report. In this chapter we
cover the steps needed to create a form report.
3. For a form report, enter the name of the desired form.
4. To copy an existing report, enter the name of the report you want to copy.
5. From the initial screen, you can access the different components of the report.
6. After you have specified the desired characteristics, characteristic values, and key
figures for the report, save the report.
7. Execute the report.
Creating a Two-axis Form Report With Key Figures (in CO-PA)
To create the sample profitability analysis form
report, follow the steps shown at right.
Once a form has been created, you can attach it
to a report (as shown in step 5). The term
“attach it to a report” simply means “creating a
report according to a form.”
As mentioned in step 2 above, you must decide
whether or not to create a basic report or a
form report. Creating this form leads up to
creating a form report.
Execute report
Execute report
Trained Employee Available?
Attach your form
to the report
Attach your form
to the report
Select general data
and desired characteristics
Select general data
and desired characteristics
Define rows (second axis) and
choose characteristics or key figures
Define rows (second axis) and
choose characteristics or key figures
Define columns (first axis) and
choose characteristics or key figures
Define columns (first axis) and
choose characteristics or key figures
Set operating concern and
operating currency
Set operating concern and
operating currency
1
2
3
4
5
6
Chapter 4: Drilldown Reporting
Creating a Drilldown Report: Profitability Analysis
Reporting Made Easy
4–10
Guided Tour
Step 1: Set Operating Concern and Currency
The first step in building a form in CO-
PA is to set the operating concern and
operating currency.
1. From the SAP main menu (not
shown here) choose Acounting
→
Controlling
→
Profitability analysis.
2. Choose Environment
→
CO-PA
configuration.
3. Double-click Information System:
Forms.
4. Place the cursor on the Create form
field.
5. Click Choose to create a form.
3
5
4
Chapter 4: Drilldown Reporting
Creating a Drilldown Report: Profitability Analysis
Report Development Tools
4–11
6. Click the arrow (possible entries) to
decide which operating concern you
are going to build your query
against (for example, IDEA).
7. Under Type of Profitability Analysis,
select costing-based if it is not your
default setting.
8. Choose Enter.
9. In the Form field, enter a name for
the form and enter a text description
(for example, RME-2XWK).
10. From the Structure section, choose
Two axes (matrix).
11. Choose Continue.
You can create forms with reference to
forms previously created by entering
the name of a form in the Copy from
area.
T
he currency must be identified
(whether coming from the operating
concern or identified with the company
code).
12. In our example, select Operating
concern currency.
13. Choose Enter.
6
7
8
9
10
11
12
13
Chapter 4: Drilldown Reporting
Creating a Drilldown Report: Profitability Analysis
Reporting Made Easy
4–12
Step 2: Define the First Axis (Columns)
This is a view of a Form Painter screen
used for two axes with a key figure.
When writing any of the three form
reports you always build the form first
and then attach the form to your report.
We begin this section by focusing on
building the form, starting with the
columns.
1. Double-click on the column heading
for Column 1.
Note: Do not double-click on
XXX,XXX,XXX under the column
headings. These are called cells and will
be discussed on page 4–27.
2. Choose Characteristics as the Element
Type for the first column.
3. Choose Enter.
4. For this example, choose Product
hierarchy 1 to represent the first
column in the report.
Note: It is perfectly acceptable to
choose more than one characteristic
for a column. It all depends on your
form/report design.
5. Choose Enter.
1
2
3
4
5
Chapter 4: Drilldown Reporting
Creating a Drilldown Report: Profitability Analysis
Report Development Tools
4–13
6. Choose the Variable on/off button to
have the system prompt you to enter
a variable at run time.
7. Use possible entries to choose
variables.
8. Double-click on PRODH1_1, a single-
value variable for column 1. This
selection allows the end user to
choose from any of the product
hierarchy levels.
9. In the Short, Medium, and Long
fields, enter the text to be used for
the column heading. This example
shows how to apply another type of
variable as the heading text.
10. Choose Enter.
11. To define the remaining columns (columns 2 and 3), repeat steps 1—9 as described in this section. In
step 8 above, attach the variables PRODH1_2 and PRODH_3 to columns 2 and 3 respectively.
You can create local variables at any time without having to first define them in
configuration. Simply put the cursor in the From or To field and click the Variable on/off
button. Then type in $ followed by the variable name you want.
Next, you must indicate what kind of local text variable you just defined. In this case, we will define
attributes for the variable &$PHIERTXT.
The R/3 System recognizes four types of variables:
< Characteristic value
< Hierarchy node
< Text
< Formula
6
7
8
9
10