Sự ưa thích rủi ro, nhận thức, hành vi sử dụng thuốc bảo vệ thực vật và sức khỏe của người trồng lúa ở đồng bằng sông cửu long TT TIENG ANH
Bạn đang xem bản rút gọn của tài liệu. Xem và tải ngay bản đầy đủ của tài liệu tại đây (161.06 KB, 43 trang )
MINISTRY OF EDUCATION AND TRAING
UNIVERSITY OF ECONOMICS HCMC
SU THI THU HANG
RISK PREFERENCE,
PERCEPTION, BEHAVIOR OF
PESTICIDES AND HEALTH OF
RICE FARMERS IN THE
MEKONG DELTA
PH.D. DISSERTATION EXECUTIVE SUMMARY
HO CHI MINH CITY - 2021
MINISTRY OF EDUCATION AND TRAING
UNIVERSITY OF ECONOMICS HCMC
SU THI THU HANG
RISK PREFERENCE,
PERCEPTION, BEHAVIOR OF
PESTICIDES AND HEALTH OF
RICE FARMERS IN THE
MEKONG DELTA
MAJOR : DEVELOPMENT ECONOMICS
CODE : 9310105
PH.D. DISSERTATION EXECUTIVE SUMMARY
Supervisors:
1. Assoc. Prof. Dr. TRAN TIEN KHAI
2. Dr. LE THANH LOAN
The work was completed at:
University of Economics Ho Chi Minh City
Supervisors:
1. Assoc. Prof. Dr. TRAN TIEN KHAI
2. Dr. LE THANH LOAN
Reviewer 1:………………………………………………………...
……………………………………………………………………...
Reviewer 2:………………………………………………………...
……………………………………………………………………...
Reviewer 3:………………………………………………………...
……………………………………………………………………...
The dissertation will be defended in front of the Dissertation
Evaluation Council at the University of Economics Ho Chi Minh
City
At……..O’clock……Day…….Month…….Year
The dissertation can also be found at:
4
1. INTRODUCTION
1.1 Research background
The Mekong River Delta is the largest granary in Vietnam. In
2018, the cultivated ares of the Mekong River Delta was 4,185
million hectares, accounting for 54.32% of the total rice area of the
country. The total of rice output of the Makong River Delta was
24,441.9 thousand tons in 2018, making up 55.6% of the national
output (GSO, 2018). Although the rice cultivated area has been
decreasing over recent years, the proportion of the rice production in
the Mekong River Delta still accounts for more than 55% of the total
rice production of the total national output. In 2017, the rice export
of the Mekong River Delta reached to 5.5 million tons, with the
turnover of $2.40 billion, accounting for 93% of the total national
rice export turnover (GSO, 2018). The above facts confirm the
position and importance of the Mekong River Delta in the Vietnam’s
rice production. Therefore, studying about the rice cultivation in the
Mekong River Delta not only has the theoretical mean but also
contribute to the practical policy implementation.
As other regions across the country, the pesticides are widely
used by farmers in the Mekong River Dela. However, the use of
pesticides has many the shortcomings. Despite of the awareness of
the harmful effect of pesticides, the farmers are less likely to spend
the protective equipment as spraying or using pesticide. They only
wear the facial marks and hats. They feel uncomfortable when they
are wearing the protective gears in the local climatic condition
which, in turn, can cause their health problems (Huynh Viet Khai,
2014).
5
Regarding to the toxicity of the pesticides, the local farmers
often use types that is categorized in the toxicity type II and III (is
classified by the WHO). The pesticides are not also appropriately
used in terms of frequency, duration, dosage and does not guarantee
the safety in storage. Additionally, the disposal of solid and liquid
wastes from usage process are not often properly managed in the
fields and the storages. This not only affects the health of local
people who particularly directly used the pesticides but also affects
the living environment and other beneficial flora and fauna (Phan
Van Toan, 2013).
1.2 Empirical studies
The empirical studies both in the word and in Vietnam show
that the risk aversion can affect people’s decision, even in the
agricultural sector. The risk preference affects the farmer’s decision
in selecting the cultivars (Nguyen Thanh Phu, 2016; Liu 2013), the
amount of fertilizers used ( Khor et al., 2018) or the dosage of
pesticides (Liu and Huang, 2013). Regarding to the amount of
pesticides used, the risk aversers tend to use more pesticides. They
believe that if the pesticides were not used, they would lose their
crops which affects their productivity and reduce their income (Liu
and Huang, 2013).
Therefore, if we are aware of the farmer’s risk preferences, we
can explain their behaviour in using pesticides. This is the important
factor in studying farmer’s behavior which allows the policy makers
to understand why the farmers tend to use more the amount of
pesticide than the instructed dosage. However, the existing evidence
is mainly conducted in other countries rather than in Vietnam. There
6
are not many studies on the effect of risk preference on pesticides
use in Vietnam.
Zhang et al. (2016) argued farmer’s perception of health risks
affects their pesticide using behavior. Huynh Viet Khai (2014),
jallow et al. 92017), Migheli (2017) also showed that understanding
of risks and the knowledge of farmers in using pesticides affect the
amount of pesticide used. Therefore, studying about farmer’s
perception of risk in using pesticides plays an important role in
explaining the farmer’s behavior in using pesticides. Moreover, we
can influence the farmer’s perception to change their behaviour
which help the farmer using the pesticides reasonably and
scientificly. The risk preference is a personal characters which we
can not intervene to change it. Neverthless, the aware of the risk
preference allows us to influence and change the farmers’ perception
in different ways. The change in the aware of risk and personal
attitude to the risk preference will affect and change their behavior in
the amount of pesticides used.
Motivated by these above reasons, it is necessary and important
to study about the risk preferences and risk perception of the farmers
in using pesticides and the impact of these two factors on the
pesticides usage. The findings from this study is the scientific base
to have the appropriate solutions to mitigate the downside effects of
the unreasonable and unsafe pesticide using in the Mekong River
Delta.
The pesticides is harmful to the local environment and people’s
health. The pesticide toxicity can immediately affect after exposuring
or taking a while after exposuring. The level of harm to people’
7
health depends on the pesticide’s toxicity. Some types of pesticides
that is even attached in a small amount can seriously cause the health
issues. Once people are infected pesticides, these chemicals not only
affect the respiratory system, nervous system, skin surface but also
the circulatory system. People who directly spray pesticides are
most susceptible to their health problems due to the inhalation of
dispersed pesticides or skin surface adhesions (Phan Bich Ngan and
Dinh Xuan Thang, 2006). People who are infected by pesticides have
the symptoms such as headaches, nausea and skin issues, the effects
on the nervous system, liver and kidneys (Qiao et al, 20120.
Pesticide exposure is closely related to the cancers such as lung
cancer, prostate cancer, rectal cancer, pancreatic cancer (Alavanja
and Bonner, 2012).
Therefore, the harmful effects of the pesticides on people who
are either directly exposure or indirectly exposure to the pesticides,
the environment, ecosystem are very huge. It is necessary to evaluate
the impact of the pesticide on people’s health which helps the
farmers using the pesticides appropriately, avoiding overuse and
unnecessary use.
1.3. Research objectives and research questions
General objectives
The general objective of this study aims to measure and analyse
the impact of farmer’s risk preferences, risk perceptions as using
pesticides. The impact of the pesticides usage on farmer’s health.
From these, the recommendations for farmers and the policy makers
in managing and using the pesticides are proposed.
8
Specific objectives
1. Measuring the risk preferences, farmer’s risk perceptions in using
pesticides.
2. Evaluate the impact of risk preferences, risk perceptions in using
pesticides on the amount of pesticides used.
3. Measuring and evaluating the impact of the amount of pesticides
used on the health costs of farmers who exposed to pesticides in the
Mekong River Delta.
Research Questions
1) How is the risk preferences of farmers in the Mekong River Delta?
2) How is they aware of the risks in using the pesticides?
3) In what extent the risk preferences and risk perception of farmers
affect the amount of pesticides used?
4) How does the amount of pesticides used affect the health cost of
farmers who exposed to the pesticides?
1.4 Object and scope of the study
The objects of this study is the use of pesticides of the farmers
in the Mekong River Delta. The respondents are the farmer
households who have planted rices for three years up to the interview
date.
Scope of the study
A study is conducted in three provinces: An Giang, Kien Giang
and Vinh Long in three the planting seasons in 2018-2019. The total
of observations is 238 observations (An Giang 92, Kien Giang 71
and Vinh Long 75).
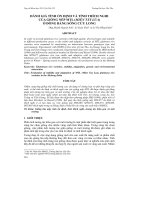
2. THEORETICAL FRAMEWORK
Protective solutions
9
The Expected Utility theory is used to explain and calculate the
coefficient of risk aversion among the farmer households. The farmer
behavior theory shows how the farmers decide the types of inputs
approach
and what factors influencingIllness
the cost
amount
of the pesticides used.
Perception
behavior
theory
Moreover,
the Cognitive
Behavior Theory is employed to explain
Peasant
behavior
theory
how the perceptions affect the behavior of using pesticides among
the farmers. Finally, the health production function is used to model
the impact of pesticides on the health costs of the farmers.
objectives 1
objectives 3
objectives 2
3. METHODOLOGY
3.1 Analytical framework of the study
Behavior of
pesticides
used
Expected utility theory
Ways of using
Risk preferences
pesticides of the farmers
Farmer’s risk perception in using pesticides
Amount of p
10
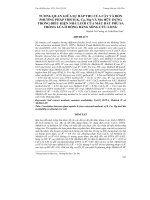
3.2 Measuring the risk preferences
The lottery game is designed with 10 different scenarios
and two different options which is similar to Holt and
Laury(2002).
Table 3.1 Outcomes in the lottery game
Option A
No
.
1
2
3
4
5
6
7
8
9
Option B
E(A)
Gain
Gain
VND35.000
VND44.000
Picked
Picked
up
up
number 1-9
Picked
up
number 10
Picked
up
number 1-8
Picked
up
number 9,10
Picked
up
number 1-7
Picked
up
number 8-10
Picked
up
number 1-6
Picked
up
number 7-10
Picked
up
number 1-5
Picked
up
number 6-10
Picked
up
number 1-4
Picked
up
number 5-10
Picked
up
number 1-3
Picked
up
number 4-10
Picked
up
number 1,2
Picked
up
number 3-10
Picked
up
number 1
number 2-10
Picked
up
number 1-10
(VND1000)
35,9
36,8
37,7
38,6
39,5
40,4
41,3
42,2
43,1
44
Gain
E(B)
Gain
VND2.000 VND85.000
Picked
up
Picked
up
number 1-9
Picked up
number 10
Picked
up
number 1-8
Picked up
number 9,10
Picked
up
number 1-7
Picked up
number 8-10
Picked
up
number 1-6
Picked up
number 7-10
Picked
up
number 1-5
Picked up
number 6-10
Picked
up
number 1-4
Picked up
number 5-10
Picked
up
number 1-3
Picked up
number 4-10
Picked
up
number 1,2
Picked up
number 3-10
Picked
up
number 1
number 2-10
Picked
up
number 1-10
(VND1000)
10,3
18,6
26,9
35,2
43,5
51,8
60,1
68,4
76,7
85
Source: Author’s design based on Khor et al. (2018), Holt and Laury
(2002)
11
The amount of the payoffs are fixed with four different levels.
In which, the safe option (Option A) includes VND 35,000 and VND
44,000; the risky option (Option B) includes VND 2,000 and VND
85,000. The payoff has to make sure the difference principle that the
difference in the safe option is lower than the difference in the risky
option.
Players are guided by the interviewer how to play, using
illustrative examples for players to understand. The specific way to
play the game is as follows
Step 1: Player carefully reads the cases with 10 situation. In
each situation, the players chose the answer option either option A or
option B (only changes option from A to B and not vice versa)
Step 2: the player will collect the prepared paper in which, one
of the number from 1 to 10 is written. The number in this piece of
paper shows the option that the players are collected to pay. For
example, if the player draws the number 3, the payoff will be on line
3. Then, this piece of paper is returned back to the box.
Step 3: The player continues to draw the piece of paper in the
box to define the amount of payoff that the players will be paid
according to their option drawn. For example, if the player draws the
number 4, he / she will receive VND 35,000 if he chooses option A
and receives VND 2,000 if the player chooses option B (which is the
prize on line 3 that the player has drawn in step 2)
Based on the transition point from plan A to plan B to calculate
the range of value of risk preference.
The utility function of each payoff: U(Y) =
(3.1)
12
Where: Y is the payoff, r is the parameter measuring the risk
preference.
In principle, the player will choose option A when the expected
value of the option A is greater or at least equal to the expected value
of option B (UE(A) >= UE(B)). With:
UE(A) = p1.U(A1) + p2.U(A2)
(3.2)
UE(B) = p1.U(B1) + p2.U(B2)
(3.3)
Where A1, A2 are the payoff of the option A; B1, B2 are the
payoff of option B. p1, p2 are the probability of getting payoffs in
each option.
The player only changes to the option B as UE(A) <= UE(B).
Then, only a small range of value r can satisfy this condition. The
parameter measuring the risk preference are presented in Table 3.2
Table 3.1 Parameter measuring the risk preference
N
u
m
b
e
r
o
f
s
a
f
e
c
R
a
n
g
e
o
f
r
e
l
a
t
i
v
R
i
s
k
p
r
e
f
e
r
e
n
c
e
13
h
o
i
c
e
s
e
r
i
s
k
a
v
e
r
s
i
o
n
0
r
<
1
,
6
9
c
l
a
s
s
i
f
i
c
a
t
i
o
n
C
ự
c
k
ỳ
ư
a
t
h
í
c
h
14
r
ủ
i
1
1
,
6
9
<
r
r
o
C
ự
c
k
ỳ
<
ư
a
0
.
9
3
t
h
í
c
h
r
ủ
i
2
-
r
o
R
15
0
.
9
3
<
ấ
t
r
t
h
í
c
h
<
0
,
4
7
3
0
.
4
7
<
r
<
ư
a
r
ủ
i
r
o
Ư
a
t
h
í
c
h
r
ủ
16
4
0
,
1
4
0
.
1
4
<
r
i
r
o
T
r
u
n
g
l
ậ
p
<
0
,
1
5
5
0
.
1
5
<
r
r
ủ
i
r
o
H
ơ
i
e
n
g
17
<
0
,
4
1
6
0
.
4
1
<
ạ
i
r
ủ
i
r
o
E
n
g
ạ
i
r
<
7
0
,
6
7
0
.
6
7
<
r
ủ
i
r
o
R
ấ
t
e
18
r
<
0
,
9
6
8
0
.
9
6
<
n
g
ạ
i
r
ủ
i
r
o
C
ự
c
k
ỳ
r
e
<
1
,
3
4
n
g
ạ
i
r
ủ
i
19
9
1
0
1
,
3
4
<
r
r
o
K
h
ơ
n
g
c
h
ấ
p
n
h
ậ
n
r
ủ
i
r
o
Nguồn: tính tốn của tác giả
3.3 Measuring the risk perception in using pesticides
Table 3.3 Questionaire for measuring the risk perception
Question
S
20
o
u
r
c
e
1. All of the pesticides are
W
toxic to human health
a
n
g
(
2
0
1
7
)
2. Pesticides can harm to
J
everyone,
a
including
people with good health.
l
l
o
w
(
2
0
1
7
)
21
3. Pesticides affect the
W
living
a
environment
of
surrounding people.
n
g
(
2
0
1
7
)
,
J
a
l
l
o
w
(
2
0
1
7
)
4. Pesticides can harm to
J
other beneficial animals.
a
l
22
l
o
w
(
2
0
1
7
)
5. Based on the product
D
package, I can recognize
e
the toxicity level of the
v
pesticides.
i
(
2
0
0
9
)
6.
Vomiting,
diarrhea,
K
froth and cramps are the
u
signs
m
of
poisoning.
pesticides
a
r
i
&
23
S
h
a
r
m
a
(
2
0
1
8
)
7.
Exposing
to
the
K
pesticides can cause the
u
cancer.
m
a
r
i
&
S
h
a
r
m
a
24
(
2
0
1
8
)
8. Pesticides can cause
K
allergies and blistering.
u
m
a
r
i
&
S
h
a
r
m
a
(
2
0
1
8
)
25
9.
Exposing
to
the
K
pesticides can cause eyes
u
damage
m
a
r
i
&
S
h
a
r
m
a
(
2
0
1
8
)
10. Pesticides can pose
K
many health risks for the
u
pregnant
m
children.
women
and
a
r
i