Tài liệu Chiller plant design ppt
Bạn đang xem bản rút gọn của tài liệu. Xem và tải ngay bản đầy đủ của tài liệu tại đây (3.11 MB, 96 trang )
Application Guide AG 31-003-1
© 2002 McQuay International
Chiller Plant Design
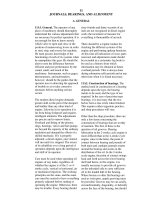
Elevation Difference
Column Height
When Pump Is Off
Building Load
600 Tons
(50% Load)
Secondary Pump
1440 gpm
480 gpm Flow Through
Decoupler
Flow
Two 400 Ton Chillers
Each At 300 Tons
(Balanced Load)
51.5F Return Water
To Chiller
Chiller 1- On
Chiller 2- On
Chiller 3- Off
44F
44F
54F
Two Primary Pumps
Each At 960 gpm
51.5F
2 Application Guide AG 31-003-1
Table of Contents
Introduction ................................................................................................................. 4
Using This Guide............................................................................................................................... 4
Basic System ............................................................................................................... 4
Chiller Basics..................................................................................................................................... 4
Piping Basics ..................................................................................................................................... 7
Pumping Basics ............................................................................................................................... 11
Cooling Tower Basics...................................................................................................................... 15
Load Basics ..................................................................................................................................... 20
Control Valve Basics ....................................................................................................................... 20
Loop Control Basics........................................................................................................................ 23
Piping Diversity............................................................................................................................... 24
Water Temperatures and Ranges ............................................................................... 25
Supply Air Temperature................................................................................................................... 25
Chilled Water Temperature Range................................................................................................... 26
Condenser Water Temperature Range.............................................................................................. 26
Temperature Range Trends.............................................................................................................. 27
Air and Evaporatively Cooled Chillers ..................................................................... 28
Air-Cooled Chillers ......................................................................................................................... 28
Evaporatively Cooled Chillers......................................................................................................... 30
Dual Compressor and VFD Chillers ......................................................................... 31
Dual Compressor Chillers................................................................................................................ 31
VFD Chillers ................................................................................................................................... 31
System Design Changes................................................................................................................... 32
Mechanical Room Safety .......................................................................................... 34
Standard 34...................................................................................................................................... 34
Standard 15...................................................................................................................................... 34
Single Chiller System................................................................................................ 38
Basic Operation ............................................................................................................................... 38
Basic Components........................................................................................................................... 38
Single Chiller Sequence of Operation.............................................................................................. 39
Parallel Chiller System.............................................................................................. 41
Basic Operation ............................................................................................................................... 41
Basic Components........................................................................................................................... 41
Parallel Chiller Sequence of Operation ........................................................................................... 42
Series Chillers ........................................................................................................... 44
Basic Operation ............................................................................................................................... 44
Basic Components........................................................................................................................... 44
Series Chillers Sequence of Operation ............................................................................................ 46
Series Counterflow Chillers............................................................................................................. 47
Using VFD Chillers in Series Arrangements ................................................................................... 49
System Comparison ......................................................................................................................... 49
Primary/Secondary Systems ...................................................................................... 51
Application Guide AG 31-003-1 3
Basic Operation ...............................................................................................................................51
Basic Components ........................................................................................................................... 51
Very Large Chiller Plants................................................................................................................. 58
Primary/Secondary Sequence of Operation .....................................................................................58
Water-Side Free Cooling ........................................................................................... 61
Direct Waterside Free Cooling.........................................................................................................61
Parallel Waterside Free Cooling ......................................................................................................61
Series Waterside Free Cooling.........................................................................................................62
Waterside Free Cooling Design Approach ....................................................................................... 63
Cooling Tower Sizing ...................................................................................................................... 63
Waterside Free Cooling Sequence of Operation ..............................................................................64
Economizers and Energy Efficiency ................................................................................................ 65
Hybrid Plants............................................................................................................. 66
Heat Recovery and Templifiers™ ............................................................................. 67
General.............................................................................................................................................67
Load Profiles....................................................................................................................................67
Heat Recovery Chillers.................................................................................................................... 67
Templifiers™ ...................................................................................................................................71
ASHRAE Standard 90.1 .................................................................................................................. 73
Variable Primary Flow Design .................................................................................. 75
Basic Operation ...............................................................................................................................75
Basic Components ........................................................................................................................... 75
Variable Primary Flow Sequence of Operation................................................................................ 76
Training and Commissioning...........................................................................................................78
Low Delta T Syndrome ............................................................................................. 80
Low Delta T Example ......................................................................................................................80
Low Delta T Syndrome Causes and Solutions ................................................................................. 82
Other Solutions ................................................................................................................................ 84
Process Applications ................................................................................................. 86
Process Load Profiles ...................................................................................................................... 86
Condenser Relief..............................................................................................................................87
Winter Design.................................................................................................................................. 87
Chilled Water Volume ...................................................................................................................... 87
Temperatures and Ranges ................................................................................................................ 88
Minimum Chilled Water Volume .............................................................................. 89
Estimating System Volume ..............................................................................................................89
Evaluating System Volume .............................................................................................................. 89
Conclusions ............................................................................................................... 92
References ................................................................................................................. 93
The information contained within this document represents the opinions and suggestions of
McQuay International. Equipment, the application of the equipment, and the system
suggestions are offered by McQuay International as suggestions only, and McQuay
International does not assume responsibility for the performance of any system as a result of
these suggestions. Final responsibility for the system design and performance lies with the
system engineer.
4 Application Guide AG 31-003-1
Introduction
Using chilled water to cool a building or process is efficient and flexible. A two-inch Schedule 40
pipe of chilled water can supply as much comfort cooling as 42" diameter round air duct. The use of
chillers allows the design engineer to produce chilled water in a central building location or even on
the roof and distribute the water economically and without the use of large duct shafts. Chilled water
also provides accurate temperature control that is especially useful for variable air volume (VAV)
applications.
The purpose of this manual is to discuss various piping and control strategies commonly used with
chilled water systems including variable flow pumping systems.
Using This Guide
This Guide initially discusses the components used in a chilled water
system. It then reviews various chiller plant designs explaining their
operation, strengths and weaknesses. Where appropriate, sequence of
operations are provided. Each project is unique so these sequences are
just guidelines.
In addition, many sections reference ASHRAE Standard 90.1-2001. The
ASHRAE section numbers are provided in parentheses to direct the
reader. The sections referenced in this Guide are by no means complete.
It is recommended that the reader have access to a copy of Standard 90.1
as well as the Users Manual. The Standard and manual can be purchased
online at WWW.ASHRAE.org.
Basic System
Figure 1 shows a basic chiller loop with a water-cooled chiller. The system consists of a chiller,
cooling tower, building cooling load, chilled water and condensing water pumps and piping. This
section will review each of the components.
Figure 1 - Single Chiller Loop
Chiller Basics
The chiller can be water-cooled, air-cooled or evaporatively cooled. The compressor types typically
are reciprocating, scroll, screw or centrifugal. The evaporator can be remote from the condensing
section on air-cooled units. This
has the advantage of allowing the
chilled water loop to remain inside
the building envelope when using
an outdoor chiller. In applications
where freezing conditions can be
expected, keeping the chilled water
loop inside the building avoids the
need for some form of antifreeze.
There can be multiple chillers in a
chilled water plant. The details of
various multiple chiller plant
designs will be discussed in future
sections.
Condenser
Water Loop
Cooling Tower
Building Load
Chilled Water Loop
Chiller
Chilled Water Pump
Condenser
Water Pump
Application Guide AG 31-003-1 5
The chilled water flows through the evaporator of the chiller. The evaporator is a heat exchanger
where the chilled water gives up its sensible heat (the water temperature drops) and transfers the heat
to the refrigerant as latent energy (the refrigerant evaporates or boils).
Flow and Capacity Calculations
For air conditioning applications, the common design conditions are 44°F supply water temperature
and 2.4 gpm/ton. The temperature change in the fluid for either the condenser or the evaporator can
be described using the following formula:
Q = W x C x ∆T
Where
Q = Quantity of heat exchanged (Btu/hr)
W = flow rate of fluid (USgpm)
C = specific heat of fluid (Btu/lb· °F)
∆T = temperature change of fluid (°F )
Assuming the fluid is water, the formula takes the more common form of:
Load (Btu/hr) = Flow (USgpm) x (°F
in
– °F
out
) x 500
Or
Load (tons) = Flow (USgpm) x (°F
in
– °F
out
)/24
Using this equation and the above design conditions, the temperature change in the evaporator is
found to be 10°F. The water temperature entering the evaporator is then 54°F.
Most air conditioning design conditions are based on 75°F and 50% relative humidity (RH) in the
occupied space. The dewpoint for air at this condition is 55.08°F. Most HVAC designs are based on
cooling the air to this dewpoint to maintain the proper RH in the space. Using a 10°F approach at the
cooling coil means the supply chilled water needs to be around 44°F or 45°F.
The designer is not tied to these typical design conditions. In fact, more energy efficient solutions can
be found by modifying the design conditions, as the project requires.
Changing the chilled water flow rate affects a specific chiller's performance. Too low a flow rate
lowers the chiller efficiency and ultimately leads to laminar flow. The minimum flow rate is typically
around 3 fps (feet per second). Too high a flow rate leads to vibration, noise and tube erosion. The
maximum flow rate is typically around 12 fps. The chilled water flow rate should be maintained
between these limits of 3 to 12 fps.
The condenser water flows through the condenser of the chiller. The condenser is also a heat
exchanger. In this case the heat absorbed from the building, plus the work of compression, leaves the
refrigerant (condensing the refrigerant) and enters the condenser water (raising its temperature). The
condenser has the same limitations to flow change as the evaporator.
Chillers and Energy Efficiency
Chillers are often the single largest electricity users in a building. A 1000 ton chiller has a motor
rated at 700 hp. Improving the chiller performance has immediate benefit to the building operating
cost. Chiller full load efficiency ratings are usually given in the form of kW/ton, COP (Coefficient of
Performance = kW
cooling
/ kW
input
) or EER (Energy Efficiency Ratio = Tons X 12/ kW
input
). Full load
performance is either the default ARI conditions or the designer specified conditions. It is important
to be specific about operating conditions since chiller performance varies significantly at different
operating conditions.
6 Application Guide AG 31-003-1
Chiller part load performance can be given at designer-specified conditions or the NPLV (Non-
Standard Part Load Value) can be used. The definition of NPLV is spelled out in ARI 550/590-98,
Test Standard for Chillers. For further information refer to McQuay Application Guide AG 31-002,
Centrifugal Chiller Fundamentals.
Figure 2 - ASHRAE Std 90.1 Chiller Performance Table
1
Since buildings rarely operate at design load conditions (typically less than 2% of the time) chiller
part load performance is critical to good overall chiller plant performance. Chiller full and part load
efficiencies have improved significantly over the last 10 years (Chillers with NPLVs of 0.35 kW/ton
are available) to the point where future chiller plant energy performance will have to come from
chiller plant design.
ASHRAE Standard 90.1-2001 includes mandatory requirements for minimum chiller performance.
Table 6.2.1.C of this standard covers chillers at ARI standard conditions. Tables 6.2.1H to M cover
centrifugal chillers at non-standard conditions.
1
Copyright 2001, American Society Of Heating, Air-conditioning and Refrigeration Engineers Inc.,
www.ashrae.org. Reprinted by permission from ASHRAE Standard 90.1-2001
Water Chilling Packages – Minimum Efficiency Requirements
Equipment Type Size Category
Subcate
gory or
Rating
Condition
Minimum Efficient Test Procedure
Air Cooled, with Condenser,
Electrically Operated
<150 tons 2.80 COP
3.05 IPLV
ARI 550/590
>150 tons
Air Cooled, without Condenser,
Electrically Operated
All Capacities 3.10 COP
3.45 IPLV
Water Cooled, Electrically Operated,
Positive Dis
placement (Reciprocating)
All Capacities 4.20 COP
5.05 IPLV
ARI 550/590
Water Cooled,
Electrically Operated,
Positive Displacement
(Rotary Screw and Scroll)
<150 tons 4.45 COP
5.20 IPLV
ARI 550/590
>150 tons and
<300 tons
4.90 COP
5.60 IPLV
>300 tons 5.50 COP
6.15 IPLV
Water Cooled, Electrically Operated,
Centrifugal
<150 tons 5.00 COP
5.25 IPLV
ARI
5
50/590
>l50 tons and
<300 tons
5.55
COP
5.90 IPLV
>300 tons 6.10 COP
6.40 IPLV
Air-Cooled Absorption Single Effect
All Capacities 0.60 COP ARI 560
Water-Cooled Absorption Single
Effect
All Capacities 0.70 COP
Absorption Double Effect, Indirect-
Fired
All Capacities 1.00 COP
1.05 IPLV
Absorption Double Effect, Direct-Fired
All Capacities 1.00 COP
1.00 IPLV
a
The chiller equipment requirements do not apply for chillers used in low-temperature applications where the design leaving fluid temperature is <4°F.
b
Section 12 contains a complete specification of the referenced test procedure, including the referenced year version of the test procedure.
☺Tip: To convert from COP to kW/ton;
COP = 3.516/(kW/ton)
To calculate EER = Tons x 12/
(total kW input)
Application Guide AG 31-003-1 7
Piping Basics
Static Pressure
Figure 3 - Closed Loop
The piping is usually steel, copper or
plastic. The chilled water piping is
usually a closed loop. A closed loop is
not open to the atmosphere. Figure 3
shows a simple closed loop with the
pump at the bottom of the loop. Notice
that the static pressure created by the
change in elevation is equal on both sides
of the pump. In a closed loop, the pump
needs only to overcome the friction loss
in the piping and components. The pump
does not need to “lift” the water to the
top of the loop.
When open cooling towers are used in
condenser piping, the loop is an open
type. Condenser pump must overcome
the friction of the system and “lift” the water from the sump to the top of the cooling tower. Figure 4
shows an open loop. Notice the pump need only overcome the elevation difference of the cooling
tower, not the entire building.
In high-rise applications, the static pressure can
become considerable and exceed the pressure
rating of the piping and the components such as
chillers. Although chillers can be built to
higher pressure ratings (The standard is typically 150 PSI but the reader is advised to check with the
manufacturer) high pressure systems can become expensive. The next standard rating is typically 300
PSI. Above that, the chillers become very expensive. One solution is to use heat exchangers to
isolate the chillers from the static pressure. While this solves the pressure rating for the chiller, it
introduces another device and another approach that affects supply water temperature and chiller
performance. A second solution is to locate chiller plants on various floors throughout the building
selected to avoid exceeding the 150 PSI chiller rating.
Figure 4 -Open Loop
Expansion Tanks
An expansion tank is required in the chilled
water loop to allow for the thermal
expansion of the water. Expansion tanks
can be open type, closed type with air-water
interface or diaphragm type. Tank location
will influence the type. Open tanks must
be located above the highest point in the
system (for example, the penthouse). Air-
water interface and diaphragm type tanks
can be located anywhere in the system.
Generally, the lower the pressure in the
tank, the smaller the tank needs to be. Tank
size can be minimized by locating it higher
in the system.
Water Column
Water Column
Static Head
Elevation Difference
Column Height
When Pump Is Off
☺Tip: Most chillers are rated for 150 PSI
water side pressure. This should be considered
care
fully for buildings over 10 stories.
8 Application Guide AG 31-003-1
Figure 5 - Expansion Tank Location
The pressure at which the tank is operated is the reference point for the entire hydronic system. The
location of the tank -which side on the pump (suction or discharge) - will affect the total pressure seen
by the system. When the pump is off, the tank will be exposed to the static pressure plus the pressure
due to thermal expansion. If the tank is located on the suction side, when the pump is running, the
total pressure seen on the discharge side will be the pressure differential, created by the pump, added
to the expansion tank pressure. If the expansion tank is located on the discharge side of the pump, the
discharge pressure will be the same as the expansion tank pressure and the suction side pressure will
be the expansion tank pressure minus the pump pressure differential.
Piping Insulation
Chilled water piping is insulated since the water and hence the piping is often below the dewpoint
temperature. Condensate would form on it and heat loss would occur. The goal of the insulation is to
minimize heat loss and maintain the outer surface above the ambient air dewpoint.
Condenser Water Piping
In most cases, the condenser water piping is an open loop. Figure 4 shows an open loop with the
water open to the atmosphere. When the pump is not running, the level in the supply and return
piping will be even at the level of the sump. When the pump operates, it needs to overcome the
friction loss in the system and “lift” the water from the sump level to the top of the loop. Condenser
water piping is typically not insulated since there will be negligible heat gain or loss and sweating will
not occur. If the piping is exposed to cold ambient conditions, however, it could need to be insulated
and heat traced to avoid freezing.
Discharge Pressure =
Expansion Tank Pressure +
Pump Head
Discharge Pressure =
Expansion Tank Pressure
Suction Pressure =
Expansion Tank Pressure
-Pump Head
Application Guide AG 31-003-1 9
Reverse Return/Direct Return Piping
Figure 6 - Reverse Return Piping
Figure 6 shows reverse return piping. Reverse return piping is designed such that the path through
any load is the same length and therefore has approximately the same fluid pressure drop. Reverse
return piping is inherently self-balancing. It also requires more piping and consequently is more
expensive.
Figure 7 - Direct Return Piping
Direct return piping results in the load closest to the chiller plant having the shortest path and
therefore the lowest fluid pressure drop. Depending on the piping design, the difference in pressure
drops between a load near the chiller plant and a load at the end of the piping run can be substantial.
Balancing valves will be required. The advantage of direct return piping is the cost savings of less
piping.
For proper control valve selection, it is necessary to know the pressure differential between the supply
and return header (refer to Control Valve Basics, page 20). While at first it would appear with
reverse return piping, that the pressure drop would be the same for all devices, this is not certain.
Changes in pipe sizing in the main headers, different lengths and fittings all lead to different pressure
differentials for each device. When the device pressure drop is large relative to piping pressure
losses, the difference is minimized.
In direct return piping, the pressure drops for each device vary at design conditions depending on
where they are in the system. The valve closest to the pumps will see nearly the entire pump head.
Valves at the furthest end of the loop will see the minimum required pressure differential. Assuming
10 Application Guide AG 31-003-1
the pressure differential sensor is located at the furthest end, all valves in a direct return system should
be selected for the minimum pressure differential. This is because if any one device is the only one
operating, the pressure differential controller will maintain the minimum differential across that
device.
The decision whether to use direct or reverse return piping should be based on system operability vs.
first cost. Where direct return piping is used, flow-balancing valves should be carefully located so
that the system can be balanced.
Piping and Energy Efficiency
Piping materials and design have a large influence on the system pressure drop, which in turn affects
the pump work. Many of the decisions made in the piping system design will affect the operating cost
of the chiller plant every hour the plant operates for the life of the building. When viewed from this
life cycle point of view, any improvements that can lower the operating pressure drop should be
considered. Some areas to consider are:
Y
Pipe material. Different materials have different friction factors.
Y
Pipe sizing. Smaller piping raises the pressure drop. This must be balanced against the capital
cost and considered over the lifetime of the system.
Y
Fittings. Minimize fittings as much as possible.
Y
Valves. Valves represent large pressure drops and can be costly. Isolation and balancing valves
should be strategically placed.
Y
Direct return vs. Reverse return.
Piping insulation reduces heat gain into the chilled water. This has a compound effect. First, any
cooling effect that is lost due to heat gain is additional load on the chiller plant. Second, in most
cases, to account for the resultant temperature rise, the chilled water setpoint must be lowered to
provide the correct supply water temperature at the load. This increases the lift on the chillers and
lowers their performance.
ASHRAE 90.1-2001 requires the following for piping systems:
Y
Piping must be insulated as per ASHRAE Standard 90.1 Table 6.2.4.1.3. (See Table 1)
Exceptions include:
Y
Factory installed insulation.
Y
Systems operating between 60°F and 105°F.
Y
The hydronic system be proportionally balanced in a manner to first minimize throttling losses
and then the impeller trimmed or the speed adjusted to meet the design flow conditions
(6.2.5.3.3)
Exceptions include:
Y
Pumps with motors less than 10 hp.
Y
When throttling results in no greater than 5% of nameplate horsepower or 3 hp, whichever is
less.
Y
Three pipe systems with a common return for heating and cooling are not allowed. (6.3.2.2.1)
Y
Two pipe changeover systems are acceptable providing: (6.3.2.2.2)
Y
Controls limit changeovers based on15°F ambient drybulb deadband.
Y
System will operate in one mode for at least 4 hours.
Y
Reset controls lower the changeover point to 30°F or less.
Y
Systems with total pump nameplate horsepower exceeding 10 hp shall be variable flow able to
modulate down to 50%. (6.3.4)
Application Guide AG 31-003-1 11
Table 1 - Minimum Piping Insulation As Per Std 90.1
2
Insulation Conductivity Nominal Pipe or Tube Size (in)Fluid
Design
Operating
Temp.
Range (°F)
Conductivity
Btu•in/(h•ft2•°F)
Mean Rating
Temp °F
<1 1 to <1-1/2 1-1/2 to <4 4<8 >8
Cooling Systems (Chilled Water, Brine and Refrigerant)
40-60 0.22-0.28 100 0.5 0.5 1.0 1.0 1.0
>60 0.22-0.28 100 0.5 1.0 1.0 1.0 1.5
Pumping Basics
Figure 8 - Inline Centrifugal Pump
Typically centrifugal type pumps are used for both condenser
water and chilled water systems. They can be either inline or base
mounted. The pumps must be sized to maintain the system
dynamic head and the required flow rate. Normally, the pumps are
located so they discharge into the chiller heat exchangers.
Figure 9 - Basic Pump Curve
Centrifugal pumps are non-positive displacement type
so the flow rate changes with the head. The actual
operating point is where the system curve crosses the
pump curve. In systems with control valves, the
system curve changes every time a valve setting
changes. This is important because the pump affinity
laws cannot be used to estimate a change if the system
curve is allowed to change. Identical pumps in
parallel will double the flow at the same head.
Identical pumps in series will double the head.
2
Copyright 2001, American Society Of Heating, Air-conditioning and Refrigeration Engineers Inc.,
www.ashrae.org. Reprinted by permission from ASHRAE Standard 90.1-2001
0
10
20
30
40
50
0 50 100 150 200 250
Capacity, gpm
Total Head, ft
Point of Operation
Pump Curve
System Curve
12 Application Guide AG 31-003-1
Figure 10 - Pump Curve Profiles
Figure 10 shows a steep and flat curve profile.
Different pumps provide different profiles each with
their own advantages. The steep curve is better suited
for open systems such as cooling towers where high lift
and stable flow are desirable. The flat profile is better
suited for systems with control valves. The flat profile
will maintain the necessary head over a wide flow
range.
Figure 11 – Typical Centrifugal Pump Curve
Figure 11 shows a typical pump curve.
Since pumps are direct drive, the pump
curves are typically for standard motor
speeds (1200, 1800 or 3600 rpm). The
required flowrate and head can be plotted
and the subsequent efficiency and
impeller diameter can be found. As the
flow increases, generally the Net Positive
Suction Head (NPSH) decreases. This is
due to the increased fluid velocity at the
inlet of the impeller. NPSH is required by the pump to avoid the fluid flashing to gas in the inlet of
the impeller. This can lead to cavitation and pump damage. NPSH is an important consideration with
condenser pumps particularly when the chillers are in the penthouse and the cooling towers are on the
same level.
Required
NPSH
Flow (Usgpm)
Total Head (ft)
Impeller Dia.
Efficiency
BHP
Capacity
Total Head
Steep
Flat
☺Tip: For a constant system curve, the following
pump affinity laws may be used;
At constant impeller diameter (Variable speed)
RPM
1
/ RPM
2
= gpm
1
/ gpm
2
= (H
1
)
½
/(H
2
)
½
At constant speed (Variable impeller diameter)
D
1
/ D
2
= gpm
1
/ gpm
2
= (H
1
)
½
/(H
2
)
½
Application Guide AG 31-003-1 13
Multiple Pumps
To provide redundancy, multiple pumps are used. Common approaches are (1) a complete full-sized
stand-by pump, or (2) the design flow is met by two pumps with a third stand-by pump sized at half
the load. When multiple pumps are used in parallel, check valves on the discharge of each pump are
required to avoid “short circuiting”. Pumps can also utilize common headers to allow one pump to
serve multiple duties (headered primary pumps serving multiple chillers). Refer to Primary Pumps,
page 52 for more information on primary pumps.
Variable Flow Pumps
Many applications require the flow to change in response to load. Modulating the flow can be
accomplished by:
Y
Riding the pump curve
Y
Staging on pumps
Y
Using variable frequency drives (VFDs)
Riding the pump curve is typically used on small systems with limited flow range. Staging on pumps
was the traditional method until VFDs. Today, VFDs are the most common method for varying flow.
They are the most efficient method as well. System flow is usually controlled by maintaining a
pressure differential between the supply and return lines. The measuring point should be at or near
the end of the pipe runs as opposed to being in the mechanical room to reduce unnecessary pump
work. This is particularly true for direct return systems.
Figure 12 shows the differential
pressure sensor located at the end of
the piping run. At design load, the
pressure drop across coil 1 is 60 ft
while the pressure drop across coil 5 is
only 30 ft. Then differential pressure
controls should be set up to maintain 30 ft. When only coil 1 is operating, the pressure differential
across coil 1 will only be 30 ft if the differential sensor is located at the end of the run as shown. If the
sensors had been near the pumps, however, the differential controller would have to have been set for
60 ft to meet the design requirements. When only coil 1 operates, the pressure would have been
maintained at 60 ft, which would have wasted pump work.
Figure 12 - Secondary Pump Control in Direct Return Systems
Another method of controlling variable flow pumps is to monitor the valve positions of a control
valve in a critical part of the system. This valve is typically the furthest from the pumps. The control
Coil 1 Coil 5
Design PD is 60 Ft
When Only Coil 1
Operates
Required PD Is 30 Ft
Design PD Is
30 Ft
Differential
Pressure
Sensor
☺Tip: The differential pressure setpoint for variable
flow pumps should based on field measurements taken
during commissioning and balancing. Using an
estimated setting may lead to unnecessary pump work
for the life of the building
14 Application Guide AG 31-003-1
system then maintains the minimum pressure differential necessary, which allows the valve to
maintain setpoint. The advantage of this approach is the system pressure is maintained at the
minimum required to operate properly and that translates into minimum pump work.
When multiple pumps are required to be variable flow, such as the secondary pumps of a primary-
secondary system, VFDs are recommended on all pumps. Consider a system with two equal pumps,
both are required to meet the design flow. Pump 1 has a VFD while pump 2 does not. From 0 to 50%
flow, pump 1 can be used with its VFD. Above 50%, the second pump will be required. When pump
2 is started, it will operate at design speed. It will overpower pump 1, which will need to operate at
less than design speed and will not generate the same head.
Figure 13 - Pumping Power vs. Flow
3
Figure 13 shows percent pumping power as a
function of percent flow. From this figure, it can
be seen that VFD pumps will not save much
energy below 33% or 20Hz. Operating pumps
much below 30% starts to create problems for
motors, chiller minimum flows, etc. Since there are
minimal savings anyway, the recommended
minimum frequency is 20 Hz.
Pumps and Energy Efficiency
Pump work is deceptive. Although the motors tend to be small (when compared to chiller motors),
they operate whenever the chiller operates. In a single water-cooled chiller plant with constant chilled
water flow, it is not unusual for the pumps to use two-thirds of the energy consumed by the chiller.
Optimal use of pumps can often save more energy than any other improvement to a chiller plant.
Figure 14 - Motor and VFD Efficiency At Part Load
When both motors and VFDs operate at
less than 100% capacity, their
efficiency drops off. Figure 14 shows
motor and VFD efficiencies at part
load. It can be seen that oversizing
motors can lead to significantly poorer
performance than expected.
Oversizing pumps themselves also
leads to wasted energy. If the pumps
produce too much flow, the flow will be
throttled, usually with a balancing
valve, to meet the desired flow. This
creates an unnecessary pressure drop
and consumes power all the time the
pump operates. The solution in most
cases, is to trim the impeller.
3
Bernier, Michel., Bernard Bourret, 1999. Pumping Energy and Variable Speed Drives. ASHRAE
Journal, December 1999. ASHRAE. Atlanta, Ga.
0
20
40
60
80
100
0 10203040 5060708090100
% Of Name - Plate Load (Motor)
Or % Nominal Speed (VFD)
Motor Efficiency, %
50
60
70
80
90
100
VFD Efficiency, %
η
m
=94.187(1-e
-0.0904x
)
η
VFD
=50.87+1.283x-0.0142x
2
+5.834x10
-5
x
3
η
m
η
VFD
0
0.2
0.4
0.6
0.8
1
1.2
0 20406080100
Pump Law, Pin/Pshaft, Nominal (Spead)^3 Properly Sized Motor
Little Energy
Savings Below
20 Hz
% Of Flow (Or % Of Speed)
Pin/Pshaft, Nominal
Application Guide AG 31-003-1 15
ASHRAE 90.1-2001 requires the following for pumps:
Y
The hydronic system be proportionally balanced in a manner to first minimize throttling losses
and then the impeller trimmed or the speed adjusted to meet the design flow conditions
(6.2.5.3.3)
Exceptions include:
Y
Pumps with motors less than 10 hp.
Y
When throttling results in no greater than 5% of nameplate horsepower or 3 hp, whichever is
less.
Y
Systems with total pump nameplate horsepower exceeding 10 hp shall be variable flow able to
modulate down to 50%. (6.3.4)
Y
Individual pumps with over 100- head and a 50-hp motor shall be able to operate at 50% flow
with 30% power.
Y
The differential pressure shall be measured at or near the furthest coil or the coil requiring the
greatest pressure differential.
Exceptions include:
Y
Where minimum flow interferes with proper operation of the equipment (i.e., the chiller) and
the total pump horsepower is less than 75.
Y
Systems with no more than 3 control valves.
Cooling Tower Basics
Cooling towers are used in conjunction with water-cooled chillers. Air-cooled chillers do not require
cooling towers. A cooling tower rejects the heat collected from the building plus the work of
compression from the chiller. There are two common forms used in the HVAC industry: induced draft
and forced draft. Induced draft towers have a large propeller fan at the top of the tower (discharge
end) to draw air counterflow to the water. They require much smaller fan motors for the same capacity
than forced draft towers. Induced draft towers are considered to be less susceptible to recirculation,
which can result in reduced performance.
Figure 15 - Induced Draft Cooling Tower
Forced draft towers have fans on the air
inlet to push air either counterflow or
crossflow to the movement of the water.
Forward curved fans are often
employed. They use more fan power
than induced draft but can provide
external static pressure when required.
This can be important if the cooling
tower requires ducting, discharge cap or
other device that creates a pressure drop.
Condenser water is dispersed through
the tower through trays or nozzles. The
water flows over fill within the tower,
which greatly increases the air-to-water
surface contact area. The water is collected into a sump, which can be integral to the tower or remote
from the tower. The latter is popular in freezing climates where the condenser water can be stored
indoors.
Either tower type can have single or multiple cells. The cells can be headered together on both the
supply and return side with isolation valves to separate the sections. This approach allows more cells
to be added as more chillers are activated or to allow more tower surface area to be used by a single
chiller to reduce fan work.
16 Application Guide AG 31-003-1
Typical Operating Conditions
The Cooling Tower Institute (CTI) rates cooling towers at 78°F ambient wetbulb, 85°F supply water
temperature and a 10°F range. Since it is common (but not necessary) to use a temperature range of
10°F, the cooling tower flow rate will be 3.0 gpm/ton compared to the chilled water flow rate which is
2.4 gpm/ton. The extra condenser water flow rate is required to accommodate the heat from the work
of compression. Cooling towers are very versatile and can be used over a wide range of approaches,
ranges, flows and wetbulb temperatures. Lower condenser water temperatures can be produced in
many climates with low wet bulb temperatures which significantly improves chiller performance.
Figure 16 - Forced Draft Cooling Tower
Cooling Tower Process
Cooling towers expose the condenser water
directly to the ambient air in a process that
resembles a waterfall. The process can cool
condenser water to below ambient drybulb.
The water is cooled by a combination of
sensible and latent cooling. A portion of the
water evaporates which provides the latent
cooling. The example on page 18 shows the
cooling tower process on a psychrometric
chart at ARI conditions. As the wetbulb
temperature drops, cooling towers rely more
on sensible cooling and less on latent cooling.
Ambient air below freezing can hold very little
moisture which leads to large plumes; and in
some cases the winter tower selection requires
a larger tower than the summer conditions.
Additional care should be taken when
selecting cooling towers for use in winter.
Application Guide AG 31-003-1 17
Approximately 1% of the design condenser water flow is evaporated (See the above example). A
1000-ton chiller operating at design conditions can consume 1800 gallons of water per hour. The
specific amount can be calculated by reviewing the psychrometric process. In locations where the cost
of water is an issue, air-cooled chillers may provide a better operating cost despite the lower chiller
performance.
Winter Operation
Cooling towers required to work in freezing winter environments require additional care. The
condenser water must not be allowed to freeze particularly when the tower is idle. Common solutions
include electric or steam injection heaters or a remote sump within the building envelope. The high
RH of ambient winter air results in a plume, which can frost over surrounding surfaces. Low plume
towers are available. Finally, freezing of condenser water on the tower itself can lead to blockage and
reduced or no performance. Modulating water flow through a cooling tower (such as the use of three-
way chiller head pressure control) should be given careful consideration. In many instances this can
lead to increased possibility of freezing the tower.
Psychrometric Process for Cooling Towers
42.4 Btu/lb
52.4 Btu/lb
0.018 lb
w
0.029 lb
w
87.5 ºF
The above psychrometric chart shows the cooling tower process at ARI conditions.
Assume 1 lb. of water is cooled by 1 lb. of air. The water cools from 95°F to 85°F and
releases 10 Btus of heat to the air ( 1 Btu = the amount of heat required to raise the
temperature of 1 lb. of water, 1°F). The 10 Btus of heat raises the enthalpy of air from
42.4 Btu/lb. to 52.4 Btu/lb. and saturates the air. The leaving air condition is 87.5°F and
100% RH. The moisture content went from 0.018 lb.
w
to 0.029 lb.
w
. This means 0.029-
0.018 lb. = 0.011 of water was evaporated which is why it is common to hear that cooling
towers lose about 1% of their water flow to evaporation. The latent heat of vaporization
for water at 85°F is about 1045 Btu/lb. Multiplying the latent heat times the amount of
evaporated water (1045 x 0.011) results in 11.45 Btus of cooling effect. Cooling the
water required 10 Btus, the rest was used to cool the air sensibly. The air entered the
tower at 95°F and left the tower at 87.5°F.
18 Application Guide AG 31-003-1
Water Treatment
Condenser water has all the right ingredients for biological growth; it is warm, exposed to air and
provides surfaces to grow on. In addition, the constant water loss makes water treatment even more
difficult. Both chemical and ozone-based treatment systems are used. A thorough discussion on the
topic of water treatment is beyond the scope of this Guide but it suffices to say, that it is necessary to
provide the proper operation of both the tower and the chiller.
Closed Circuit Coolers
Figure 17 - Chiller Power Vs. Tower Power
4
Cooling towers differ from closed-circuit
coolers in that closed-circuit coolers
reject heat sensibly while cooling towers
reject heat latently. Consider ambient
design conditions of 95°F DB and 78°F
wb. If closed circuit coolers are used, the
condenser water must be warmer than the
ambient drybulb (typically 10°F warmer
or 105°F). This raises the condensing
pressure in the chiller and requires more
overall power for cooling. Closed circuit
coolers are larger than cooling towers for
the same capacity and can be difficult to
locate on the roof.
Cooling Tower Controls
Cooling tower controls provide condenser water at the correct temperature to the chillers. Defining
correct water temperature is very important. Lowering the condenser supply water temperature (to the
chiller) increases the effort by the cooling tower and more fan work can be expected. It also improves
the chiller performance. Figure 17 shows the relationship between chiller and tower work.
Table 2 - Chiller Performance Vs. CSWT
Table 2 shows the range of chiller
improvement that can be expected by
lowering the condenser water supply
temperature. The goal of cooling tower
control is to find the balance that provides
the required cooling with the least use of
power by the chiller plant.
Cooling towers are often provided with
aquastats. This is the most basic level of
control. They are popular for single
chiller–tower arrangements because the control package can be supplied as part of the cooling tower.
The aquastat is installed in the supply (to the chiller) side of the cooling tower. In many cases, the
setpoint is 85°F, which is very poor.
Figure 18 shows the 85°F setpoint and the ARI condenser relief curve which chillers are rated at.
Maintaining 85°F condenser water, while saving cooling tower fan work, will significantly penalize
the chiller. There is some risk that without some condenser relief, the chiller may not operate at lower
part load conditions (The chiller may surge).
4
Braun, J.E., and G.T. Diderrich. 1990. Near-Optimal Control of Cooling Towers For Chilled Water
Systems. ASHRAE Transactions SL-90-13-3, Atlanta, Ga.
Chiller Type Performance
Improvement
(Percent kW /°F
condenser water)
W/C Recip. 1.1 to 1.3
W/C Scroll 1.3 to 1.5
W/C Screw 1.6 to 1.8
W/C Centrifugal 1.0 to 1.6
W/C Centrifugal VFD 2.4 to 2.6
Absorption 1.4 to 1.5
0
500
1000
1500
2000
2500
0.200 0.400 0.600 0.800 1.000
Relative Tower Air Flow
Power (kW)
Tower
Chiller
Total
Optimal
Application Guide AG 31-003-1 19
Figure 18- Chiller Performance with 85 T Setpoint
If aquastats are going to be used, then a lower
setpoint than 85°F should be used. One
recommendation is to set the aquastat at the
minimum condenser water temperature
acceptable to the chiller. The cooling tower
will then operate at maximum fan power and
always provide the coldest possible (based on
load and ambient wet bulb) condenser water
to the chiller until the minimum setpoint is
reached. Then the tower fan work will stage
down and maintain minimum setpoint.
Figure 19 – Chiller Performance with Minimum Setpoint
Minimum chiller setpoints are not a specific
temperature. They change depending on the
chiller load. A conservative number such as
65°F is recommended.
Another method to control cooling towers
dedicated to single chillers is to use the chiller
controller. Most chiller controllers today have
standard outputs which can operate cooling
towers, bypass valves and pumps. The chiller
controller has the advantage of knowing just
how much cooling is actually required by the
chiller for optimum performance.
A method to control either single cell or multiple cell cooling towers serving multiple chillers is to
base the condenser supply water temperature on ambient wetbulb. For this method, set the condenser
water setpoint at the current ambient
wetbulb plus the design approach
temperature for the cooling tower. The
set-point will change as the ambient
wetbulb changes. Limit the setpoint
between the design condenser water temperature (typically 85°F) and the minimum condenser water
temperature (typically 65°F).
The wetbulb method will provide good condenser relief for the chiller and cooling tower fan work
relief when the chiller is not operating at 100% capacity. It can be a good balance between chiller and
tower work.
Ultimately, the best cooling tower control designs are part of a chiller plant optimization program.
These programs monitor the weather, the building load and the power consumption of all the
components in the chiller plant including cooling towers. Using modeling algorithms, the program
calculates the best operating point to use the least power possible and meet the requirements of the
building.
35
45
55
65
75
85
0 102030405060708090100
% Chiller Load
Supply Condenser Water
Temperature
Tower Fans
Operate at Full
Speed
Tower Fans
Modulate to
Maintain
Min SCWT
☺Tip: Using wetbulb plus tower design approach as
a setpoint can strike an excellent balance between
chiller work and cooling tower fan work.
55
60
65
70
75
80
85
90
0255075100
% Chiller Load
Supply Condenser Water
Temperature
ARI 550/590 Max Allowable SCWT For S table Operation
ARI Setpoint
20 Application Guide AG 31-003-1
Cooling Towers and Energy Efficiency
Cooling towers consume power to operate the fans. Induced draft towers should be selected since
they typically use half the fan horsepower force draft towers use. Some form of fan speed control is
also recommended such as piggyback motors, multi-speed motors or Variable Speed Drives (VFDs).
In addition, a sensible controls logic is required to take advantage of the variable speeds.
ASHRAE 90.1-2001 requires the following for heat rejection devices:
Y
Requires fan speed control for each fan motor 7 ½ hp or larger. The fan must be able to operate
at two-thirds speed or less and have the necessary controls to automatically change the speed.
(6.3.5.2)
Exceptions include:
Y
Condenser fans serving multiple refrigeration circuits.
Y
Condenser fans serving flooded condensers
Y
Installations in climates with greater than 7200 CDD50.
Y
Up to one-third of the fans on a condenser or tower with multiple fans, where the lead fans
comply with the speed control requirement.
Load Basics
Figure 20 -Air Handling Equipment
Chilled water coils are used to transfer the heat from the building air to the chilled water. The coils
can be located in air handling units, fan coils, induction units, etc. The air is cooled and dehumidified
as it passes through the coils. The chilled water temperature rises during the process.
Cooling coil performance is not linear with flow. Cooling coils perform 75% cooling with only 50%
chilled water flow and 40% cooling with only 20% flow. As well, the leaving water temperature will
approach the entering air temperature as the load is reduced.
Process loads can reject heat in the chilled water in a variety of ways. A common process load is a
cooling jacket in machinery such as injection molding equipment. Here the chilled water absorbs the
sensible heat of the process.
Control Valve Basics
Control valves are used to maintain space temperature conditions by altering chilled water flow.
Valves can be broken down into groups in several ways. Valves can be two-position or modulating.
Two-position valves are either on or off. Control comes from time weighting. The percentage that
the valve is open over a certain time period dictates the amount of cooling that the cooling coil
actually does. Modulating valves vary the flow in response to the actual load at any given time.
Valves can also be classified as two-way or three-way type. Two-way valves throttle flow while three
divert flow. Refer to Piping Diversity, page 24 for further explanation. There are several different
physical types of valves. Globe valves, ball valves and butterfly valves are all commonly used in the
HVAC industry.
Application Guide AG 31-003-1 21
Figure 21 - Coil and Control Valve Performance Curves
Different kinds of valves have different valve characteristics. Common characteristic types include
linear, equal percentage and quick opening. Control valves used with cooling coils need to have a
performance characteristic that is “opposite” to the coil. Equal percentage control valves are typically
used for two-way applications. For three-way applications, equal percentage is used on the terminal
port and linear is used on the bypass port.
Figure 21 shows an equal percentage control valve properly matched to a cooling coil. The result is
that the valve stem movement is linear with the cooling coil capacity. In other words, a valve stroked
50% will provide 50% cooling.
Sizing Control Valves
Control valves must be sized correctly for the chilled water system to operate properly. An
incorrectly sized control valve cannot only mean the device it serves will not operate properly, it can
also lead to system-wide problems such as low delta T syndrome.
Control valves are typically sized based on the required C
v
. The C
v
is the amount of 60°F water that
will flow through the valve in US gpm, with a 1 PSI pressure drop. The formula is:
G = C
v
(∆P)
½
Where:
G is the flow through the valve in US gpm
C
v
is the valve coefficient.
∆P is the differential pressure required across the control valve.
The required flow at a control valves is defined by the needs on the device (fan coil, unit ventilator or
AHU) it serves. C
v
values for valves are published by valve manufacturers. The required pressure
differential through the valve is the difficult parameter to define.
Figure 22 - Pressure Drops and Cv
Figure 22 shows typical pressure drops from the
supply to the return line for a cooling coil. For a
modulating valve, the valve pressure drop should
be as large a percentage as possible when
compared to the system pressure drop; preferably
over 50%. The reason is to maintain valve
authority. For on-off control, any valve can be
used as long as it can pass the required flow rate
with the pressure differential available.
Design Flow
Heating Output
50%
10%
50%
90%
Stem Travel
Design Flow
10%
50%
50%
90%
Stem Travel
Heating Output
50%
90%
50%
90%
Pressure
Drop
Control Valve PD Should
Be 50% Of Branch PD
22 Application Guide AG 31-003-1
Valve Authority
As a control valve closes, the
pressure drop across the valve
increases so that when the valve is
completely closed, the differential
pressure drop across the valve
matches the pressure drop from the
supply to the return line. This pressure drop is known as ∆P
Max
. When the valve is completely open,
the pressure drop across the valve is at its lowest point and is referred to ∆P
Min.
The ratio (ß) ∆P
Min
/
∆P
Max
is the valve authority. The increase in pressure drop across the valve as it closes is important
to note. Valves are rated based on a constant pressure drop. As the pressure drop shifts, the
performance of the valve changes. The method to minimize the change in valve performance is to
maintain the Valve Authority (ß) above 0.5.
Figure 23 - Distortion of Equal Percentage Valve Characteristic
Figure 23 shows the change in the valve
characteristic that occurs at different Valve
Authorities. Since the goal is to provide a
valve with a performance characteristic that
is the opposite of a coil characteristic (See
Figure 21), it is important to maintain Valve
Authority above 0.5.
☺Tip: When calculating valve C
v
to size valves, use at
least 50% of the system pressure drop from the supply to
the return line to maintain good valve authority. In most
cases, a properly sized control valve will be smaller than
the line size it is installed in.
Valve Authority Example
Consider a control valve with a C
v
= 25 serving a coil that has a design flow of 50 US
gpm. The pressure differential from the supply to the return line is 16 PSI.
As the valve closes, the system pressure shifts to the valve until all the pressure drop
(16 PSI) is across the valve. If the valve was fully opened and there was 16 PSI
across the valve the flow rate would increase to:
Q = C
v
(∆P)
½
= 25(16)
½
= 100 US gpm.
This does not actually happen, however, since the pressure drop through the coil,
balancing valve, etc. increases and limits flow to 50USgpm.
∆P
Min
= (Q)²/( C
v
)² = (50)²/( 25)² = 4 PSI
In this case, the valve authority (ß) is 4 PSI/16 PSI = 0.25. Referring to Figure 23, it
can be seen that the valve performance characteristic is distorted and when matched
to a cooling coil will not provide a linear relationship between valve position and coil
output. This can lead to poor coil performance and low delta T syndrome. The
solution is to try and keep the valve authority above 0.5. In other words, the pressure
drop though the control valve when it is fully open should be at least 50% of the
pressure drop from the supply to return line.
0
10
20
30
40
50
60
70
80
90
100
0 20406080100
Valve Lift, %
Flow Rate, %
A
=
0
.
1
A
=
0
.
2
A
=
0
.
5
A
=
1
Application Guide AG 31-003-1 23
Rangeablity
Rangeablity is a measure of the turndown a control valve can provide. The larger the range, the better
the control at low loads. Typical ranges for control valves are 15:1 to 50:1.
Control Valve Location in Systems
Proper valve selection requires knowing the pressure drop from the supply to the return wherever the
device is located. This information is typically not made available to the controls contractor which
often leads to guessing. One solution would be for the designer to provide the required C
v
for each
valve. Another solution would be to provide the estimated pressure drops for each valve. Because
the pressure drop from the supply to the return changes throughout the system, it can be expected that
different valves with different C
v
s will be required. Even if all the coil flows and pressure drops were
identical, the valves should change depending on location in the system. Lack of attention to this
detail can lead to low delta T syndrome (refer to Low Delta T Syndrome, page 80) that can be very
difficult to resolve.
Loop Control Basics
There are two parameters that need to be considered for the chilled water loop. These are
temperature and flow. The loop supply temperature is usually controlled at the chiller. The unit
controller on the chiller will monitor and maintain the supply chilled water temperature (within its
capacity range). The accuracy to which the chiller can maintain the setpoint is based on the chiller
type, controller quality (a DDC controller with a PID loop is the best), compressor cycle times, the
volume of fluid in the system, etc. Systems with fast changing loads (especially process loads) and
small fluid volumes (close coupled) require special consideration.
The system flow control occurs at the load. To control the cooling effect at the load, two-way or
three-way valves are used. Valve types are discussed in Control Valve Basics, page 20. Valve
selection will also touch on piping diversity and variable vs. constant flow.
Another method to control cooling is face and bypass control at the air cooling coil while running
chilled water through the coil. This approach has the advantage of improved dehumidification at part
load and no waterside pressure drops due to control valves. The disadvantage is the requirement for
continuous flow during any mechanical cooling load. In many cases the pressure drop savings will
offset the continuous operation penalty but only annual energy analysis will clarify it. Face and
bypass coil control is popular with unit ventilator systems with their required high percentage of
outdoor air, and make-up air systems.
24 Application Guide AG 31-003-1
Piping Diversity
Figure 24 - Three-way Valves
Diversity in piping is based on
what type of valves are used.
To maintain the correct space
condition, three-way or two-way
control valves are used. Three-
way control valves direct chilled
water either through or around
the coil to maintain the desired
condition. If all the loads on the
loop use three-way valves, then
the chilled water flow is
constant. The temperature
range varies directly with the
load. That is, if the design
chilled water temperature range
is 10°F, then every 10% drop in
system load represents a 1°F
drop in temperature range. A
system incorporating three-way control valves is easy to design and operate. The system pumps all the
water all the time, however this requires more pump horsepower. In most cases the chiller is sized for
the building peak load. Due to diversity, not all the connected loads will “peak” at the same time as
the building peak load. However, the pumps and piping system must be designed for full flow to all
the control valves all the time. Since the chiller flow rate is the same as the flow rate through all the
loads (they’re connected by the same piping system and pump) the diversity is applied to the chiller
temperature range.
Figure 25 - Two-Way Valves
For example, consider a building
with an 80-ton peak load.
Summing all the connected loads
adds up to 100 tons. In short,
this building has a diversity of
80%. Using a temperature range
of 10°F at each control valve, the
total system flow rate is:
Flow = 24 x 100 tons/10°F =
240 gpm
However, an 80-ton chiller with
240 gpm will only have a
temperature range of 8°F. T he
lower chiller temperature range is
not a problem for the chiller
operation, but it will lower the chiller efficiency. Care must be taken to select the chiller at the proper
temperature range.
When two-way modulating control valves are used, the flow to the coil is restricted rather than
bypassed. If all the valves in the system are two-way type, the flow will vary with the load. If the
valves are properly selected, the temperature range remains constant and the flow varies directly with
the load. In this case the diversity is applied to the chilled water flow rate.
Temperature Range Across
Load Remains Constant.
Flow Varies With Load
CW Pump Sized For
Chiller Flow Rate
At Design Delta T
2 Way Valve
Chiller Sized For
Peak Load
CW Pump Sized For
Connected Flow
3 Way Valve
Flow Is Constant At Each Coil
Delta T Changes With Load
Chiller
Coil
44F Supply
Chiller Sized For
Peak Load
Coil Bypass
Line
Application Guide AG 31-003-1 25
Using the previous example, the peak load is 80 tons and the design flow is 2.4 x 80 tons or 192 gpm.
The connected load is still 100 tons and requires 240 gpm if all the two-way control valves are open at
the same time. The 80% diversity assumes only 80% of the valves will be open at the peak load.
The advantage of two-way control valves is both the pump and the piping are sized for a smaller flow
rate, offering both first cost and operating savings. The difficulty is that the chiller and control system
must be designed for variable flow. The chiller has a minimum flow rate so the piping design has to
allow for enough flow during all operating conditions to meet the chiller minimum flow rate. Using
two-way valves is the main building block for a variable flow system.
Water Temperatures and Ranges
Selection of temperature ranges can affect the chiller plant operation and energy usage. The limiting
temperatures are the required supply air temperature and either the ambient wetbulb (water or
evaporatively cooled chillers) or drybulb (air cooled chillers) temperatures. Once these have been
identified, the HVAC system must operate within them.
Supply Air Temperature
The chilled water supply temperature is tied to the supply air temperature. The chilled water
temperature must be cold enough to provide a reasonable log mean temperature difference (LMTD)
(Refer to McQuay AG 31-002, Centrifugal Chiller Fundamentals, for more information on LMTD)
for a cooling coil to be selected. Traditionally this has resulted in a 10°F approach which, when
subtracted from 55°F supply air temperature, has led to the 44 or 45°F chilled water temperature.
Lowering the chilled water temperature will increase the approach allowing a smaller (in rows and
fins and hence air pressure drop) coil to be used. It will also increase the lift that the chiller must
overcome and that will reduce the chiller performance.
Figure 26 - Chiller Heat Exchanger Conditions
The air pressure drop savings for small
changes (2 to 4°F) in the approach do not
generally save enough in fan work to
offset the chiller penalty. This is
particularly true for VAV where the
pressure drops inside an air handling unit
follow the fan affinity laws. The power
required to overcome the coil pressure
drop decrease by the cube root as the air
volume decreases. A 20% decrease in
airflow results in a 36% decrease in
internal air pressure drop and a 49% drop
in bhp.
It is sometimes suggested that the chilled
water supply temperature be 2°F colder
than the supply water temperature used to
select the cooling coils to make sure the
“correct” water temperature is delivered
to the coils. This is not recommended.
For a 10°F chilled water temperature
range, a 2°F temperature increase implies
C
O
N
D
E
N
S
E
R
F
L
U
I
D
T
E
M
P
E
R
A
T
U
R
E
C
O
O
L
E
R
F
L
U
I
D
T
E
M
P
E
R
A
T
U
R
E
SATURATED SUCTION TEMPERATURE {T }
R
HEAT OF
CONDENSATION
HEAT OF
VAPORIZATION
97°F
118.3 psig
R-134a
42°F
36.6 psig
R-134a
LIFT
(°F)
95°F
44°F
θ
2
θ
2
θ
1
θ
1
T
2
T
2
T
1
T
1
54°F
85°F