Tài liệu phát triển bền vững living planet report 2020
Bạn đang xem bản rút gọn của tài liệu. Xem và tải ngay bản đầy đủ của tài liệu tại đây (16.46 MB, 164 trang )
REPORT
IN T
2012
Living Planet
Report 2012
Biodiversity, biocapacity
and better choices
CuuDuongThanCong.com
/>
WWF
WWF is one of the world’s largest and most experienced independent
conservation organizations, with over 5 million supporters and a global network
active in more than 100 countries.
WWF’s mission is to stop the degradation of the planet’s natural environment
and to build a future in which humans live in harmony with nature, by
conserving the world’s biological diversity, ensuring that the use of renewable
natural resources is sustainable, and promoting the reduction of pollution and
wasteful consumption.
Zoological Society of London
Founded in 1826, the Zoological Society of London (ZSL) is an international
scientific, conservation and educational organization. Its mission is to achieve
and promote the worldwide conservation of animals and their habitats. ZSL
runs ZSL London Zoo and ZSL Whipsnade Zoo, carries out scientific research in
the Institute of Zoology and is actively involved in field conservation worldwide.
Global Footprint Network
The Global Footprint Network promotes the science of sustainability by
advancing the Ecological Footprint, a resource accounting tool that makes
sustainability measurable. Together with its partners, the Network works
to further improve and implement this science by coordinating research,
developing methodological standards, and providing decision-makers with
robust resource accounts to help the human economy operate within the Earth’s
ecological limits.
European Space Agency
The European Space Agency (ESA) is Europe’s gateway to space. Its mission is to
shape the development of Europe’s space capability and ensure that investment
in space continues to deliver benefits to the citizens of Europe and the world.
ESA is an international organization with 19 member states. By coordinating
the financial and intellectual resources of its members, it can undertake
programmes and activities far beyond the scope of any single European country.
The Agency’s various programmes are designed to find out more about Earth, its
immediate space environment, our solar system and the universe.
WWF International
Avenue du Mont-Blanc
1196 Gland, Switzerland
www.panda.org
Global Footprint Network
312 Clay Street, Suite 300
Oakland, California 94607, USA
www.footprintnetwork.org
Institute of Zoology
Zoological Society of London
Regent’s Park, London NW1 4RY, UK
www.zsl.org/indicators
www.livingplanetindex.org
European Space Agency
ESA HQ Mario-Nikis
8-10 rue Mario Nikis
75738 Paris Cedex 15
France
Design by millerdesign.co.uk
Cover photograph: KARI / ESA
ISBN 978-2-940443-37-6
CuuDuongThanCong.com
/>
CONTENTS
FOREWORD AND EXECUTIVE SUMMARY
European Space Agency: Observing Earth from space
4
Earth needs more space by André Kuipers
5
Keeping this a living planet by Jim Leape
6
7 billion expectations, one planet
8
At a glance
12
CHAPTER 1: THE STATE OF THE PLANET
14
The Living Planet Index
16
The Ecological Footprint
36
Population, urbanization and development
52
The Water Footprint
62
CHAPTER 2: WHY WE SHOULD CARE
68
Linking biodiversity, ecosystem services and people
70
Forests
74
Rivers
82
Oceans
84
Scramble for land
88
CHAPTER 3: WHAT DOES THE FUTURE HOLD?
90
Climate change impacts
92
The use of scenarios
98
Projecting the Ecological Footprint to 2050
100
Modelling natural capital in Sumatra
101
The Living Forests model
102
CHAPTER 4: BETTER CHOICES FOR A LIVING PLANET
104
Closing words
124
ANNEX: TECHNICAL NOTES AND DATA TABLES
126
Annex 1: Living Planet Index
128
Annex 2: Ecological Footprint
135
Annex 3: Glossary and abbreviations
146
REFERENCES
153
ongThanCong.com
/>
Contributors
Editor in chief: Monique Grooten.
Lead editors: Rosamunde Almond and Richard McLellan.
Editorial team: Nigel Dudley, Emma Duncan, Natasja Oerlemans
and Sue Stolton.
Reviewers
William F. Laurance, FAAAS (Distinguished Research Professor and
Australian Laureate, Centre for Tropical Environmental and Sustainability
Science (TESS) and School of Marine and Tropical Biology, James Cook
University, Cairns, Australia; and Prince Bernhard Chair for International
Nature Conservation, Utrecht University, Utrecht, the Netherlands).
Pita Verweij (Copernicus Institute of Sustainable Development, Faculty
of Geosciences, Utrecht University, the Netherlands).
Zoological Society of London (ZSL):
Louise McRae and Ben Collen (section leads Living Planet Index); with
Stefanie Deinet, Peter Hill, Jonathan Loh, Jonathan E. M. Baille and
Victoria Price.
Global Footprint Network (GFN):
Gemma Cranston (section lead Ecological Footprint); with Mathis
Wackernagel, Michael Borucke, Alessandro Galli, Kyle Gracey, Katsunori
Iha, Joy Larson, Scott Mattoon, David Moore, Juan Carlos Morales and
Pati Poblete.
WWF:
Neil Burgess, Antje Ahrends, Nirmal Bhagabati, Brendan Fisher, Emily
McKenzie and Kirsten Schuyt (ecosystem services); Jessica Battle (marine);
Carina Borgstrom-Hansson (cities); Ashok Chapagain (Water Footprint);
Bart Wickel and Lifeng Li (freshwater); Elaine Geyer-Allely (population
and development); Rod Taylor and Therese Tepe (forests); and Nicholas
Sundt (climate change).
With special thanks for review and additional contributions
from: Naikoa Aguilar-Amuchastegui, Keith Allott, Jason Anderson,
Victor Anderson, Simon Anstey, Alberto Arroyo-Schnell, Mike Baltzer,
Adam Barlow, Eugenio Barrios, Andreas Baumueller, Karin Bilo,
Gianfranco Bologna, Bruce Cabale, Sandra Charity, Boping Chen, Sarah
Christie, Jason Clay, Carol Day, Adrian Dellecker, Kristina Van Dexter,
Cristina Eghenter, Wendy Elliott, Helen Fox, Neva Frecheville, Erik
Gerritsen, Aimee Gonzales, Johan van de Gronden, May Guerraoui,
Lasse Gustavsson, Pablo Gutman, Chris Hails, Ray Hilborn,
Reinier Hille Ris Lambers, Richard Holland, Jeff Hutchings, Colby Loucks,
Andrea Kohl, Jim Leape, Lou Leonard, Aimee Leslie, Jonathan Loh, Imke
Luebbeke, Gretchen Lyons, László Máthé, Anne Meikle, Sergy Moroz,
Sally Nicolson, Stuart Orr, Anouk Pasquier, Helen Pitman, Mark Powell,
Gerry Ryan, Anke Schulmeister, Alfred Schumm, Claudia Schweizer,
Stephan Singer, Samantha Smith, Gerald Steindlegger, Paul Sunters,
Jon Taylor, Michele Thieme, Samuel Turvey, Niall Watson, George White,
Luke Wreford, Julia Young and Natascha Zwaal.
European Space Agency:
Robert Meisner (section lead); with Rosita Suenson, Bernhard von Weyhe,
Nadia Imbert-Vier, Roberto LoVerde and Chiara Solimini.
ongThanCong.com
/>
Living Planet
Report 2012
Biodiversity, biocapacity
and better choices~
CuuDuongThanCong.com
/>
European Space Agency:
Observing the Earth from space
The European Space Agency (ESA) has participated in the
elaboration of this year’s Living Planet Report by providing
satellite information and data with the aim of highlighting the
essential importance of space for monitoring Earth as a whole
and understanding the impact of human activity on our planet.
ESA does not endorse the content of the Living Planet Report.
ESA has been dedicated to observing Earth from space
since the launch of its first weather satellite in 1977. While ESA
continues to develop satellites to advance meteorology, the focus
today is also very much on understanding how Earth works as
a system and how human activity is affecting natural processes.
Satellites offer the only practical means of monitoring
Earth as a whole. Sensitive spaceborne instruments gather
precise data to unravel the complexities of our planet and track
changes taking place, especially those associated with the effects
of climate change.
Apart from benefitting European research requirements,
this also ensures that decision-makers are equipped with the
information to tackle the challenges of climate change, secure
a sustainable future and respond to natural and humaninduced disasters.
ESA’s “workhorse” missions, ERS and Envisat, revealed
new insight into many aspects of Earth. Each carrying a suite of
instruments, these missions have led to a better understanding
of air pollution and ozone holes, mapped the height and
temperature of the sea surface, monitored the changing face
of polar ice, and tracked the way land is used.
The Earth Explorer missions address urgent scientific
questions such as Earth’s gravity, ice-thickness change, the
water cycle, the magnetic field, wind, the role clouds play in
Earth’s energy balance, and the carbon cycle.
In parallel, ESA develops missions called Sentinels to
feed services for Europe’s Global Monitoring for Environment
and security programme. The data is used for a wide range of
applications to manage the environment, such as monitoring
biodiversity, natural resources, air quality, oil spills, volcanic
ash, and to support humanitarian aid and emergency response
in times of disaster.
WWF Living Planet Report 2012 page 4
CuuDuongThanCong.com
/>
EARTH NEEDS MORE SPACE!
PromISSe is my second mission into space. This time I will live
on the International Space Station for five months, unlike my first
mission of 11 days in 2004. However, those 11 days in space changed
my life. Seeing Earth from space provides a unique perspective. Our
planet is a beautiful and fragile place, protected only by a very thin
layer of atmosphere essential for life on our planet. And seemingly
large forests turned out to be small and passed by very quickly. It
was this perspective, and realization, that lie behind my motivation
to become a WWF ambassador.
The European Space Agency is conducting research to provide
information about the health of our planet. Some of the threats
to a healthy planet are visible to the naked eye, while others are
translated into figures stating how, where and why the world is
changing. What I can see from space is reflected in the report in
your hands.
In this ninth edition of the Living Planet Report, the key indices
again show unsustainable pressures on the planet. We now know
that the demands on natural resources like fish, timber and food
are rocketing to a level that is impossible to replenish sustainably.
All I care about, and cherish, is on this one planet.
It is my home, the home of my family and friends, and the home
of another 7 billion people. It is also the home of beautiful forests,
mountains, savannahs, oceans, lakes and rivers and of all of the
species living within. Our planet is beautiful, but our planet is
also fragile.
We have the ability to save our home, to protect our planet. Not only
for our own benefit but, above all, for generations to come. We have
the solutions. Everyone can make a contribution by making better
choices in how we govern, produce and consume. Taking better care
of the planet is in our hands.
André Kuipers
Astronaut, European Space Agency
Foreword and Executive summary page 5
CuuDuongThanCong.com
/>
© André Kuipers / ESA
Looking out of my window and watching Earth from space comes
with my job as an astronaut. Nevertheless, I feel I am privileged.
KEEPING THIS A LIVING PLANET
We are living as if we have an extra planet at our disposal. We are
using 50 per cent more resources than the Earth can provide, and
unless we change course that number will grow very fast – by 2030,
even two planets will not be enough.
But we do have a choice. We can create a prosperous future that
provides food, water and energy for the 9 or perhaps 10 billion
people who will be sharing the planet in 2050.
We can produce the food we need without expanding the footprint
of agriculture – without destroying more forest, or using more
water or chemicals. Solutions lie in such areas as reducing waste,
which now claims much of the food we grow; using better seeds and
better cultivation techniques; bringing degraded lands back into
production; and changing diets – particularly by lowering meat
consumption in high income countries.
We can ensure there is enough water for our needs and also
conserve the healthy rivers, lakes and wetlands from which
it comes. Smarter irrigation techniques and better resource
planning, for example, can help us use water more efficiently.
Most fundamentally, we need to establish water management
regimes that involve a broader range of stakeholders, and that
manage river basins as the complex, richly diverse living systems
that they are.
We can meet all of our energy needs from sources like wind and
sunlight that are clean and abundant. The first imperative is to get
much more out of the energy we use – increasing the efficiency
of our buildings, cars and factories can cut our total energy use in
half. If we make those savings, then it is possible to meet all of our
needs from renewable sources, so long as we focus on driving those
technologies into the economy and ending the $700 billion
in subsidies that keep us hooked on oil and coal.
WWF Living Planet Report 2012 page 6
CuuDuongThanCong.com
/>
© WWF-Canon / www.ateliermamco.com
We are all familiar with the stark array of graphs – carbon
emissions, deforestation, water scarcity, overfishing – that detail
how we are sapping the Earth’s resources and resilience. This 2012
edition of the Living Planet Report tells us how it all adds up – the
cumulative pressure we’re putting on the planet, and the consequent
decline in the health of the forests, rivers and oceans that make our
lives possible.
20 YEARS AFTER THE
MOMENTOUS EARTH
SUMMIT, THIS IS A
CRUCIAL OPPORTUNITY
TO TAKE STOCK OF
WHERE THE WORLD
IS HEADING AND HOW
WE’D LIKE OUR FUTURE
TO TAKE SHAPE
June 2012 will see the nations of the world, businesses and a broad
sweep of civil society representatives gather in Rio de Janeiro for
the UN Conference on Sustainable Development. Twenty years after
the momentous Earth Summit, this is a crucial opportunity to take
stock of where the world is heading and how we’d like our future to
take shape.
This can and must be the moment for governments to set a new
course toward sustainability. It is also a unique opportunity for
coalitions of the committed to step up – governments in regions
like the Congo Basin or the Arctic, joining together to manage the
resources they share; cities challenging and inspiring each other
to reduce carbon emissions and create more liveable urban spaces;
companies who are competitors in the marketplace nonetheless
joining forces to drive sustainability into their supply chains and
offering products that help customers use less resources; and
pension funds and sovereign wealth funds investing in green jobs.
These solutions, and others articulated within this edition of the
Living Planet Report, show that we all need to play a role in keeping
this a living planet – with food, water and energy for all, and the
vibrant ecosystems that sustain life on Earth.
Jim Leape
Director General
WWF International
Foreword and Executive summary page 7
CuuDuongThanCong.com
/>
7 BILLION EXPECTATIONS
ONE PLANET
Within the vast immensity of the universe, a thin layer of life
encircles a planet. Bound by rock below and space above, millions
of diverse species thrive. Together, they form the ecosystems and
habitats we so readily recognize as planet Earth – and which, in
turn, supply a multitude of ecosystem services upon which people,
and all life, depend.
Ever-growing human demand for resources, however, is
putting tremendous pressures on biodiversity. This threatens the
continued provision of ecosystem services, which not only further
threatens biodiversity but also our own species’ future security,
health and well-being.
This ninth edition of the Living Planet Report documents the
changing state of biodiversity, ecosystems and humanity’s demand
on natural resources; and explores the implications of these changes
for biodiversity and human societies. The report highlights that
current trends can still be reversed, through making better choices
that place the natural world at the centre of economies, business
models and lifestyles.
Chapter 1 presents the state of the planet as measured by
three complementary indicators. Including data from many more
species’ populations than previously, the Living Planet Index
continues to show around a 30 per cent global decline in biodiversity
health since 1970 (Figure 1). This trend is seen across terrestrial,
freshwater and marine ecosystems, but is greatest for freshwater
species, whose populations show an average 37 per cent decline.
The tropical freshwater index declined even more precipitously, by
70 per cent. Overall, the global tropical index declined by 60 per
cent since 1970. In contrast, the index for temperate regions
increased by 31 per cent over the same period. However, this does
not necessarily mean that temperate biodiversity is in a better state
than tropical biodiversity, as the temperate index disguises huge
historical losses prior to the start of the analysis.
The Ecological Footprint shows a consistent trend of overconsumption (Figure 2). In 2008, the most recent year for which
data are available, the footprint exceeded the Earth’s biocapacity
– the area of land and productive oceans actually available to
produce renewable resources and absorb CO2 emissions – by more
than 50 per cent. The carbon footprint is a significant driver of
this “ecological overshoot” – the term used to describe when, at
a global level, the Ecological Footprint is larger than biocapacity.
WWF Living Planet Report 2012 page 8
CuuDuongThanCong.com
/>
THE LIVING PLANET
INDEX CONTINUES TO
SHOW AROUND A 30
PER CENT GLOBAL
DECLINE SINCE 1970
Key
Global Living Planet
Index
Confidence limits
2
Index Value (1970 = 1)
Figure 1: Global
Living Planet Index
(WWF / ZSL, 2012)
1
0
1970
1975
1980
1985
1990
1995
2000
2005 2008
Year
2
Number of Planet Earths
Figure 2: Global
Ecological Footprint
(Global Footprint
Network, 2011)
1
0
1961
1970
1980
1990
2000
2008
Year
A new analysis of consumption trends in BRIICS (Brazil, Russia,
India, Indonesia, China and South Africa) countries as well as in
different income and development groups, together with population
and urbanization trends, underline the worrying potential for
humanity’s footprint to increase even more in the future.
The Water Footprint of Production provides a second
indication of human demand on renewable resources. For the
first time, this report includes an analysis of water availability
throughout the year in the world’s major river basins. This shows
that 2.7 billion people around the world already live in catchments
that experience severe water shortages for at least one month a year.
Chapter 2 highlights the links between biodiversity,
ecosystem services and people. The impacts of human activities on
three ecosystems – forests, freshwater and marine – are examined
Foreword and Executive summary page 9
CuuDuongThanCong.com
/>
in more detail, as well as specific analysis of ecosystem services
they provide. Competing claims on natural resources such as
commercial pressures on agricultural land in developing countries
are also discussed.
The Living Planet Report offers a view on the planet’s
health. WWF also looks beyond the data to understand the human
expectations and struggles, demands and contributions that are
driving change on Earth. In this edition of the Living Planet Report,
Kenyan farmer Margaret Wanjiru Mundia will help us do just
that. Margaret will be introduced in Chapter 2. In contrast to this
individual perspective, we also take a view of the world through
extraordinary images from the European Space Agency (ESA).
Chapter 3 looks at what the future might hold. Possible
effects of climate change are examined and various scenarios are
presented, including for the Ecological Footprint. These analyses
indicate that continuing with “business as usual” will have serious,
and potentially catastrophic, consequences. In particular, continued
increases in greenhouse gas emissions will irreversibly commit the
world to a global average temperature rise of well over 2oC, which
will severely disrupt the functioning of almost all global ecosystems
and dramatically affect human development and well-being.
Clearly, the current system of human development, based on
increased consumption and a reliance on fossil fuels, combined with
a growing human population and poor overall management and
governance of natural resources, is unsustainable. Many countries
and populations already face a number of risks from biodiversity
loss, degraded ecosystem services and climate change, including:
food, water and energy scarcity; increased vulnerability to natural
disasters; health risks; population movements; and resource-driven
conflicts. These risks are disproportionately borne by the poorest
people, even though they contribute relatively least to humanity’s
Ecological Footprint.
While some people may be able to use technology to
substitute for some lost ecosystem services and to mitigate against
climate change effects, these risks will only increase and become
more widespread if we keep to “business as usual”. Emerging
economies risk not meeting their aspirations for improved living
standards, and high-income countries and communities risk seeing
their current well-being eroded.
Forward-thinking governments and businesses have begun
making efforts to mitigate these risks, for example by promoting
renewable energy, resource efficiency, more environmentally
friendly production and more socially inclusive development.
However, the trends and challenges outlined in this report show
that most current efforts are not enough.
WWF Living Planet Report 2012 page 10
CuuDuongThanCong.com
/>
FORWARD-THINKING
GOVERNMENTS
AND BUSINESSES
HAVE BEGUN
MAKING EFFORTS
TO MITIGATE THESE
RISKS BY PROMOTING
RENEWABLE ENERGY
So, how can we reverse declining biodiversity, bring the Ecological
Footprint down to within planetary limits, and effectively reduce the
pace of human induced climate change and reverse the damaging
impacts? And how can we do this while ensuring equitable access
to natural resources, food, water and energy for a growing number
of people?
Chapter 3 provides some solutions that we already have
at hand: Alternative future scenarios based on changed food
consumption patterns and halting deforestation and forest
degradation illustrate some of the immediately available options
for reducing ecological overshoot and mitigating climate change.
These are expanded in Chapter 4, which presents WWF’s One Planet
perspective for managing natural capital – biodiversity, ecosystems
and ecosystem services – within the Earth’s ecological limits.
In addition to large-scale conservation and restoration efforts,
this perspective seeks better choices along the entire system of
production and consumption that drive the preservation of natural
capital, supported by redirected financial flows and more equitable
resource governance. Implementing such a paradigm shift will be a
tremendous challenge, involving uncomfortable decisions and tradeoffs. But our scenarios show we can reduce the Ecological Footprint,
and mitigate climate change trends, using current knowledge and
technologies – and begin the path to healthy, sustainable and
equitable human societies.
ALL 193 MEMBER
STATES OF THE
UNITED NATIONS
COMMITTED UNDER
THE MILLENNIUM
DEVELOPMENT GOALS
TO END POVERTY,
PROTECT BIODIVERSITY
AND REDUCE
GREENHOUSE
GAS EMISSIONS
The Living Planet Report and Rio +20
Some of the most significant international agreements
addressing the challenges facing our planet were developed
20 years ago when the world’s leaders met in Rio de Janeiro.
Among other initiatives, they signed the Convention on
Biological Diversity and the UN Framework Convention on
Climate Change, and set in motion the process to develop
the Convention to Combat Desertification. The underlying
message of the meeting was reinforced when all 193 member
states of the United Nations committed under the Millennium
Development Goals to end poverty, protect biodiversity and
reduce greenhouse gas emissions. In June 2012, Rio +20 will
be assessing what has happened since, and what fresh steps
are needed to address urgent problems of environmental
security, equity and resource management. The Living
Planet Report provides important information to this pivotal
meeting and delegates will be able to read a special conference
summary (www.panda.org/lpr).
Foreword and Executive summary page 11
CuuDuongThanCong.com
/>
AT A GLANCE
Chapter 1: The state of the planet
Biodiversity has declined globally
• The global Living Planet Index declined by almost 30 per cent
between 1970 and 2008.
• The global tropical index declined by 60 per cent during the
same period.
• The global temperate index increased by 31 per cent; however
this disguises huge historical losses prior to 1970.
• The global terrestrial, freshwater and marine indices all declined,
with the freshwater index declining the most, by 37 per cent.
• The tropical freshwater index declined even more precipitously,
by 70 per cent.
Human demands on the planet exceed supply
• Humanity’s Ecological Footprint exceeded the Earth’s
biocapacity by more than 50 per cent in 2008.
• In recent decades, the carbon footprint is a significant
component of this ecological overshoot.
• Biocapacity per person decreased from 3.2 global hectares
(gha) in 1961 to 1.8 gha per capita in 2008, even though total
global biocapacity increased over this time.
• Rising consumption trends in high-income groups around
the world and in BRIICS countries, combined with growing
population numbers, provide warning signs of the potential
for even larger footprints in the future.
Many river basins experience water scarcity
• Examining scarcity on a monthly basis reveals many river basins
that seem to have sufficient supplies based on annual averages are
actually overexploited, hampering critical ecosystem functions.
• 2.7 billion people around the world live in catchments that
experience severe water scarcity for at least one month a year.
Chapter 2: Why we should care
Our wealth, health and well-being are dependent on
ecosystem services
• Many areas of high biodiversity also provide important ecosystem
services such as carbon storage, fuel wood, freshwater flow and
fish stocks. Human activities are affecting the continued provision
of these services.
WWF Living Planet Report 2012 page 12
CuuDuongThanCong.com
/>
• Deforestation and forest degradation currently account for up
to 20 per cent of global anthropogenic CO2 emissions, including
losses from forest soils.
• Only a third of the world’s rivers that are longer than 1,000km
are free flowing and without dams on their main channel.
• A nearly five-fold increase in global marine fish catch, from 19
million tonnes in 1950 to 87 million tonnes in 2005, has left
many fisheries overexploited.
• The frequency and complexity of land use competition will rise
as human demands grow. Throughout the developing world,
there is an unprecedented rush by outside investors to secure
access to land for future food and fuel production.
• The loss of biodiversity and its related ecosystem services
particularly impacts the poor, who rely most directly on these
services to survive.
Chapter 3 What does the future hold?
Scenarios present a variety of plausible future alternatives
• The past few decades have been warmer than any other
comparable period for at least the last 400 years.
• Limiting the global average warming to 2ºC above preindustrial levels is likely to require emission reductions larger
than 80 per cent below peak levels. If emissions continue to
grow, large regions probably will individually exceed a 2ºC
increase in average annual temperatures by 2040.
• The declining Living Planet Index and rising Ecological
Footprint emphasize the need for more sustainable policies.
Scenarios can help us make better informed choices for
the future.
• Scenarios highlight the importance of conserving biodiversity
to protect ecosystem services.
Chapter 4 Better choices for a living planet
There are solutions for living within the means of
one planet
• Natural capital – biodiversity, ecosystems and ecosystem
services – must be preserved and, where necessary, restored
as the foundation of human economies and societies.
• WWF’s One Planet perspective proposes how to manage, govern
and share natural capital within the Earth’s ecological limits.
• 16 “better choices” from a global One Planet perspective are
highlighted, together with priority objectives for realizing
these goals.
Foreword and Executive summary page 13
CuuDuongThanCong.com
/>
CHAPTER 1: THE STATE
OF THE PLANET~
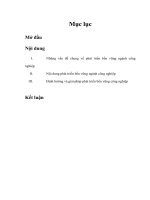
This image captures the meticulously planned cultivated landscape
of the autonomous communities of Aragon (west) and Catalonia in
northeastern Spain. Many agricultural crops can be seen growing
including wheat, barley, fruits and vegetables. The circular shape
of many of the fields indicates central-pivot irrigation is being
employed; a well drilled in the centre of each circle supplies water to
a rotating series of sprinklers.
design note:
Check for gutter and repeat image if necessary
CuuDuongThanCong.com
/>
© KARI / ESA
CuuDuongThanCong.com
/>
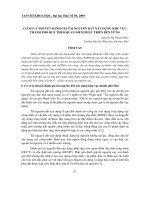
THE LIVING PLANET INDEX
The Living Planet Index reflects changes in the state of the
planet’s biodiversity, using trends in population size for
vertebrate species from different biomes and regions to
calculate average changes in abundance over time. It includes
data from more than 9,000 different wildlife monitoring
schemes collected in a wide variety of ways – ranging from
counting the number of individual animals, to camera
trapping, to surveys of nesting sites and animal traces.
Main image: Researcher and a polar bear, Svalbard, Norway.
Below: Rangers attach a ring tag to a baby brown booby.
Camera trap photo of a Sumatran rhinoceros, Borneo.
Whale shark tagging, Donsol, Sorsogon, Philippines.
© Jurgen Freund / WWF-Canon
© WWF-Malaysia / Raymond Alfred
© Jurgen Freund / WWF-Canon
CuuDuongThanCong.com
/>
© Jon Aars / Norwegian Polar Institute / WWF-Canon
CuuDuongThanCong.com
/>
MONITORING GLOBAL
BIODIVERSITY
Given the complexity of global biodiversity, it is very difficult to
provide a complete picture of its overall health. But much as a
stock market index measures the state of the market by tracking
changes in market capitalization of a selection of companies,
changes in abundance (i.e., the total number of individuals in a
given population) across a selection of species can be used as one
important indicator of the planet’s ecological condition.
The Living Planet Index suggests that across the globe,
vertebrate populations were on average one-third smaller in 2008
than they were in 1970 (Figure 3). This is based on trends in the size
of 9,014 populations of 2,688 mammal, bird, reptile, amphibian and
fish species – many more than in previous editions of the Living
Planet Report (WWF, 2006b; 2008b; 2010a).
Index Value (1970 = 1)
2.0
-28%
1.0
Figure 3: The Global
Living Planet Index
The index shows a decline
of 28% from 1970 to 2008,
based on 9,014 populations
of 2,688 species of birds,
mammals, amphibians,
reptiles and fish.
Shading on this, and
all Living Planet Index
figures represents the
95% confidence limits
surrounding the trend; the
wider the shading, the more
variable the underlying
trend (WWF/ZSL, 2012).
Key
Global Living Planet
Index
Confidence limits
0
1970
1975
1980
1985
1990
1995
2000
2005 2008
Year
WWF Living Planet Report 2012 page 18
CuuDuongThanCong.com
/>
GLOBAL
LPI
terrestrial
LPI
temperate
tropical
marine
LPI
temperate
terrestrial
tropical
terrestrial
tropical
marine
species
1
temperate
freshwater
tropical
freshwater
species
2
population
1
freshwater
LPI
temperate
marine
species
3
population
2
population
3
Figure 4: Turning
population trends
into the Living Planet
indices
VERTEBRATE
POPULATIONS IN THE
GLOBAL LPI WERE ON
AVERAGE ONE-THIRD
SMALLER IN 2008 THAN
THEY WERE IN 1970
Each population in the Living Planet Index is classified according to
whether it is located in a temperate or tropical region, and whether
it predominantly lives in a terrestrial, freshwater or marine system.
These classifications are specific to the population rather than to
the species, so some species are included in more than one index.
For example, species with both freshwater and marine populations,
such as salmon, or migratory species found in both tropical and
temperate zones are recorded separately. No populations are
double counted. These groups are used to comprise the temperate
and tropical indices, as well as terrestrial, freshwater and marine
indices, which together calculate the global Living Planet Index
(Figure 4). There are more populations in the temperate index than
there are in the tropical index. Therefore, to avoid biasing the global
index toward population trends in temperate zones, the tropical and
temperate indices are given equal weight in the global index (more
details on this are included in Annex 1).
In addition, each terrestrial and freshwater species’
population is classified to a realm according to its geographic
location. Realm indices are calculated by giving equal weight to each
species, with the exception of the Palearctic realm where, for the
first time in this analysis, each family is given equal weight. This was
done to reduce bias toward bird species, for which there are many
more population records compared to other species in this realm.
Chapter 1: The state of the planet page 19
CuuDuongThanCong.com
/>
Exploring the Living Planet Index
The Living Planet Index is a composite indicator that measures
changes in the size of wildlife populations to indicate trends in
the overall state of global biodiversity. Trends within a particular
population only show what is happening to a species within a
particular area. To create a robust index, comprehensive population
data are collected for as many species and populations as possible
from around the world. While some populations increased during
the time they have been monitored, others have decreased. On
average, however, the magnitude of population decreases exceeded
that of the increases, so overall the index shows a global decline.
Figure 6: European otter (Lutra lutra),
Denmark
After suffering serious population declines in
the 1960s and ’70s, improved water quality
and control of exploitation helped a recovery
in Denmark from 1984 to 2004, as well as in
several other countries.
Note: Data are from Normander et al., 2009.
Spawning stock
biomass (tonnes)
60,000
0
1971
2004
450
Otter numbers
Figure 5: Northern bluefin tuna (Thunnus
thynnus), Western Atlantic Ocean
Unsustainable levels of fishing have caused a
catastrophic decline in this population since
the 1970s. Because bluefin tuna has a very high
commercial value, fishing pressure has continued
and, as a result, the species as a whole is in
danger of extinction.
Note: Data are from International Commission
for the Conservation of Atlantic Tunas (ICCAT)
cited in Safina and Klinger, 2008.
0
2004
1972
2010
1,800
Population size
(breeding pairs)
Figure 7: Wandering albatross (Diomedea
exulans), Bird Island, South Georgia, South
Atlantic Ocean
This population has been in steady decline since
1972. The primary cause is believed to be incidental
mortality from entanglement in longline fishing
equipment. One proposed measure to protect this
species is to design and implement longlines that
mitigate this bycatch.
Note: Based on unpublished data from the
British Antarctic Servey long-term monitoring
programme 2012.
1984
0
WWF Living Planet Report 2012 page 20
CuuDuongThanCong.com
/>
© naturepl.com / Doug Perrine / WWF-Canon
View from below of silhouette of diver and Atlantic sailfish (Istiophorus albicans) attacking bait
ball of Spanish sardines / gilt sardine / pilchard / round sardinella (Sardinella aurita) off Yucatan
Peninsula, Mexico, Caribbean Sea.
CuuDuongThanCong.com
/>
Tropical and Temperate Living Planet Indices
The tropical Living Planet Index declined by just over 60 per
cent from 1970 to 2008, while the temperate Living Planet Index
increased by 31 per cent over the same period (Figure 8). This
difference holds true for mammals, birds, amphibians and fish; for
terrestrial, marine and freshwater species (Figures 9-11); and across
all tropical and temperate biogeographic realms (Figures 16-20).
Due to the lack of published data prior to 1970, historic
changes to biodiversity cannot be captured in the Living Planet
Index and so all indices are set to an equal value of one in 1970.
However, as described in more detail in the following pages, there
has been considerable variation in population trends both between
individual species and species that share the same broad habitats.
Index Value (1970 = 1)
2.0
+31%
1.0
-61%
Figure 8: The tropical
and temperate Living
Planet indices
The tropical index is
calculated from terrestrial
and freshwater populations
from the Afrotropical,
Indo-Pacific and Neotropical
realms and from marine
populations between the
Tropics of Cancer and
Capricorn. The temperate
index is calculated from
terrestrial and freshwater
populations from the
Palearctic and Nearctic
realms, and marine
populations found north
or south of the tropics. The
global tropical index shows
a decline of around 61%
between 1970 and 2008.
The global temperate index
shows an increase of around
31% over the same period
(WWF/ZSL, 2012).
Key
Temperate Living
Planet Index
Confidence limits
0.0
1970
1975
1980
1985
1990
1995
2000
2005 2008
Year
Tropical Living
Planet Index
Confidence limits
Recent average population increases do not necessarily mean that
temperate ecosystems are in a better state than tropical ecosystems.
The observed temperate Living Planet Index trend is the result
of four intertwined phenomena: a recent baseline; differences
in trajectory between taxonomic groups; notable conservation
successes; and recent relative stability in species’ populations. If
the temperate index extended back centuries rather than decades, it
would very likely show a long-term decline at least as great as that of
the tropical index in recent years. Conversely, a long-term tropical
index would likely show a much slower rate of change prior to 1970.
Populations of some temperate species have increased in
recent years due to conservation efforts. These include US wetland
birds (BirdLife International, 2008), UK breeding birds, seabirds
and overwintering birds (Defra, 2010), and certain cetacean
populations, such as the western Arctic population of Bowhead
WWF Living Planet Report 2012 page 22
CuuDuongThanCong.com
/>
whales (Balaena mysticetus), which was estimated at 1,0003,000 individuals at the end of commercial whaling but has since
recovered to an estimated 10,545 individuals in 2001 (Angliss and
Outlaw, 2006).
The Terrestrial Living Planet Index
Figure 9: The terrestrial
Living Planet Index
(a) The global terrestrial
index shows a decline of
around 25% between 1970
and 2008; (b) The temperate
terrestrial index shows an
increase of about 5%, while
the tropical terrestrial index
shows a decline of around
44% (WWF/ZSL, 2012).
The global terrestrial Living Planet Index declined by 25 per cent
between 1970 and 2008 (Figure 9a). The terrestrial index includes
3,770 populations from 1,432 species of birds, mammals, amphibians
and reptiles from a broad range of temperate and tropical habitats,
including forests, grasslands and drylands. The tropical terrestrial
index declined by almost 45 per cent, while the temperate terrestrial
index increased by about 5 per cent (Figure 9b).
Key
Global terrestrial
index
Confidence limits
Index Value (1970 = 1)
2.0
-25%
1.0
0.0
1970
1975
1980
1985
1990
1995
2000
2005 2008
Year
2.0
Temperate terrestrial
index
Confidence limits
Tropical terrestrial
index
Confidence limits
Index Value (1970 = 1)
Key
+5%
1.0
-44%
0.0
1970
1975
1980
1985
1990
1995
2000
2005 2008
Year
Chapter 1: The state of the planet page 23
CuuDuongThanCong.com
/>