Tài liệu Các mạng UTMS và công nghệ truy cập vô tuyến P2 docx
Bạn đang xem bản rút gọn của tài liệu. Xem và tải ngay bản đầy đủ của tài liệu tại đây (427.63 KB, 28 trang )
The UMTS Network and Radio Access Technology: Air Interface Techniques for Future Mobile Systems
Jonathan P. Castro
Copyright © 2001 John Wiley & Sons Ltd
Print ISBN 0-471-81375-3 Online ISBN 0-470-84172-9
S
YSTEM
A
NALYSIS
F
UNDAMENTALS
2.1 F
UNDAMENTALS OF
S
YSTEM
A
NALYSIS
Third generation systems focus on providing a universal platform to afford multifarious
communications options at all levels, i.e. the radio as well as the core network sides.
This implies the application of optimum techniques in multiple access and inter-
working protocols for the physical and upper layers, respectively. This chapter dis-
cusses the background of the multiple access or radio part of the UMTS specification.
Several sources [5–9] have already covered all types of fundamentals related to the air-
interface. Thus, we focus only on the communications environment to access the radio
link performance for coverage analysis and network dimensioning in forthcoming chap-
ters.
2.1.1 Multiple Access Options
The access technologies utilized in UTRA are unique because of the type of implemen-
tation and not because they are new. The combination of CDMA and TDMA techniques
in one fully compatible platform, make UTRA special. The WCDMA and hybrid
TDMA/CDMA form the FDD and TDD modes to co-exist seamlessly to meet the
UMTS services and performance requirements. In the sequel we cover the fundamental
characteristics for each access technique which serves as a building block for the UTRA
modes.
2.1.1.1 Narrow-band Digital Channel Systems
The two basic narrow-band techniques include FDMA (using frequencies) and TDMA
(using time slots). In the first case, frequencies are assigned to users while guard bands
maintain between adjacent signal spectra to minimize interference between channels. In
the second case, data from each user takes place in time intervals called slots. The ad-
vantages of FDMA lie on efficient use of codes and simple technology requirements.
But the drawbacks of operating at a reduced signal/interference ratio and the inhibiting
flexibility
1
of bit rate capabilities outweigh the benefits. TDMA allows flexible rates in
multiples of basic single channels and sub-multiples for low-bit rate broadcast transmis-
sion. It offers frame-by-frame signal management with efficient guard band arrange-
ments to control signal events. However, it requires substantial amounts of signal proc-
essing resources to cope with matched filtering and synchronization needs.
_______
1
The maximum bit per channel remains fixed and low.
14 The UMTS Network and Radio Access Technology
2.1.1.2 Wide-band Digital Channel Systems
Some of the drawbacks and limitations in the narrow-band channel systems made room
for wide-band channel system designs. In wide-band systems the entire bandwidth re-
mains available to each user, even if it is many times larger than the bandwidth required
to convey the information. These systems include primarily Spread Spectrum (SS) sys-
tems, e.g. Direct Sequence Spread Spectrum (DSSS) and Frequency Hopping Spread
Spectrum (FHSS). In DSSS, emphasized in this book, the transmission bandwidth ex-
ceeds the coherent bandwidth, i.e. the received signal after de-spreading resolves into
multiple time-varying delay signals that a RAKE receiver can exploit to provide an in-
herent time diversity receiver in a fading environment. In addition, DSSS has greater
resistance to interference effects when compared to FDMA and TDMA. The latter
greatly simplifies frequency band assignment and adjacent cell interference. In addition,
capacity improvements with DSSS or more commonly referred to as DS-CDMA
2
, re-
sulting from the voice activity factor, which we cannot apply effectively to FDMA or
TDMA. With DS-CDMA, e.g. adjacent micro-cells share the same frequencies, whereas
interference in FDMA and TDMA does not allow this. Other benefits and features can
be found in [10–12]. Here we focus on the WCDMA or FDD mode and TDMA/
CDMA or TDD mode of the UTRA solution.
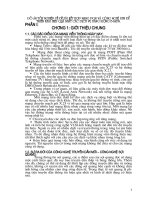
2.1.1.3 The UTRA FDD Mode: WCDMA
Figure 2.1 illustrates some of the UTRA Frequency Division Duplexing (FDD) charac-
teristics. This mode uses Wide-band Direct-Sequence Code Division Multiple Access
(DS-CDMA), denoted WCDMA. To support bit rates up to 2 Mbps, it utilizes a variable
spreading factor and multi-code links. It supports highly variable user data rates through
the allocation of 10 ms frames, during which the user data rate remains constant, al-
though the latter may change from frame to frame depending on the network control. It
realizes a chip rate of 3.84 Mcps within 5 MHz carrier bandwidth, although the actual
carrier spacing can be selected on a 200 kHz grid between approximately 4.4 and
5 MHz, depending on the interference situation between the carriers.
Ã
QrÃ
ÃArrpÃ
9vssrrÃrhqvtÃshpÃ
rtÃhyyvtÃ'±"'#ÃxiÃ
##$ÃHCÃ
CvtuÃivÃhrÃ
rvprÃ
WhvhiyrÃivÃhrÃ
rvprÃ
ÃÃ
UvrÃ
Figure 2.1 The UTRA WCDMA or FDD mode characteristics.
_______
2
Direct Sequence Code Division Multiple Access.
System Analysis Fundamentals 15
The FDD has a self timing point of reference through the operation of asynchronous
BSs, and it uses coherent detection in the up- and downlink based on the use of pilot
reference symbols. Its architecture allows the introduction of advanced capacity and
coverage enhancing CDMA receiver techniques, e.g. multi-user detection and smart
adaptive antennas. In addition, it will seamlessly co-exist with GSM networks through
its inter-system handover functions of WCDMA.
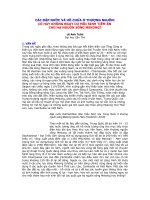
2.1.1.4 The UTRA TDD Mode: TD/CDMA
The 2nd UTRA mode results from the combination of TDMA–FDMA and exploits
spreading as part of its CDMA component. It operates in Time Division Duplexing
using the same frequency channel.
Qr
ÃArrp
HyvpqrÃÃHyvy
##$ÃHC
Hyvy
Hyvpqr
PVIUDPH
Uvr
WhvhiyrÃTrhqvt
Figure 2.2 UTRA TDD mode characteristics.
In this mode, the MSs can only access a Frequency Division Multiplexing (FDM) chan-
nel at specific times and only for a specific period of time. Thus, if a mobile gets one or
more Time Slots (TS) allocated, it can periodically access this set of TSs throughout the
duration of the frame. Spreading codes described in Chapter 4 separate user signals
within one or more slots. Hence, in the TDD mode we define a physical channel by a
code, one TS, and one frequency, where each TS can be assigned to either the uplink or
the downlink depending on the demand. Users may obtain flexible transmission rates by
occupying several TSs of a frame as illustrated in Figure 2.2, without additional proc-
essing resources from the transceiver hardware. On the other hand, when more than one
frequency channel gets occupied, utilization of transceiver resources will increase if the
wide-band transmission cannot prevent it. We achieve variable data rates through either
multi-code transmission with fixed spreading or through single code with variable
spreading. In the 1st case, a single user or users may get multiple spreading codes
within the same TS; while in the 2nd case, the physical channel spreading factor may
vary according to the data rate.
16 The UMTS Network and Radio Access Technology
2.1.2 Signal Processing Aspects
In the following, we review Signal Processing characteristics for the WCDMA as well
as TD/CDMA as a base to describe key functions of the UTRA FDD and TDD modes.
These include spreading aspects and modulation and coding.
2.1.2.1 The Spread Spectrum Concept
Digital designs of communications systems aim to maximise capacity utilization. We
can for example increase channel capacity by increasing channel bandwidth, and/or
transmitted power. In this context, CDMA operates at much lower S/N ratios as a result
of the extra channel bandwidth used to achieve good performance at low signal-to-noise
ratio. From Shannon’s channel capacity principle [22] expressed as:
ß
à
Þ
Ï
Ð
Î
+=
1
6
%& ORJ
where B is the bandwidth (Hz), C is the channel capacity (bits/s), S is the signal power,
and N is the noise power; we can find a simple definition of the bandwidth as:
6
1&
% =
Thus, for a particular S/N ratio, we can achieve a low information error rate by increas-
ing the bandwidth used to transfer information. To expand the bandwidth here, we add
the information to the spreading spectrum code before modulation. This approach ap-
plies for example to the FDD mode, which uses a code sequence to determine RF
bandwidth. The FDD mode has robustness to interference due to higher system process-
ing gain
3
G
p
. The latter quantifies the degree of interference rejection and can be de-
fined as the ratio of RF bandwidth to the information rate:
S
%
*
5
=
From Ref. [23] in a spread-spectrum system, thermal noise and interference determine
the noise level. Hence, for a given user, the interference is processed as noise. Then, the
input and output S/N ratios can relate as:
S
RL
66
*
1 1
ËÛ ËÛ
=
ÌÜ ÌÜ
ÍÝ ÍÝ
Relating the S/N ratio to the E
b
/N
o
ratio
4
, where E
b
is the energy per bit and N
o
is the
noise power spectral density, we get:
EE
L
RRS
(5(
6
1 1%1*
ËÛ
==
ÌÜ
ÍÝ
From the preceding equations we can express E
b
/N
o
in terms of the S/N input and output
ratios as follows:
_______
3
Reference processing gains for spread spectrum systems have been established between 20 and 50 dBs.
4
Unless otherwise specified, here we assume that N
o
includes thermal and interference noise.
System Analysis Fundamentals 17
E
S
LR
R
(
66
*
1 11
ËÛËÛ
= =
ÌÜÌÜ
ÍÝÍÝ
2.1.2.2 Modulation and Spreading Principles
In wide-band spread-spectrum systems like the FDD mode, the entire bandwidth of the
system remains available to each user. To such systems, the following principles apply:
first, the spreading signal has a bandwidth much larger than the minimum bandwidth
required to transfer desired information or base-band data. Second, data spreading oc-
curs by means of a code spreading signal, where the code signal is independent of the
data and is of a much higher rate than the data signal. Lastly, at the receiver, de-
spreading takes place by the cross-correlation of the received spread signal with a syn-
chronized replica of the same signal used to spread the data [23].
2.1.2.2.1 Modulation
If we view Quadrature Phase-Shift Keying (QPSK) as two independent Binary Phase-
Shift Keying (BPSK) modulations, then we can assume the net data rate doubles. We
now provide the background for QPSK to serve as background to the applications in
UTRA presented in Chapter 4.
For all practical purposes we start with M-PSK, where M = 2
b
, and b = 1, 2 or 3 (i.e. 2-
PSK or BPSK, 4-PSK or QPSK and 8-PSK). In the case of QPSK modulation the phase
of the carrier can take on one of four values 45°, 135°, 225°, or 315° as we shall see
later. The QPSK power spectral density (V
2
/Hz) could be then defined as
()
()
VF
V
VF
VLQ
7I I
6I $7
7I I
Ñá
p-ÎÞ
ÔÔ
Ðà
=
Òâ
p-ÎÞ
ÔÔ
Ðà
Óã
where f
c
is the unmodulated carrier frequency, A is the carrier amplitude, and T
s
is the
symbol interval. When T
b
is the input binary bit interval, T
s
may be expressed as
VE
ORJ77 0=
The power spectral density of an unfiltered M-PSK signal occupies a bandwidth which
is a function of the symbol rate r
s
= (1/T
s
). Thus, for a given transmitter symbol, the
power spectrum for any M-PSK signal remains the same regardless of the number M of
symbol levels used. This implies that BPSK, QPSK and 8-PSK signals each have the
same spectral shape if T
s
remains the same in each case.
Spectral Efficiency
For a M-ary PSK scheme each transmitted symbol represents log
2
M bits. Hence, at a
fixed input bit rate, as the value of M increases, the transmitter symbol rate decreases;
which means that there is in increase in spectral efficiency for larger M.
Thus, if for any digital modulation the spectral efficiency
h
s
, (i.e. the ratio of the input
data rate r
b
and the allocated channel bandwidth B) is given by:
E
V
U
%
h=
ELWV+]
18 The UMTS Network and Radio Access Technology
the 8-PSK spectral efficiency will be three times as great as that for BPSK. However,
this will be achieved at the expense of the error probability.
Now allocating the RF bandwidth of a M-PSK signal we should remember that its spec-
trum rolls off relatively slowly. Therefore, it is necessary to filter the M-PSK signal so
that its spectrum is limited to a finite bandpass channel region avoiding adjacent chan-
nel interference. Using Nyquist filtering or raised cosine filtering prevents the adjacent
channel interference, as well as the intersymbol interference (ISI) due to filtering. The
raised-cosine spectra are characterized by a factor
a
B
, known as the excess bandwidth
factor. This factor lies in the range 0–1, and specifies the excess bandwidth of the spec-
trum compared to that of an ideal bandpass spectrum (
a
B
= 0) for which the bandwidth
would be B = r
s
. Typical values of
a
B
used in practice are 0.3–0.5 [3].
Thus, for M-PSK transmission using the Nyquist filtering with roll-off
a
B
the required
bandwidth will be given by
()
V%
%U=+a
Then the maximum bit rate in terms of the transmission bandwidth B, and the roll-off
factor
a
B
can be defined as
E
%
ORJ
% 0
U =
+a
However, if we assume an M-PSK with an ideal Nyquist filtering (i.e.
a
B
= 0) the signal
spectrum is centred on f
c
, it is constant over the bandwidth B = 1/T
s
, and it is zero out-
side that band. Then the transmitted bandwidth for the M-PSK signal, and the respective
spectral efficiency are given by
E
V
E
DQGORJ
ORJ
U
% 0
70 %
=h==
Bit Error Rate (BER) Performance
In M-PSK modulation, the input binary information stream is first divided into b bit
blocks, and then each block is transmitted as one of M possible symbols; where each
symbol is a carrier frequency sinusoid having one of M possible phase values [3].
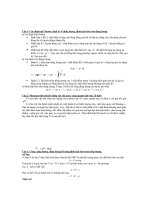
Among the M-PSK schemes, BPSK and QPSK are the most widely used. Nevertheless,
here we review only the QPSK scheme. In QPSK each transmitted symbol (Figure 2.3)
represents two input bits as follows:
Input bits Transmitted symbols
00 A cos(w
c
t + 45°)
01 A cos(w
c
t + 135°)
11 A cos(w
c
t + 235°)
10 A cos(w
c
t + 315°)
System Analysis Fundamentals 19
The conversion from binary symbol to phase angles is done using Gray coding. This
coding permits only one binary number to change in the assignment of binary symbols
to adjacent phase angles, thereby minimizing the demodulation errors, which in a digital
receiver result from incorrectly selecting a symbol adjacent to a correct one.
Figure 2.3 illustrates a block diagram frequently used for any form of M-PSK modula-
tion. For QPSK, the multiplexer basically converts the binary input stream into two par-
allel, half rate signal v
I
(t) and v
Q
(t) (i.e. the in-phase and quadrature signals). These sig-
nals taking values +A/
¥
or –A/
¥
in any symbol interval, are fed to two balanced
modulators with input carriers or relative phase 0° and 90°, respectively. Then the
QPSK signal could be given by
( ) ( ) ( )
,F4F
FRV VLQV W Y W ZW Y W ZW=+
If we assume T
s
is the time interval and v
I
= +A/
¥
and v
Q
= –A/
¥
, it can be shown that
the output s(t) is
()
F
FRV
VW $ Z
p
ËÛ
=-
ÌÜ
ÍÝ
Q
I
01
00
11
10
QPSK signal vector diagram
X
X
90
deg.
+
+
Demultiplexer
sin(wct)
cos(wct)
70 MHz
oscillator
v
Q
(t)
v
I
(t)
(b)
QPSK Modulation
Binary NRZ
Input DATA
r
b
= bit/s
Output
QPSK
Signal
(a)
Figure 2.3 QPSK configuration, after [3].
Assuming a coherent demodulator, the latter includes a quadrature detector consisting
of two balanced multipliers with carrier inputs in phase quadrature, followed by root-
Nyquist filter in the output I and Q arms. Then, the resultant I and Q signals are sam-
pled at the centre of each symbol to produce the demodulator output I and Q signals,
which in turn are delivered to the decoder [3].
Generally, an M-PSK modulator produces symbols with one of M phase values spaced
0
apart. Then each signal is demodulated correctly at the receiver when the phase is
within
0
radians of the correct phase at the demodulator sampling instant. If noise is
present, evaluation of the probability of error requires a calculation of the probability
20 The UMTS Network and Radio Access Technology
that the received phase lies outside the angular segment within
0
radians of the trans-
mitted symbol at the sampling instant.
Therefore, the probability that a demodulator error occurs can be referred to as the sym-
bol error probability P
s
. In the context of the M-ary modulation scheme with M = 2
b
bits, each symbol represents b bits. The most probable symbol errors are then those that
choose an incorrect symbol adjacent to the correct one. When using Gray coding, only
one bit error results from a symbol error. Thereupon, the bit error probability P
b
is re-
lated to the symbol error probability by
V
E
3
3
P
=
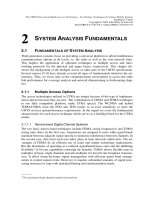
In the case of QPSK, symbol errors occur when the noise pushes the received phasor
into the wrong quadrant as illustrated in Figure 2.4. In this figure it is assumed that the
WUDQVPLWWHG V\PERO KDV D SKDVHRI UDGFRUUHVSRQGLQJWRWKHGHPRGXODWRU,DQG4
values of v
I
= V and v
Q
= V volts (i.e. noise-free case). Thus, if we consider that the
noise phasors (n
1
and n
2
) are pointing in directions that are most likely to cause errors,
then a symbol error will occur if either n
1
or n
2
exceeds V.
Q axis
I Axis
noise
noise
n
2
n
1
Transmitted
signal
Received
signal
Figure 2.4 Transmitted and received signal vectors [3].
Now, if for simplicity we also assume that a QPSK signal is transmitted without
Nyquist filtering and demodulated with hard-decisions, the probability of a correctly
demodulate symbol value is equal to the product of the probabilities that each demodu-
lator low-pass filter output lies in the correct quadrant. Then the probability that the
demodulated symbol value is correct is given by
( )( )
FHH
3 33=- -
where P
e1
and P
e2
are the probabilities that the two filter output sample values are in the
wrong quadrant. When showing that the low-pass filters are equivalent to integrators,
which is the optimum choice if Nyquist filtering is not used, P
e1
and P
e2
can be ex-
pressed as
V
H H
R
(
334
1
ËÛ
==
ÌÜ
ÌÜ
ÍÝ
System Analysis Fundamentals 21
where E
s
= A
2
T
s
/2 is the energy per symbol, N
o
/2 is the two-sided noise power noise
spectral density (in V
2
/Hz) at the demodulator input, and the function Q(x) is the com-
plementary integral Gaussian function. The error function erf(x) given by
()
()
HUI H[S G
[
[ \\=-
p
×
and complementary error function erfc(x) expressed as
( ) ( )
HUIF HUI[ [=-
are not fully identical to the integral Gaussian function G(x), and the complementary
integral G
c
(x) or Q(x) in our case. Now if we assume G
c
(x) = Q(x), we can use the fol-
lowing
()
HUIF
[
4[
ËÛ
=
ÌÜ
ÍÝ
function to evaluate our error probabilities. Then since P
e1
= P
e2
,
the symbol error prob-
ability could be written as
V F H H
3 333=- = -
which at P
e1
EHFRPHV
VH
3 3
Substituting P
e1
from equation (2.17) into equation (2.22), the QPSK symbol error
probability can be given by
V
V
R
(
34
1
ËÛ
ÌÜ
ÌÜ
ÍÝ
Now, for QPSK E
s
= 2E
b
, where E
b
is the energy per bit; then making use of equation
(2.C.3) we get the bit error rate probability P
BER
for the QPSK system as follows:
E
%(5
R
(
34
1
ËÛ
=
ÌÜ
ÌÜ
ÍÝ
Here we found the P
BER
assuming that no Nyquist filtering was present. However ac-
cording to Ref. [3], this P
BER
also holds when root-Nyquist filters are used at the trans-
mitter and receiver under the assumption that the demodulator input energy E
b
and the
noise power density N
o
are the same for both cases.
2.1.2.3 CDMA System Performance
As noted earlier, CDMA systems tolerate more interference than typical TDMA or
FDMA systems. This implies that each additional active radio user coming into the
22 The UMTS Network and Radio Access Technology
network increases the overall level of interference to the cell site receivers receiving
CDMA signals from mobile station transmitters. This depends on its received power
level at the cell site, its timing synchronization relative to other signals at the cell site,
and its specific cross-correlation with other CDMA signals. Consequently, the number
of CDMA channels in the network will depend on the level of total interference that the
system can tolerate. As a result, the FDD mode behaves as an interference limited sys-
tem, where technical design will play a key role in the overall quality and capacity per-
formance. Thus, despite advanced techniques such as multi-user detection and adaptive
antennas, a robust system will still need a good bit error probability with a higher level
of interference.
When we consider that at the cell site all users receive the same signal level assuming
Gaussian noise as interference, the modulation method has a relationship that defines
the bit error rate as a function of the E
b
/N
o
ratio. Therefore, if we know the performance
of the signal processing methods and tolerance of the digitized information to errors, we
can define the minimum E
b
/N
o
ratio for a balanced system operation. Then, if we main-
tain operation at this minimum E
b
/N
o
, we can obtain the optimum performance of the
system. From Ref. [23] we can define the relationship between the number of mobile
users M, the processing gain G
p
, and the E
b
/N
o
ratio as follows:
()
S
ER
*
0
( 1
On the other hand, the E
b
/N
o
performance can be seen better in relation with Shannon’s
limit in AWGN
5
, which simplified can be presented as:
H
ORJ
&6
% 1
ËÛ
<
ÌÜ
ÍÝ
DQG
E
HR
ORJ
&(&
% 1%
ËÛ
ËÛ
<
ÌÜ
ÌÜ
ÍÝ
ÍÝ
then
E
H
ORJ
(
%
==-
G%
provides error-free communications. Then for Shannon’s limit the number of users can
be projected from:
S
S
*
0 *==
Shannon’s theoretical limit implies that a WCDMA system can support more users per
cell than classical narrow-band systems limited by the number of dimensions. On the
other hand, this limit in practice has E
b
/N
o
= 6 dB as a typical value. However, due to
practical limitations, accommodating as many users in a single cell as indicated by
Shannon’s limit is not possible in a CDMA system, and this applies also to the UTRA
FDD. Thus, cell capacity depends upon many factors, (e.g. receiver-modulation per-
_______
5
Additive White Gaussian Noise.
System Analysis Fundamentals 23
formance, power control accuracy, intersystem interference), and the upper-bound theo-
retical capacity of an ideal noise-free CDMA channel has also limitations by the proc-
essing gain G
p
[23].
Multiple transmissions in neighbouring CDMA cells using the same carrier frequency
cause interference, denoted by
IDFWRU7KLVHYHQWZLOO FDXVHUHGXFWLRQRIWKHQXPEHU
of users in a cell, because the interference from users in other cells has to be added to
WKHLQWHUIHUHQFHJHQHUDWHGE\WKHRWKHUPRELOHVLQWKHXVHU¶VFHOO PD\UDQJHIURP
to 0.55. In addition to the interference factor, we also introduce the imperfect power
con
WURORUSRZHU FRQWURODFFXUDF\IDFWRU ZKLFK UDQJHVIURP WR,QWHUIHUHQFH
FDQEHUHGXFHGE\WKHYRLFHDFWLYLW\IDFWRU
UDQJLQJIURPWR,IZHXVHGLUH
c-
tional antennas at the base station, the sectorized cell will have a sectors, the antennas
used at the cell each will radiate into a sector of 360/a degrees, resulting in an interfer-
ence im
SURYHPHQWIDFWRU $YHUDJHYDOXHVIRU DQG VHFWRUFHOODUH
0.6 and 2.55, respectively [23]. Then incorporating all the preceding factors the user
capacity equation becomes:
S
ER
*
0
(1
al
+bn
In the forthcoming section we also review pseudorandom sequences as part of the signal
processing aspects relevant for the operation of the UTRA modes.
2.1.2.4 Pseudorandom Sequences
Pseudorandom noise (PN), i.e. deterministic periodic sequences in WCDMA perform
the following tasks: bandwidth spreading of the modulated signal to wider transfer
bandwidths, signal discrimination among users transmitting in the same bandwidth of
multiple access methods.
The characteristics of these sequences are: 1/2 relative frequencies of zero and one; for
zeros or ones half of all run lengths are of length 1; one-quarter are of length 2, one-
eighth are of length 3; etc. When a PN sequence shifts by any non-zero number of ele-
ments, the resulting sequence will have an equal number of agreements and disagree-
ments with respect to the original sequence.
We generate PN sequences by combining feedback shift register outputs. This register
consists of consecutive two-state memory or storage stages and feedback logic. Binary
sequences shift through the shift register in response to clock pulses. We logically com-
bine the contents of the stages to produce the input to the first stage. The initial contents
of the stages and feedback logic determine the successive contents of the stages. We
call a feedback shift register and its output linear when the feedback logic consists en-
tirely of modulo-2 adders.
The output sequences get classified as either maximal length or non-maximal length.
The first ones are the longest sequences that can be generated by a given shift register of
a given length, while all other sequences besides maximal length sequences are non-
maximal length sequences. In the binary shift register sequence generators, the maximal
length sequence has 2
n
–1 chips, where n is the number of stages in the shift registers. A